Climate Risk Got Priced. The Money Still Isn't Moving
$1.6 Trillion in Fossil Exposure, $26 Billion in Adaptation Finance
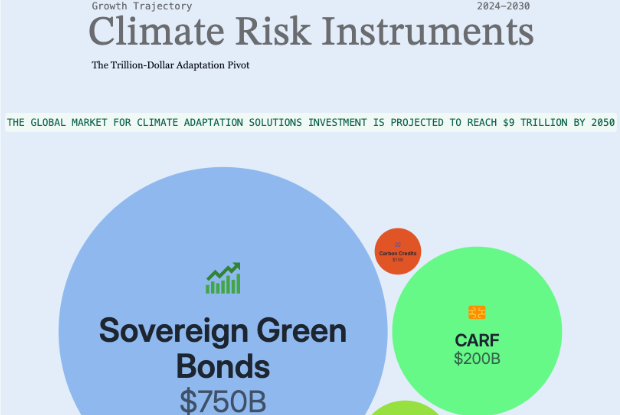
- Exposure Still Held: Fossil-fuel credit still on bank balance sheets.
- Capital Committed: Capital raised through labeled sustainable debt.
- Risk Transferred: Physical climate risk transferred to capital markets.
- The Adaptation Gap: Adaptation finance needed versus actually delivered.

Visual Intelligence by FactsFigs.com
UNEP Adaptation Gap Report 2025
Data Source: UNEP Adaptation Gap Report 2025

Overview
Climate risk financialization means treating climate change as a measurable financial variable rather than an ethical one — something to be priced, disclosed, hedged and traded like credit risk or interest-rate risk.
By that standard it has largely succeeded. Fifty-nine sovereigns have raised a cumulative $695 billion in labeled sustainable debt. The catastrophe bond market hit a record $61.3 billion outstanding at the end of 2025 after $25.6 billion of new issuance. Compliance carbon markets traded roughly $1.5 trillion in value in 2024. Disclosure frameworks that barely existed a decade ago are now embedded in regulation across major jurisdictions.
The machinery works. Where it has not delivered is adaptation. International public adaptation finance to developing countries was $26 billion in 2023 — down from $28 billion the year before — against modelled annual needs of $310 billion by 2035, rising to $365 billion using countries' own national plans. That is a shortfall of roughly twelve to fourteen times.
Meanwhile the world's 60 largest banks still carry more than $1.6 trillion in credit exposure to coal, oil, gas and fossil-fuel power. This piece looks at what climate finance has actually built, and at the specific place where the capital is not arriving.
What Financialization Actually Means Here
The term sounds abstract, but the underlying idea is narrow and testable: climate change produces effects that can be assigned a number, and once assigned a number they can be managed with existing financial machinery.
That machinery is well established. If a risk can be quantified, it can be priced into a loan, hedged with a derivative, transferred to a capital-markets investor, or disclosed to shareholders. None of this requires new theory — only that the underlying exposure be measurable.
The consequence is that climate stops being solely a policy question and becomes a balance-sheet question. A coastal property portfolio has a flood exposure. A refinery has a transition exposure. A sovereign borrower has both.
Whether that is sufficient is the question this piece examines. Pricing a risk accurately and doing something about it are different achievements, and the data suggests the first has advanced considerably further than the second.
Physical Risk and Transition Risk
The field splits climate exposure into two categories, and the distinction matters because they behave differently and move on different timescales.
Physical risk is damage from the climate itself — storms, flooding, wildfire, drought, sea-level rise. It can be acute, as with a single hurricane destroying insured property, or chronic, as with gradual coastal erosion reducing land value over decades. It is broadly measurable using catastrophe models built by the insurance industry over forty years.
Transition risk is the cost of the shift away from carbon. A carbon price, an emissions regulation, a technology change or a shift in consumer demand can strand an asset that was economically sound under the previous regime. A coal plant with twenty years of engineering life left may have five years of economic life.
The two can pull in opposite directions. Slow transition means higher physical risk later; fast transition means higher transition risk now. An institution hedging one is not necessarily hedging the other.
The $1.6 Trillion Still on the Other Side
Any account of climate finance that only counts green instruments is measuring one side of a ledger. Research published by Finance Watch in 2025 found that the world's 60 largest banks carry more than $1.6 trillion in credit exposure to coal, oil and gas production and fossil-fuel power.
That figure is larger than the entire cumulative sovereign labeled sustainable bond market built up across 59 countries and more than a decade of issuance. It is a useful corrective to headline numbers about green finance growth, which are almost always reported without the corresponding exposure.
The exposure is also the transition risk, held directly. If decarbonisation accelerates, a meaningful portion of that lending is against assets whose economic life shortens. If it does not accelerate, physical risk rises across the rest of the book.
None of this makes the lending improper — these are legal businesses supplying current energy demand. The point is narrower: the same institutions expanding climate finance are simultaneously carrying fossil exposure that exceeds it, and both belong in any honest total.
Where the Instruments Have Genuinely Worked
Catastrophe bonds are the clearest success in the category, and they deserve credit that broader climate-finance claims often do not.
The market reached a record $61.3 billion outstanding at the end of 2025, growing $11.9 billion or 24% over the year. New issuance hit a record $25.6 billion across 122 transactions — the first year above $20 billion and the first above 100 deals. Fifteen new sponsors entered, itself an annual record.
The mechanism is straightforward. An insurer or government issues a bond whose principal is forgiven if a defined catastrophe occurs. Investors earn a yield for accepting that risk; the sponsor converts an unpredictable loss into a known cost. Physical climate risk moves from balance sheets that cannot absorb it to capital markets that can.
What makes cat bonds work is that the risk is specific, modelled and time-bound. A named-storm trigger in a defined region over a defined period is something an underwriter can price. That specificity is exactly what more diffuse climate exposures lack.
Sovereign Green Bonds: 59 Countries, $695 Billion
Sovereign issuance is the other area where the numbers are substantial and verifiable. Fifty-nine sovereigns have issued a cumulative $695 billion in the labeled sustainable bond market, with green bonds accounting for the large majority among advanced-economy issuers.
Emerging-market sovereigns show a different pattern, leaning toward sustainability bonds — which fund social alongside environmental spending — rather than pure green bonds. That reflects genuinely different fiscal priorities rather than weaker commitment.
The wider labeled market is larger still: cumulative green, social, sustainability and sustainability-linked issuance reached $8.1 trillion by the end of 2025, of which $6.8 trillion met Climate Bonds Initiative alignment screening. The 16% that did not is a reminder that a label is a claim, not a verification.
The persistent critique is additionality — whether a green bond funds spending that would not otherwise have happened, or relabels spending already planned. Issuance volume cannot answer that question, and the honest position is that it varies considerably by issuer.
Carbon Markets: Two Markets, Wildly Different Scales
Carbon markets are routinely discussed as a single thing. They are two, separated by roughly three orders of magnitude, and conflating them produces badly wrong conclusions.
Compliance markets — where emitters must surrender allowances under law, as in the EU Emissions Trading System — traded a value of approximately $1.5 trillion in 2024, up from $950 billion in 2023, covering around 15.7 gigatonnes of CO2 equivalent. This is a large, liquid, regulated market.
Voluntary markets, where companies buy credits by choice to offset emissions, are minute by comparison. Published estimates for 2025 range from about $1.6 billion to roughly $16 billion depending on methodology — and that spread, of nearly ten times between credible estimates of the same market in the same year, is itself the most informative fact about it.
The voluntary market has also contracted from earlier peaks following sustained scrutiny of whether credited emissions reductions were real and additional. Projections of $100 billion or more by 2030 circulate widely, but they describe a market that would have to grow by an order of magnitude from a base that recently shrank.
The Number That Undercuts the Optimism
Set against those instrument totals is a figure that is difficult to reconcile with any narrative of a completed pivot.
The UN Environment Programme's Adaptation Gap Report 2025, published in October 2025, found that international public adaptation finance flowing from developed to developing countries was $26 billion in 2023 — down from $28 billion in 2022. The direction of travel is negative.
Against that, modelled adaptation finance needs for developing countries reach $310 billion a year by 2035, rising to $365 billion when calculated from the plans countries have themselves submitted. The resulting gap is $284-339 billion annually, or twelve to fourteen times current flows.
UNEP titled the report 'Running on Empty'. That is not the language of an institution describing a market successfully mobilising capital, and it is the single hardest data point for the optimistic framing of climate finance to accommodate.
Why Adaptation Doesn't Attract Private Capital
The shortfall is not primarily a failure of will. Adaptation has a structural problem that mitigation does not, and it is worth stating plainly because it explains why the gap persists despite genuine effort.
Mitigation projects generally produce revenue. A solar farm sells electricity, and an investor can be repaid from that cash flow. The financial logic is ordinary and the instruments are conventional.
Adaptation projects mostly produce avoided losses. A sea wall, a drainage upgrade or a drought-resistant crop programme prevents damage rather than generating income — and avoided losses are difficult to capture as a return. Nobody pays the sea wall's owner for the flood that did not happen.
This pushes adaptation toward public finance almost by default, which is exactly where budgets are most constrained. It also explains the composition of the instruments that have succeeded: catastrophe bonds work because they transfer a priced risk, not because they fund a physical defence. The gap is a design problem in how returns are generated, not only a funding shortfall.
Disclosure Made Risk Visible, Not Smaller
The disclosure infrastructure built over the past decade is a real achievement, and its limits are worth being precise about.
Frameworks originating with the Task Force on Climate-related Financial Disclosures, now largely absorbed into standards issued by the International Sustainability Standards Board, established a common vocabulary for reporting climate exposure. Institutions that once had no view of their aggregate exposure now measure and publish it.
That matters. Risk that is not measured cannot be priced, and unpriced risk accumulates without anyone noticing. Disclosure is the precondition for everything else in this piece.
But disclosure is a mirror, not a lever. Reporting $1.6 trillion in fossil credit exposure does not reduce it, and the assumption that transparency alone would redirect capital has proved optimistic. Investors can now see the exposure clearly; they have not, on the evidence of the totals, moved away from it at the pace that assumption implied.
What Would Actually Signal a Pivot
Because this field generates a large volume of projections, it is worth identifying markers that would be observable rather than forecast.
The clearest is the adaptation finance line reversing direction. It fell from $28 billion to $26 billion; sustained growth toward even a third of the $310 billion need would represent a change in kind rather than degree.
A second is fossil credit exposure at the largest banks declining in absolute terms rather than as a share of a growing book. The $1.6 trillion figure provides a baseline against which future research can be compared directly.
A third is whether instruments emerge that finance adaptation against something other than public budgets — resilience-linked debt with measurable triggers, or structures that capture a portion of avoided losses. Their absence, more than any headline projection, is what the current data actually shows.
Until then the accurate summary is narrower than the usual framing: climate risk has been successfully measured, disclosed and in specific cases transferred. Financing the response to it, particularly in the countries most exposed, remains substantially unsolved.
Conclusion
Climate risk financialization has done what it set out to do in one respect. Risk is measured, disclosed and in specific markets traded — 59 sovereigns have raised $695 billion, the catastrophe bond market hit a record $61.3 billion outstanding after $25.6 billion of 2025 issuance, and compliance carbon markets traded roughly $1.5 trillion in value in 2024.
The counterweight is that the world's 60 largest banks still hold more than $1.6 trillion in fossil-fuel credit exposure — more than the entire cumulative sovereign labeled bond market. Both figures are real, and reporting only the first gives a misleading picture of where capital sits.
The decisive number is adaptation. International public adaptation finance to developing countries was $26 billion in 2023, down from $28 billion, against needs of $310-365 billion a year by 2035 — a gap of twelve to fourteen times, in a report UNEP titled 'Running on Empty'.
That shortfall has a structural cause worth understanding rather than lamenting: adaptation produces avoided losses rather than revenue, and avoided losses are hard to sell to an investor. Until an instrument solves that, the pivot describes the pricing of climate risk far better than it describes the financing of any response to it.
Data Source and Attribution
UNEP Adaptation Gap Report 2025Climate Bonds InitiativeArtemisBankTrack / Finance Watch
Adaptation finance figures ($26B delivered in 2023, down from $28B in 2022; $310-365B annual need by 2035; the 12-14x gap) come from the UNEP Adaptation Gap Report 2025, published October 2025. Sovereign labeled sustainable bond totals (59 sovereigns, $695B cumulative) and cumulative GSS+ volumes ($8.1T, of which $6.8T aligned) come from Climate Bonds Initiative. Catastrophe bond figures ($61.3B outstanding at year-end 2025, $25.6B issuance, 122 transactions, 24% growth) come from Artemis. The $1.6 trillion fossil-fuel credit exposure across the 60 largest banks comes from Finance Watch research published September 2025 via BankTrack. Compliance carbon market traded value (~$1.5T in 2024, ~15.7 Gt CO2e) is as reported by Refinitiv; voluntary carbon market estimates vary between published sources and the range is presented as such.
FactsFigs reviews, cleans, and cross-checks every source dataset before shaping it into a data story. Each visualization is created and designed in FactsFigs Design Studio — an internal tool developed and owned by FactsFigs — and is the original work of a FactsFigs author, not an AI-generated copy of any existing graphic. Individual assets within a visual may or may not be produced with AI tools, but the design of the visual itself is solely FactsFigs' own.
Figures combine different measures — cumulative issuance, outstanding market size, annual flows and credit exposure — which are labeled individually and are not directly additive. This article is informational and is not investment advice.
2026-07-20
Weekly Updates
Subscribe for the FactsFigs Weekly Brief
Signals, charts, and data stories delivered every week.
More Intelligence
Other Popular Topics
Additional signals from the FactsFigs intelligence feed.

The Truth Broker: What AI Assurance Actually Sells
AI Investment by Country: America Took 83% in 2025