Behind the charts
Every chart on this site is made with our own system
FactsFigs isn't published on WordPress or a chart embed service. It runs on a publishing system we built ourselves, because nothing available did the whole job: make the chart, write the piece, and publish it as one thing.
We're considering opening it to other people. If that sounds useful, leave your email and we'll tell you when there's something to try — no newsletter, no marketing sequence.
53 chart types
Bar, line, scatter, treemap, sankey, chord, sunburst, choropleth, force-directed and forty-odd more — each with its own editor, not a generic config form.
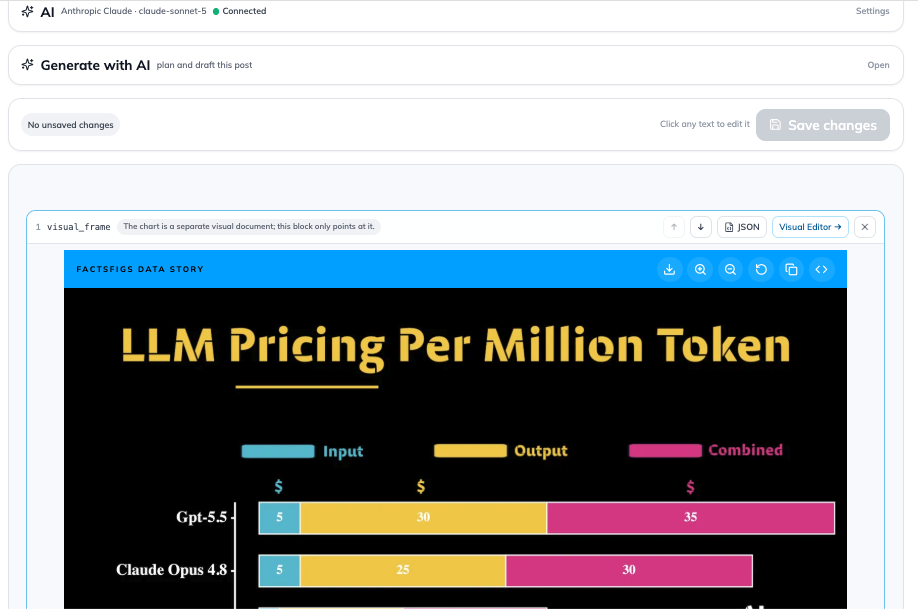
Charts and article in one place
Most chart tools hand you an embed to paste somewhere else. Here the chart, the writing, the layout and the SEO are the same document.
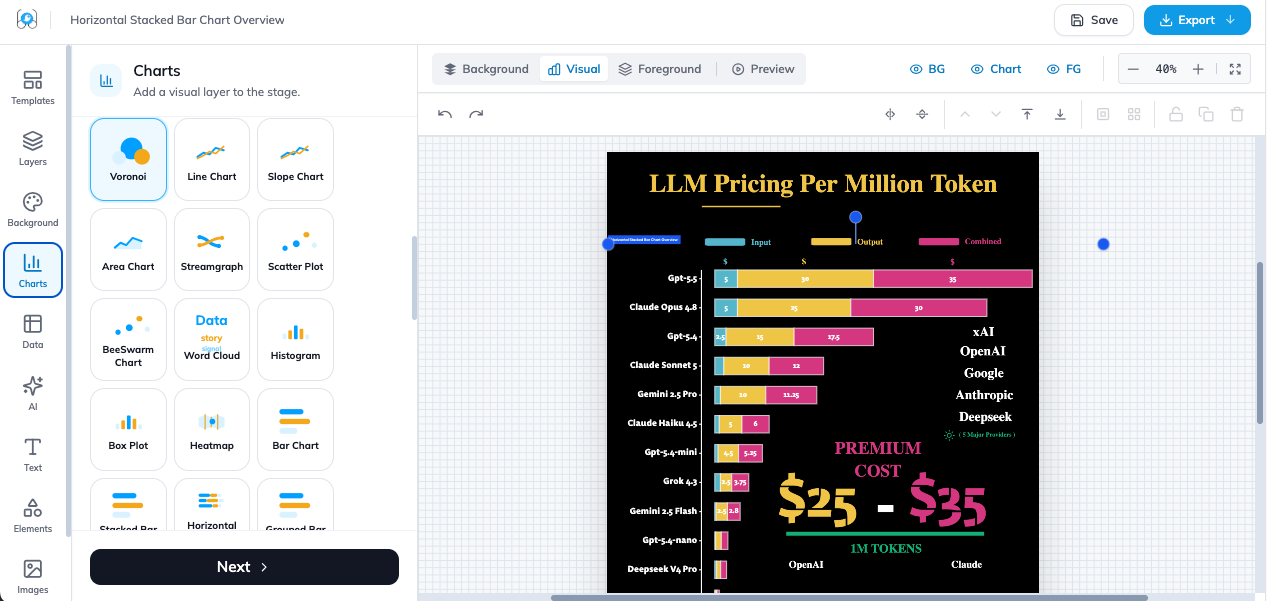
A visual editor
Position, colour, scales, annotations and labels are edited on the chart itself, then saved with the post.
Built for data stories
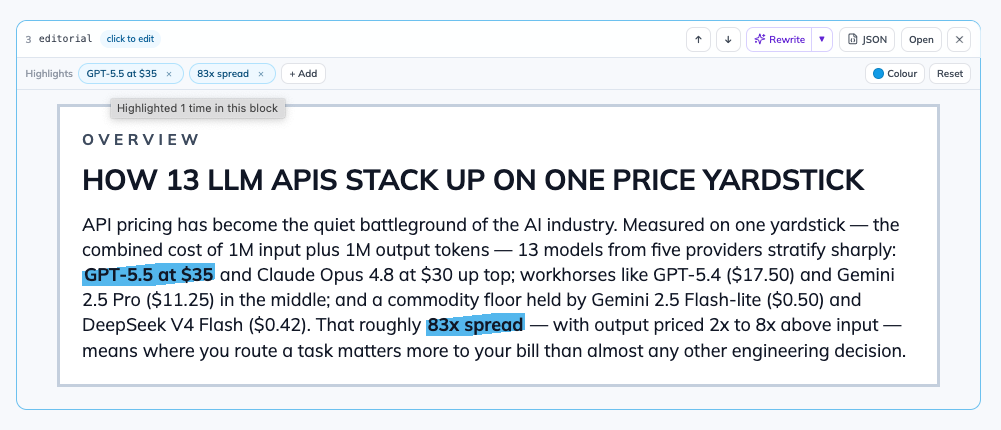
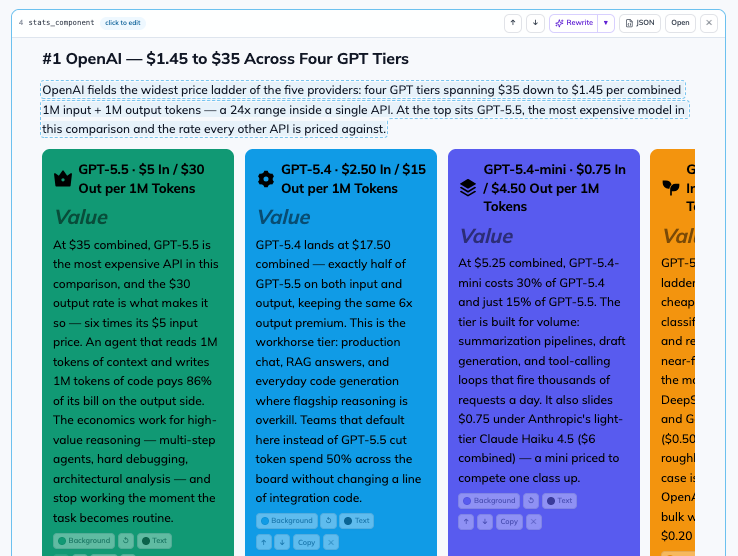
Nineteen content blocks made for this kind of writing: comparison tables, key takeaways, timelines, stat rows, source attribution.
What it looks like
These are the screens the articles on this site are made in.
Register interest
One email when there's something to try. That's the whole commitment.
Want to see what it produces? Every article on the projects page was written and charted with it.