TL;DR — Who Actually Produces the World's AI Innovation?
High-income economies lead four measures out of five, and lose the fifth badly
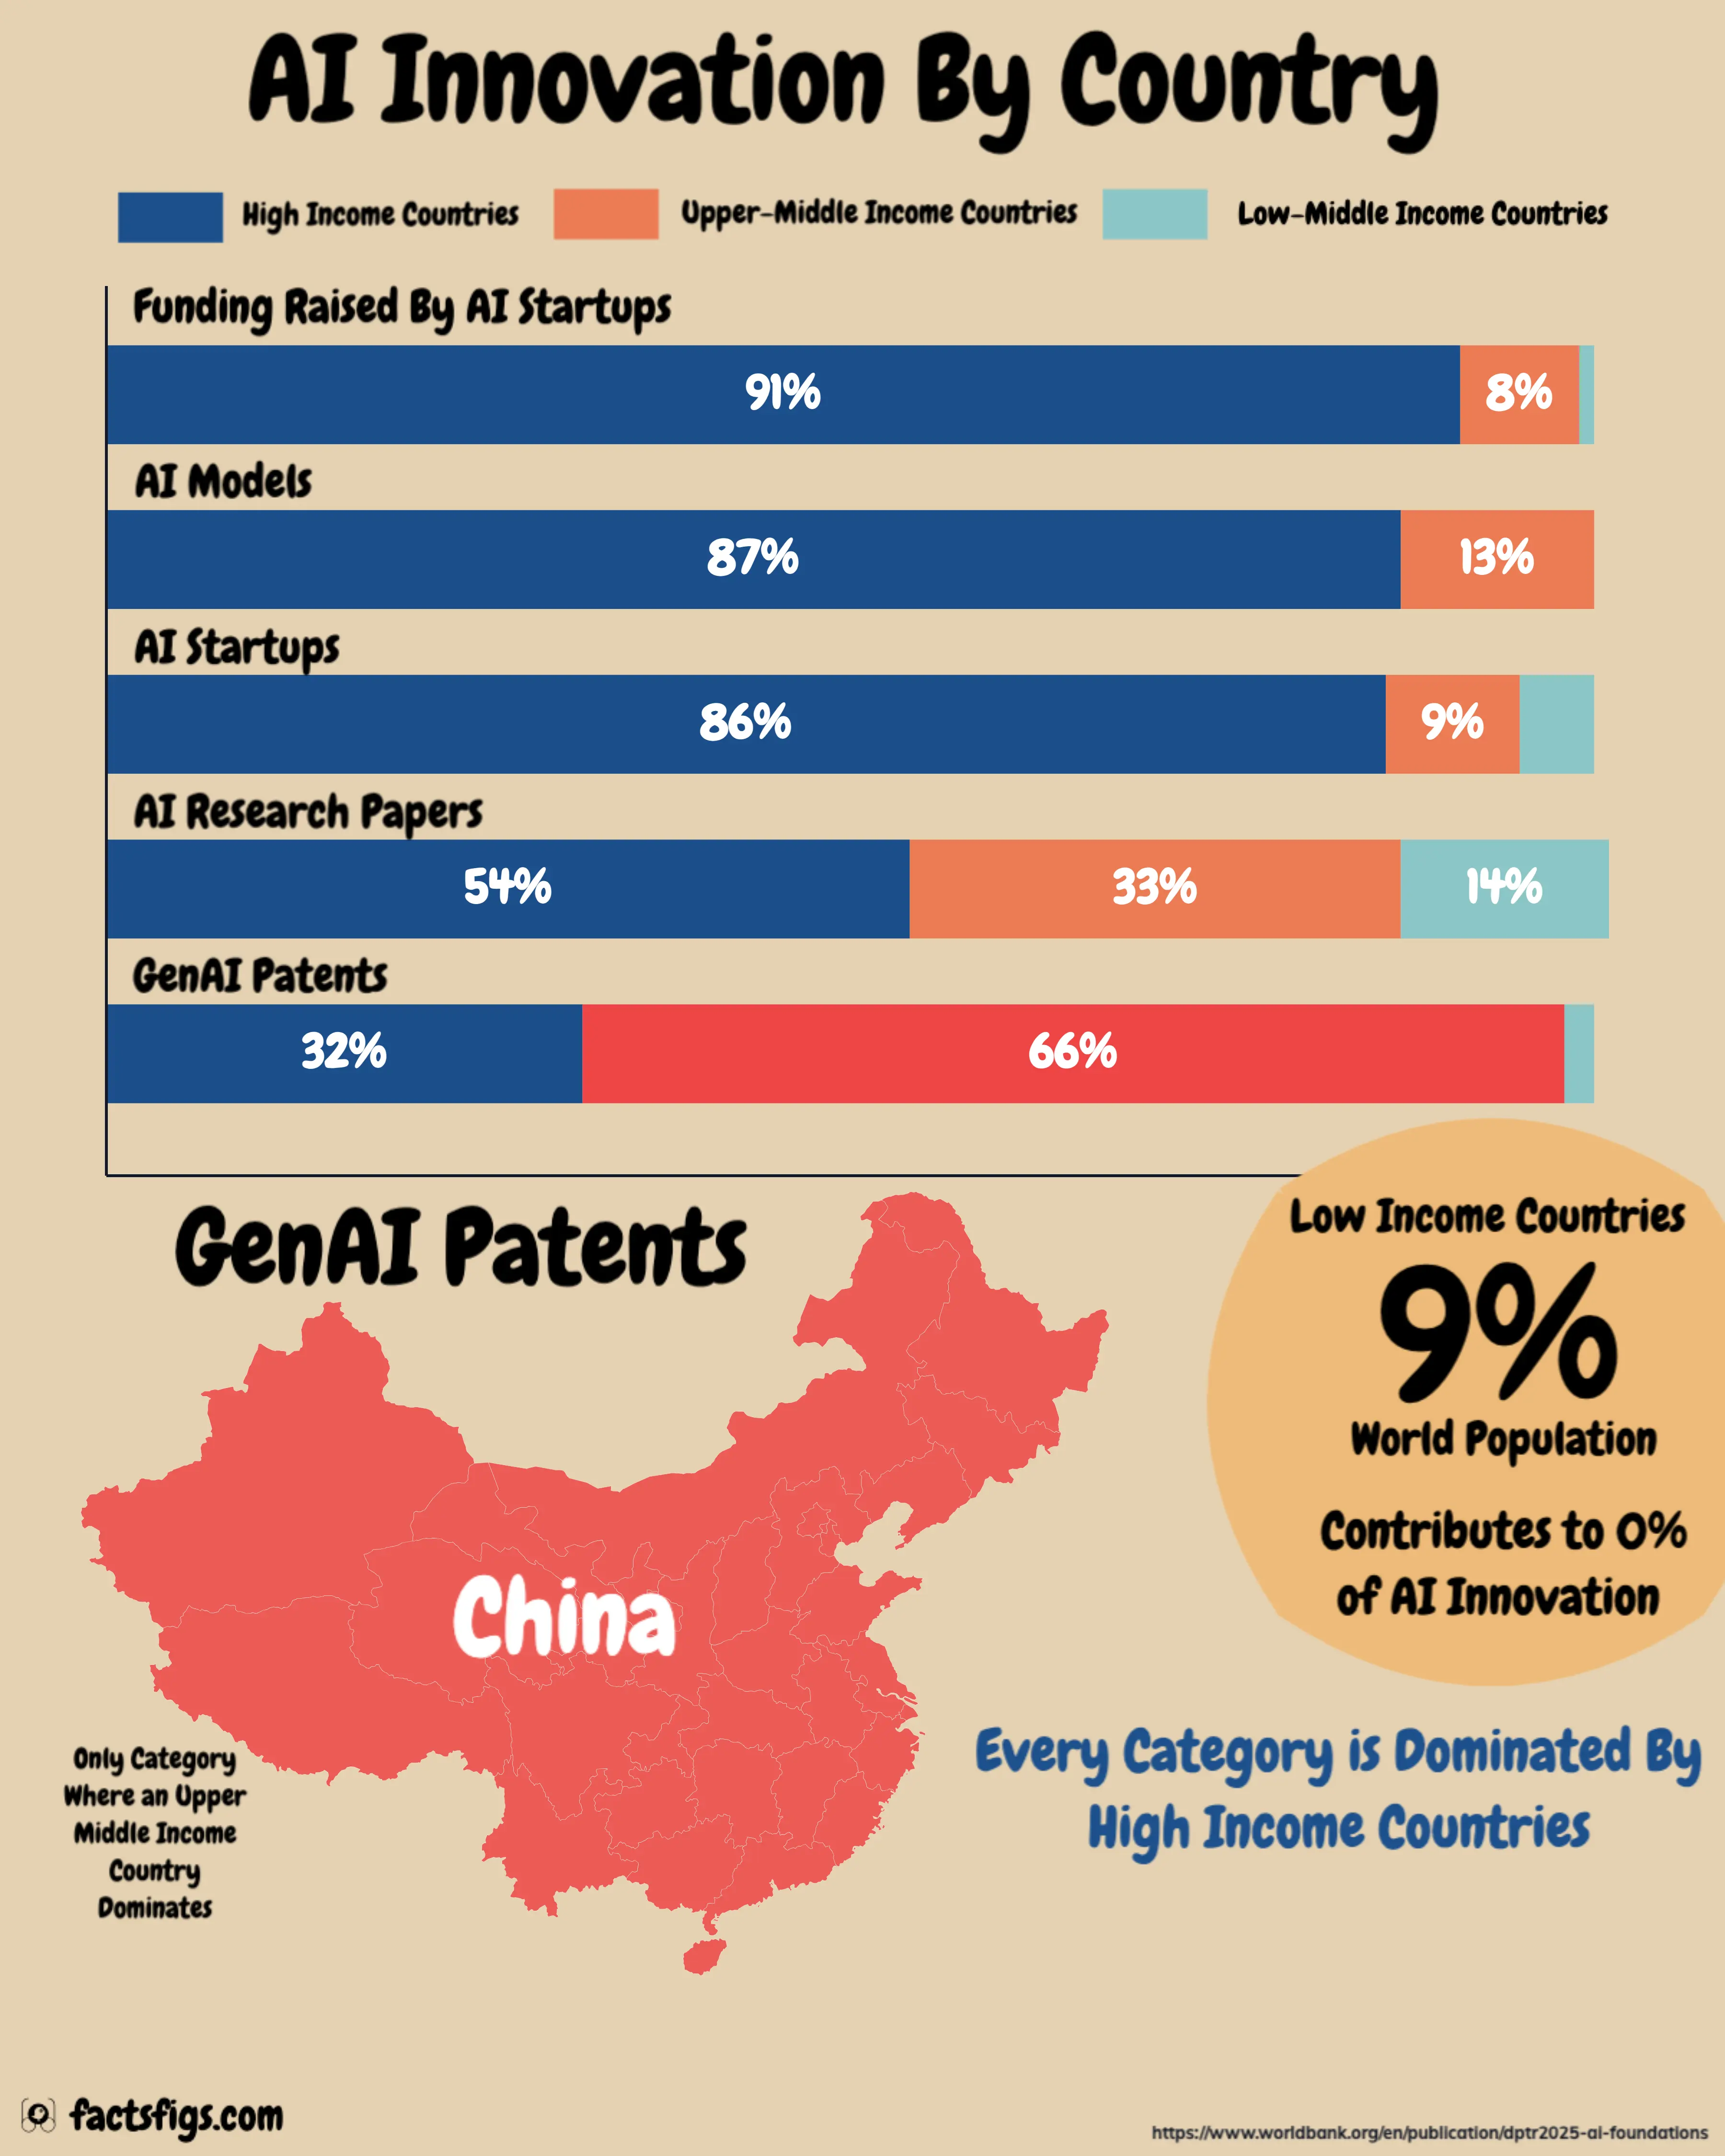
Across five measures compiled by the World Bank, high-income economies take 91% of AI startup funding, 87% of notable AI models and 86% of the world's AI startups — while holding 17% of the world's population and 64% of its GDP.
The lead thins on published research, where high-income economies account for 54% of AI papers and upper-middle-income economies for 33%. It reverses outright on generative-AI patents: 66% to upper-middle-income economies against 32% to high-income ones.
That reversal has a single author. The World Bank's own text puts China at 66% of global GenAI patent filings for 2014–23, and the World Bank classifies China as upper-middle-income. The row is not a middle-income surge; it is one country.
! What the Five Measures Show:
•
Money Is the Most Concentrated Measure:US-based AI startups alone had raised more than $500 billion in venture funding by July 2025 — 73% of the global total. Other high-income economies added 18%, China 8%, and every remaining middle- and low-income economy combined under 2%.
•
Research Is the Most Evenly Spread:Low- and middle-income economies produced 46% of global AI scientific publications over 2000–24, but received only 31% of the citations. China accounts for 70% of the upper-middle-income output and India for 68% of the lower-middle-income share.
•
Patents Are the Only Reversal:Upper-middle-income economies take 66% of generative-AI patents filed from 2014 to 2023, more than double the 32% held by high-income economies. No low-income economy filed an AI patent application anywhere in that decade.
? The Figures Behind the Five Bars:
•
Widest gap:91% of AI startup funding, against 1% for low-middle income
•
Narrowest gap:54% of AI research papers — the only high-income share under 60%
•
The reversal:66% of GenAI patents to upper-middle-income economies
•
The denominator:Low-middle-income economies hold 38% of the world's people
Four of these five measures describe who funds and builds AI; the fifth describes who files paperwork on it. Read together they say the distance between having people and having an AI industry is still measured in orders of magnitude — and that a single upper-middle-income country is the only thing standing between this chart and a clean sweep.
Continue reading below for the full detailed article →
Overview
Why One Country Decides How This Chart Looks
The World Bank sorts economies into four tiers by gross national income per head, and on four of these five AI measures the top tier takes between 54% and 91% of everything. That is the story most readers expect. The fifth measure breaks it: 66% of generative-AI patents filed between 2014 and 2023 came from upper-middle-income economies, against 32% from high-income ones. The group that wins that row contains China, which the World Bank's own analysis credits with 66% of global GenAI patent filings over exactly that decade. One country, one row, one reversal — and nothing else in the data moves.
The Three Numbers That Frame the AI Divide
One number belongs to each income group. The first is the high-income share of every dollar raised by an AI startup, the second is the upper-middle-income share of a decade of generative-AI patents, and the third is what lower-middle-income economies manage on company counts while holding well over a third of the world's people.
91% of AI Startup Funding Goes to High Income
91%
Venture money raised by AI startups as of July 2025 splits 91% to high-income economies, 8% to upper-middle-income and about 1% to lower-middle-income. US-based startups alone account for 73% of the global total, having raised more than $500 billion between them by that date — the single most concentrated measure in the set.
66% of GenAI Patents Are Upper-Middle Income
66%
Generative-AI patents filed between 2014 and 2023 are the only measure here on which high-income economies lose. Upper-middle-income economies take 66% against their 32%, a margin of more than two to one. The World Bank attributes that entire 66% to China, which its own classifications place in the upper-middle-income group.
5% of AI Startups, 38% of the World's People
5%
Lower-middle-income economies are home to 38% of the world's population and 5% of its AI startups, a gap of roughly seven and a half times. On the other rows they take 14% of AI research papers, about 2% of generative-AI patents, around 1% of startup funding, and no measurable share of notable AI models at all.
AI Startup Funding by the Numbers
High income 91 %73% of it is the United States alone.
Upper-middle income 8 %China accounts for the whole of this segment.
Low-middle income 1 %Derived by subtraction; the source draws it but does not label it.
Measure 1 · Capital
#1 Funding Raised by AI Startups — 91% to High Income
Money is the most lopsided measure in the set. As of July 2025, high-income economies accounted for 91% of all venture capital raised by AI startups, upper-middle-income economies 8%, and lower-middle-income economies roughly 1%. Within that 91%, the United States alone holds 73% of the global total — its AI startups had raised more than $500 billion between them — leaving every other high-income economy to share the remaining 18%.
China is effectively the whole of the upper-middle-income 8%. Everything beneath it is a rounding exercise: the World Bank puts all other middle-income economies and every low-income economy together at under 2% of global AI venture funding, which is where the 1% on the lower-middle-income segment comes from.
Measured against output rather than population it still looks steep. High-income economies produce 64% of world GDP and attract 91% of AI venture capital, so the money is concentrating faster than the economies behind it. Funding is also the most forward-looking row here: it is a bet on what will exist in five years, not a record of what exists now.
Measure 2 · Frontier Models
#2 Notable AI Models — 87% From High-Income Teams
The catalogue behind this row runs back to the 1950s and contains more than 900 notable AI models. High-income economies supplied 87% of them, upper-middle-income economies 13%, and lower-middle-income economies no measurable share. The United States alone accounts for 62% of lead contributors, other high-income economies for 25%, and China for the entire 13%.
That zero is worth reading precisely. India contributed two models and Argentina one — 0.2% and 0.1% of the total, which rounds to nothing on a chart drawn in whole percentage points. It means almost none, not none, and the difference matters when the number is being used to argue about capability.
Who builds these models has also changed. Before 2022, 51% of lead contributors came from academia against 47% from industry. Since 2022 that has flipped hard: close to 80% of notable models are now led by industry and only 20% by universities. A measure that once tracked where the research faculties were now tracks where the compute budgets are, which is a large part of why the high-income share is so durable.
Measure 3 · Company Formation
#3 Number of AI Startups — 86% Sit in High Income
Counting companies rather than capital narrows the gap only slightly. Of roughly 21,000 AI startups compiled by CB Insights as of July 2025, high-income economies host 86%, upper-middle-income economies 9%, and lower-middle-income economies 5%. The United States holds 45% of them and other high-income economies 40%, with the United Kingdom second worldwide on 6.8% — 1,456 companies.
China ranks third at about 6%, or 1,352 companies, and India fourth at around 4%. Between them those two account for most of what the middle tiers register at all, which is why the World Bank's own summary of this row is blunt: most low- and middle-income economies have few AI startups of any kind.
The distance between this row and the funding row is the interesting part. Lower-middle-income economies hold 5% of the companies and about 1% of the money. Founding an AI company is roughly five times more evenly distributed than financing one — a startup needs an idea and a registration, while a nine-figure round needs an investor willing to underwrite it from another continent.
Measure 4 · Published Research
#4 AI Research Papers — the Narrowest Lead, at 54%
Research is where the concentration finally loosens. Across 2000–24, high-income economies produced 54% of the world's AI scientific publications, upper-middle-income economies 33% and lower-middle-income economies 14%. Those three add to 101%: the source rounds each segment to a whole number, and this is the row where the rounding shows.
The lead is thinner in volume than it is in influence. Low- and middle-income economies together produced 46% of global AI publications but received only 31% of global citations. The United States accounts for just 26% of high-income academic articles yet 35% of all citations — a modest share of the papers and a commanding share of the attention they get.
This row is also not a story about the poorest countries. China produces 70% of the upper-middle-income total and India 68% of the lower-middle-income one, which works out at roughly 23% and 9% of world AI research respectively. Take those two out and every other middle-income economy on Earth shares about 14% of the world's AI papers between them.
Measure 5 · The Reversal
#5 GenAI Patents — 32%, and the One Row That Flips
Generative-AI patents filed between 2014 and 2023 are the single measure on which high-income economies lose, and they lose by more than two to one: 32% against 66% for upper-middle-income economies, with about 2% for lower-middle-income ones.
The 66% has one owner. The World Bank's own text states that China accounts for 66 percent of global GenAI patent filings during 2014–23, citing WIPO — so the upper-middle-income bar and China are the same number, and the other roughly fifty upper-middle-income economies contribute almost nothing to it. WIPO's own count puts China-based inventors at 38,210 of about 54,000 GenAI patent families over that decade, with Tencent, Ping An Insurance and Baidu the three largest applicants in the world.
Everyone else is small. WIPO records 6,276 families from the United States, 4,155 from the Republic of Korea, 3,409 from Japan and 1,350 from India, while Germany and the United Kingdom together account for under 3% of all generative-AI patent families. No low-income economy filed a single AI patent application anywhere in the entire decade.
A patent count is not a capability count. Filing is cheap relative to training a frontier model, filing strategy varies enormously between jurisdictions and between companies, and a patent family records what an organisation wanted to protect rather than what it shipped. This row belongs on the chart because it is real. It does not belong in a sentence claiming any one country leads AI overall, because the other four rows say the opposite.
The Row That Isn't There
Low-income economies register no measurable share on any of these five measures. They appear once in the source chart — at 9% of the world's population.
The Method
What Counting by Lead Contributor Hides
The five bars are not one snapshot. Notable AI models run from 1950 to June 2025, research papers from 2000 to 2024, generative-AI patents from 2014 to 2023, and both startup measures are counts as of July 2025. A model built in 1997 and a patent filed in 2023 sit in the same picture — which is fine for describing a distribution and misleading for describing a moment.
The attribution rule matters more than it sounds. The World Bank's note on the figure states that where a model has multiple contributors, only the nationality of the first or leading contributor is counted. Modern AI research is heavily co-authored across borders, so a model with a lead author in California and half its team elsewhere registers entirely as high income.
Two of the fifteen segments are also not published numbers. The 1% on lower-middle-income funding and the 2% on lower-middle-income patents are drawn in the source chart but never labelled; both were obtained by subtracting the labelled segments from 100.
Both survive a check without being confirmed by one. The World Bank's text puts all other middle-income and low-income economies together at under 2% of AI venture funding, and WIPO's India count — 1,350 generative-AI patent families out of roughly 54,000 — works out at about 2.5%. Close to the derived figures, but not the same thing as a number the publication printed.
Since the Snapshot
How Far the Patent Gap Has Moved Since 2023
The patent row stops at 2023, and the two years after it were the largest in the field's history. WIPO reported in July 2026 that more than 56,000 new generative-AI patent families were published in 2024 and 2025 combined — more than the entire decade the chart covers — and that China-based inventors accounted for over 43,000 of them.
That is a wider margin, not a narrower one. Six of the world's top ten generative-AI patent applicants are now based in China. Japan climbed from fourth place to third on a 210% compound annual growth rate, with SoftBank the single largest applicant worldwide, while United States filings grew at 92% a year. The economies moving fastest are the ones already inside the top five.
None of that touches the other four rows, which is the point. Patent volume has accelerated almost everywhere without shifting who raises the money or who ships the frontier models. If anything, the chart's one reversal is becoming more of an outlier rather than the beginning of a pattern.
The Full Data Table
All Five Measures, Ranked by High-Income Share
Each measure's share of the global total across three World Bank income groups, ordered by high-income share. Coverage periods differ by row and are given in the final column. Low-income economies register no measurable share on any of the five, so they have no column here.
Funding raised by AI startups
91%
8%
1%*
As of July 2025
Notable AI models
87%
13%
0%
1950 – June 2025
Number of AI startups
86%
9%
5%
As of July 2025
AI research papers
54%
33%
14%
2000 – 2024
GenAI patents
32%
66%
2%*
2014 – 2023
*Derived by subtraction: the source chart draws these segments but does not label them. The AI research papers row sums to 101% because the source rounds each segment to a whole number. For scale, the same publication puts high-income economies at 64% of world GDP and 17% of world population, upper-middle income at 29% and 35%, and low-middle income at 7% and 38%.
The Verdict
What a Split This Wide Actually Decides
Strip the five measures back and the pattern is simple. High-income economies, holding 17% of the world's people, take 91% of the money, 87% of the frontier models and 86% of the companies. Their weakest row is research at 54%, and their only loss is a patent count that one upper-middle-income country wins single-handed.
The consequence is not that developing economies cannot use AI — they already do, at scale. It is that the tools they use are specified somewhere else. A model whose lead contributor sat in a high-income economy learns from that economy's data, languages and assumptions, and 87% of notable models were led from there. Adapting a system is a weaker position than designing one, and this chart is a picture of who gets to do which.
The row that reverses is instructive precisely because it is so narrow. It took a decade of coordinated state support, a very large domestic market and one specific measure — filings, not products — for a single upper-middle-income economy to beat the top tier at anything here. That is the scale of effort required to move one bar, and four bars have not moved at all.
The data behind this story comes from the World Bank's Digital Progress and Trends Report 2025: Strengthening AI Foundations, figure 1.2 on page 12, "AI innovation and adaptation activities, by country income group". The World Bank built that figure from Epoch, OECD.AI and WIPO indicators, with start-up counts drawn from CB Insights; the report is published under a Creative Commons Attribution 3.0 IGO licence, and full credit for collecting and maintaining the underlying data goes to those organisations. Patent family counts come from WIPO's Patent Landscape Report on Generative AI and its July 2026 update.
FactsFigs reviews, cleans, and cross-checks every source dataset before shaping it into a data story. Each visualization is created and designed in FactsFigs Design Studio — an internal tool developed and owned by FactsFigs — and is the original work of a FactsFigs author, not an AI-generated copy of any existing graphic. Individual assets within a visual may or may not be produced with AI tools, but the design of the visual itself is solely FactsFigs' own.
Figures are estimates at the time of publication, provided for information only — nothing here is financial advice or a guarantee of accuracy.
Last verified: 21 Sept 2026
The charts in this article were built with our own publishing system. See what it does →