Data Source and Attribution
Nintendo investor relations: Top Selling Title Sales Units
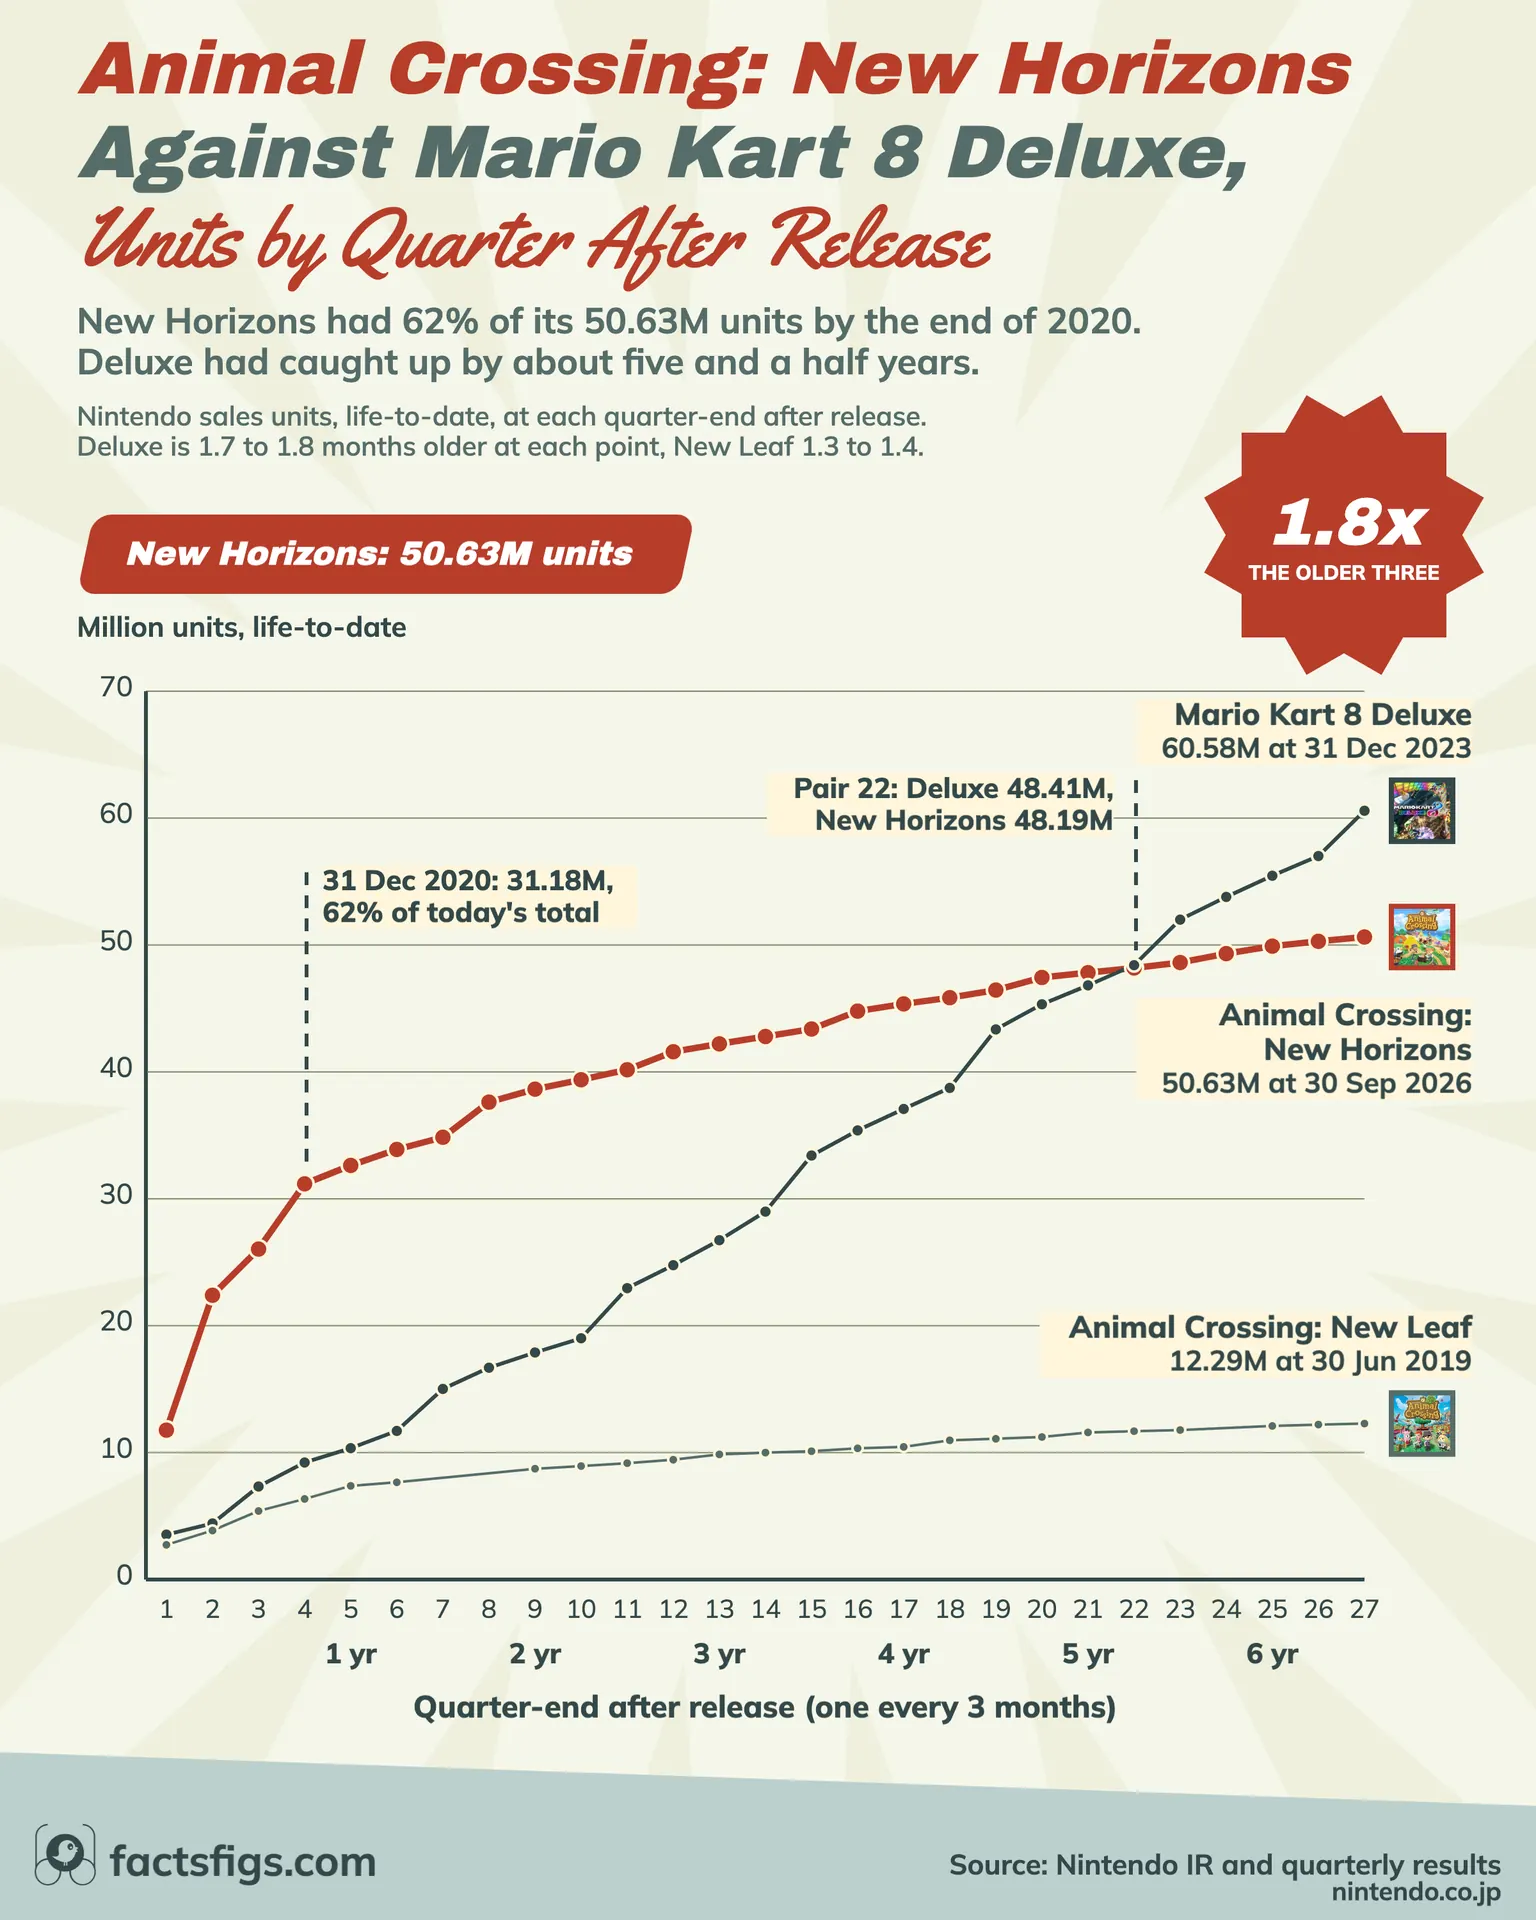
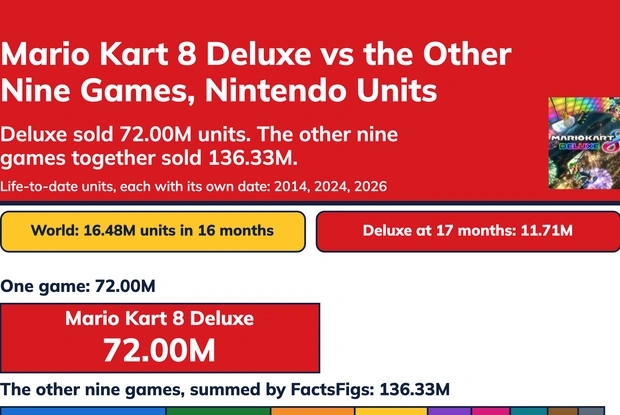
The data in this story was manually collected by FactsFigs from Nintendo's own pages and documents. Figures come from the Nintendo investor-relations Top Selling Title Sales Units pages for Switch and 3DS (as of 30 September 2026 and 31 March 2026), the legacy DS page (as of 30 September 2016) and Nintendo's supplementary information of May 2009 for City Folk. The pace series, 31 March 2020 to 30 September 2026, comes from archived copies of Nintendo's Switch and 3DS investor pages and Nintendo's quarterly results, and the Switch 2 Edition counting rules from Nintendo's results. Nintendo's units are worldwide consolidated sales units, including downloads and bundled copies and excluding upgrade packs, and "sold" in the headings is search wording for them. Every figure is Nintendo's, and no estimate sites or sales trackers were used. Figures read on 20 November 2026.
Our own arithmetic covers the 28.20 million sum of the three older games, the 1.80 times and 64.2% ceilings, the other ratios, the differences between Nintendo's cumulative figures, the 62% and other shares of the total and the pace pairings by age.
Cover artwork in the chart is from Wikipedia and remains the property of Nintendo, except Mario Kart 8 Deluxe, which uses Nintendo's own store artwork.
FactsFigs reviews, cleans and cross-checks every source dataset before shaping it into a data story. Each visualization is created and designed in FactsFigs Design Studio - an internal tool developed and owned by FactsFigs - and is the original work of a FactsFigs author, not an AI-generated copy of any existing graphic. Individual assets within a visual may or may not be produced with AI tools, but the design of the visual itself is solely FactsFigs' own.
Figures are estimates at the time of publication, provided for information only - nothing here is financial advice or a guarantee of accuracy.
Last verified: 20 Nov 2026