Australia mines the most. Chile holds the most. They are not the same country.
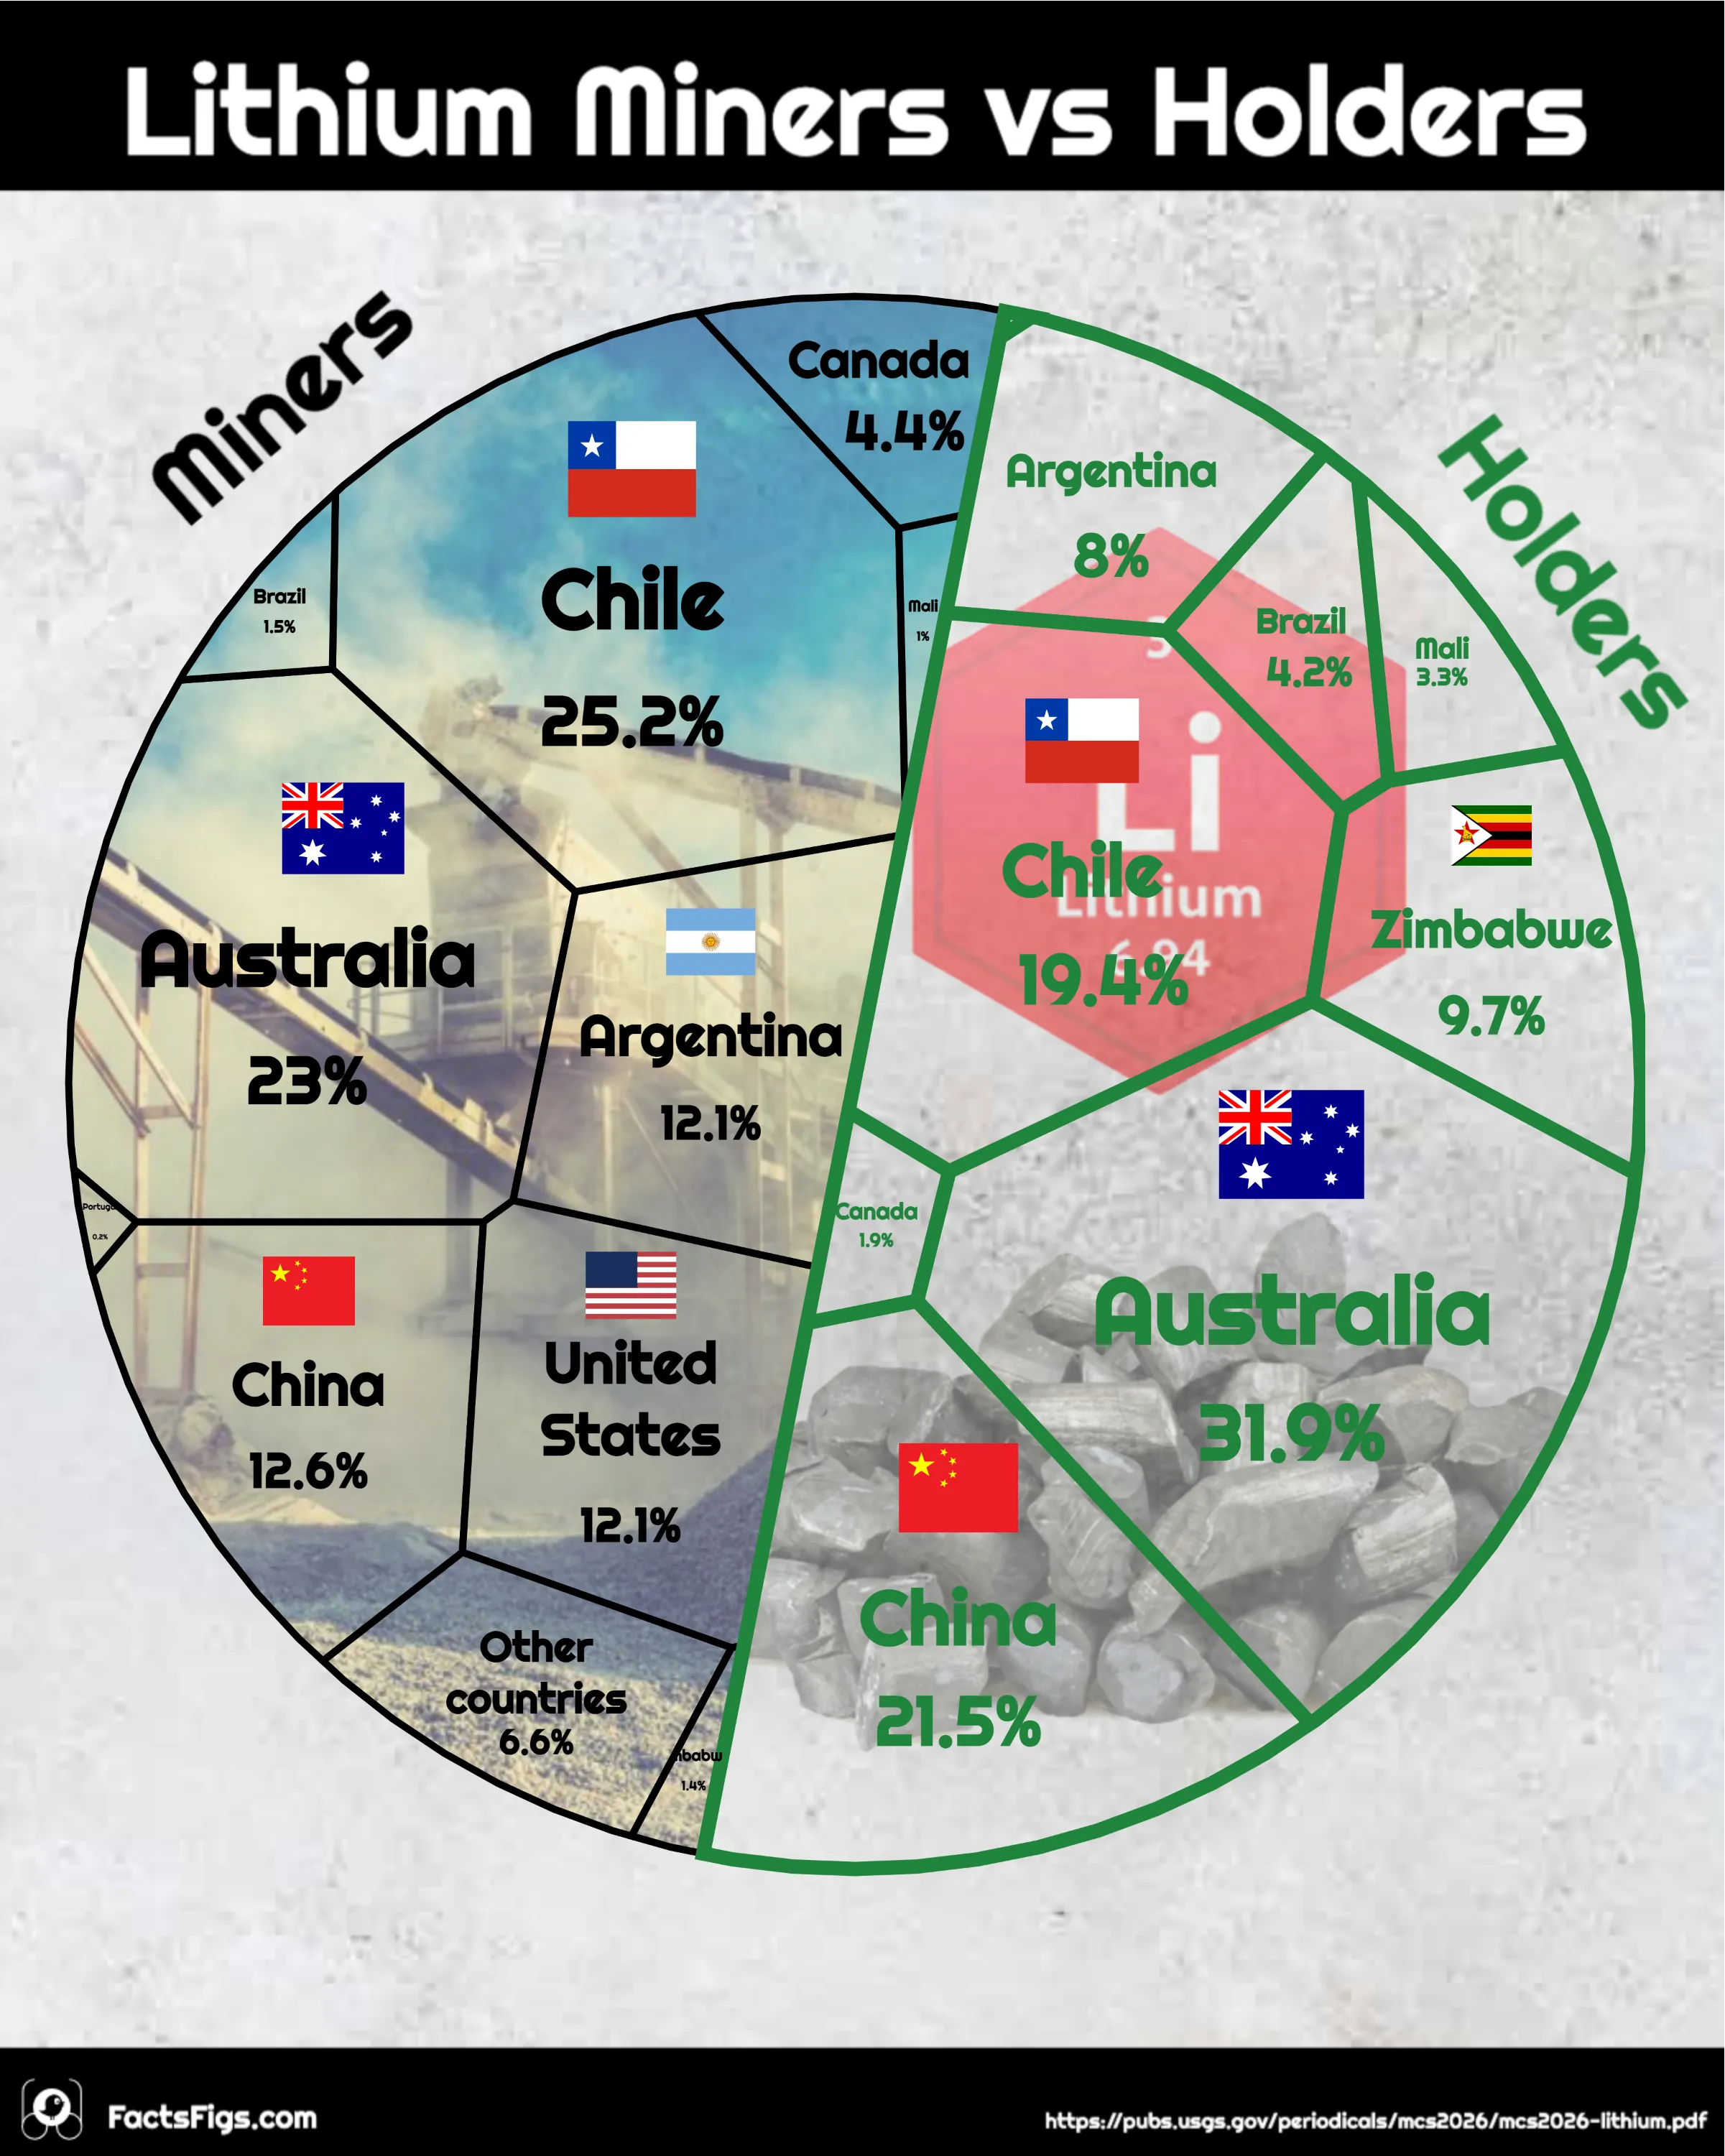
Australia mined 92,000 tonnes of lithium in 2025, roughly a third of world output, from reserves of 8.4 million tonnes. Chile mined 56,000 tonnes — under a fifth of world output — from 9.2 million tonnes, the largest reserve holding of any country.
The gap runs through the whole table. Zimbabwe holds 1.4% of the world's reserves and produced 9.7% of its lithium. The United States holds an eighth of world reserves and reports no production figure at all.
The two rankings measure different things: one is what a country has, the other is what it has built the capacity to extract.
! What the Two Rankings Show:
•
The Top Two Swap Places:Chile holds 25.2% of world reserves against Australia's 23.0%, but Australia mined 31.9% of world output in 2025 against Chile's 19.4%. Whichever ranking you publish, the other one contradicts it.
•
Zimbabwe Mines Seven Times Its Weight:Zimbabwe holds 500,000 tonnes, about 1.4% of world reserves, and produced 28,000 tonnes in 2025 — 9.7% of world output. Five mineral operations account for it, and Mali made a similar jump, from 770 tonnes in 2024 to 9,400 in 2025.
•
China Mines Above Its Reserves and Refines Everyone Else's:China holds 12.6% of reserves and mined 21.5% of world output, overtaking Chile during 2025 to become the second-largest producer. The great majority of Australian spodumene is also refined in China, so its role in the supply chain is larger than either ranking shows.
? The Figures Behind the Split:
•
Biggest holder:Chile — 9,200,000 t, 25.2% of world reserves
•
Biggest miner:Australia — 92,000 t in 2025, 31.9% of world output
•
Widest gap:Zimbabwe — 1.4% of reserves, 9.7% of production
•
Not in the mining ranking:United States — 4,400,000 t held, production withheld
Reserves describe geology and economics; production describes plant, permits and capital already in the ground. A country can lead one ranking for decades without leading the other, which is why 'who has the most lithium' and 'who produces the most lithium' are two questions, not one.
Continue reading below for the full detailed article →
Overview
Why the Lithium League Table Has Two Answers
Search for the world's largest lithium producer and you will find two different countries confidently named. Both answers are right, because they are answers to different questions. Chile sits on 9.2 million tonnes of reserves, more than any other country, and mined 56,000 tonnes of lithium in 2025. Australia holds less — 8.4 million tonnes — and mined 92,000, close to a third of everything produced on Earth that year. The pattern repeats down the table and gets more extreme at the edges: Zimbabwe extracted almost a tenth of world output from little more than a hundredth of world reserves, while the United States holds an eighth of the world's reserves and files no production figure at all. What separates the two rankings is not luck. It is the difference between owning a resource and having built the means to get it out.
The Three Numbers That Split the Rankings
One country leads the mining table, a different one leads the reserves table, and a third mines many times what its reserves would suggest. Those three figures are the whole disagreement between the two halves of the chart, and between the two answers you get when you ask who leads the world in lithium.
31.9% of World Output Mined by Australia
31.9%
Australia produced 92,000 tonnes of lithium in 2025 out of a world total of 290,000, from seven mineral operations. That is close to a third of global supply from a country holding 23.0% of world reserves — the clearest case of a producer outrunning its own share of the ground.
25.2% of World Reserves Held by Chile
25.2%
Chile's 9.2 million tonnes is the largest reserve holding of any country, a quarter of the world total. Its two brine operations mined 56,000 tonnes in 2025, or 19.4% of world output, leaving it first on one ranking and third on the other behind Australia and China.
9.7% of World Output From Zimbabwe's 1.4%
9.7%
Zimbabwe holds 500,000 tonnes of reserves, roughly 1.4% of the world's, and mined 28,000 tonnes in 2025 — almost a tenth of global production from five mineral operations. No country in the table works its reserves harder relative to what it has on the books.
Australia by the Numbers
Australia 31.9 %92,000 t mined in 2025 from seven mineral operations.
China 21.5 %62,000 t, having overtaken Chile during 2025.
Chile 19.4 %56,000 t from two brine operations in the Atacama.
The Disagreement
The Ranking Changes With What You Count
Rank the eleven countries by reserves and Chile leads on 9.2 million tonnes, then Australia on 8.4 million, China on 4.6 million, and Argentina and the United States tied on 4.4 million each. Rank the same countries by what they actually mined in 2025 and the order becomes Australia on 92,000 tonnes, China on 62,000, Chile on 56,000, then Zimbabwe on 28,000 and Argentina on 23,000.
Only one country holds its position across both: nobody. Australia climbs from second to first, China from third to second, Chile falls from first to third, and Zimbabwe leaps from ninth by reserves to fourth by output. The United States, tied fourth on reserves, does not appear in the production ranking at all.
That is not a rounding difference or a quirk of one year. It is the ordinary state of this industry, and it is why the phrase "the world's largest lithium producer" points at Australia while "the country with the most lithium" points at Chile. Both statements are accurate, and neither is a good summary on its own.
Mining Above Their Weight
Zimbabwe and China Punch Past Their Reserves
Zimbabwe is the sharpest case in the table. Five mineral operations produced 28,000 tonnes in 2025 — 9.7% of world output — from a reserve base of 500,000 tonnes, about 1.4% of the world's. Its output rose from 20,000 tonnes the year before, and the 2026 edition lists it among the countries where significant capacity expansions took place despite low prices.
Mali moved faster still in relative terms, from 770 tonnes in 2024 to 9,400 in 2025, on the back of two new operations that opened during 2024. It now mines 3.3% of world lithium from 1.0% of world reserves. Brazil shows the same shape more mildly: 4.2% of output from 1.5% of reserves.
China's version is different in kind. It holds 12.6% of reserves and mined 21.5% of world output across nine mineral and six brine operations, overtaking Chile during 2025 to take second place. But its real position in the supply chain is wider than either ranking captures — the great majority of Australian spodumene is shipped to China for refining into lithium carbonate and hydroxide, so a large share of the ore counted as Australian production becomes a Chinese chemical product before it reaches a battery.
Sitting on the Ground
Chile, Argentina and the US Mine Below Theirs
Chile holds the largest reserves in the world and mines the third-largest quantity. Its 9.2 million tonnes produced 56,000 tonnes in 2025 through two brine operations in the Atacama — 19.4% of world output from 25.2% of world reserves. Argentina shows a wider version of the same gap: 12.1% of reserves, 8.0% of production, from four brine operations.
The United States is the extreme case and the hardest to read. It holds 4.4 million tonnes, an eighth of world reserves, and its production is withheld by the USGS to avoid disclosing company proprietary data — commercial-scale output comes from a single continental brine operation in Nevada. Its net import reliance has run above 50% since 2023, with Chile supplying 54% and Argentina 43% of imports across 2021 to 2024.
Bolivia sits outside the table entirely and is worth naming anyway. It holds 23 million tonnes of identified lithium resources, second only to Argentina's 28 million, and appears nowhere in the reserves column or the production column. Resources are not reserves — the distinction is whether extraction is economic at current prices with current technology — and Bolivia's have not yet crossed that line.
The Mechanism
Holding Lithium and Mining It Are Different Jobs
The two halves of the ranking split along geology. Chile, Argentina and Bolivia hold their lithium in continental brines beneath the salt flats of the Andes — the lithium triangle — where extraction means pumping brine into shallow ponds and letting the sun concentrate it. The International Lithium Association puts that evaporation stage at 12 to 18 months before the brine is ready for processing at all. Australia and Zimbabwe hold theirs in hard rock, mined as spodumene ore and concentrated by conventional crushing and flotation.
Neither route is quick to start. The same body puts development of a new lithium resource, brine or spodumene, at five to ten years. What differs is what happens once a project exists: a hard-rock mine can lift output by running more ore through a plant, while a brine operation is paced by evaporation and by how much pond area has been built. That difference shows up in a year like 2025, when world production jumped 31% and the countries that added the most were the ones with rock to crush.
Refining pulls the map further out of shape. Australia's spodumene concentrate is largely exported to China for conversion, which is why China's 21.5% mining share understates its position. Lithium supply security has become a stated priority for technology companies across Asia, Europe and North America, and the joint ventures forming between them and exploration companies are aimed at exactly this gap between where lithium sits and where it becomes a battery.
The United States has no production figure, so every share in the mining half is calculated on a world total that excludes American output. The reserves half includes the US at 12.1%. The two halves of the chart therefore cover slightly different worlds, and the production shares are all marginally overstated as a result.
Reserves are an economic measure, not a geological one — the portion of a known deposit worth extracting at today's prices with today's technology. That makes a reserve share a moving target in a way a production figure is not. A country can gain ground in the left-hand ranking because a price rose or a company finished drilling, without a single extra tonne leaving the ground, and the mining ranking will not move at all in response.
The Australian figure carries a disclosure worth knowing: the 8.4 million tonnes reported in the reserves table sits alongside a footnote putting Joint Ore Reserves Committee-compliant reserves at 5.1 million. Taking the lower number would make Australia's mining share look more extreme still, not less. And a single year of production is a thin basis for a structural claim — Namibia, for one, was temporarily removed from the production table entirely owing to legal uncertainties.
Reserve Share Against Production Share, by Country
Every figure is lithium content. Share columns give each country's slice of the world total for reserves and for 2025 output, and the gap is the second minus the first — positive where a country digs up more than its holdings would imply. American output is suppressed in the source to protect commercial confidentiality, so it carries no production share and the remaining shares are calculated on a total that leaves it out.
Australia's reserves are reported as 8,400,000 tonnes; the same USGS page notes Joint Ore Reserves Committee-compliant reserves of 5,100,000 tonnes.
The Verdict
So Which Country Leads on Lithium?
Australia, if you mean who digs the most out of the ground: 92,000 tonnes in 2025, close to a third of world output. Chile, if you mean who has the most left to dig: 9.2 million tonnes, a quarter of world reserves. China, if you mean who turns the most of it into something a battery factory can use.
The habit of publishing one number and calling it the lithium ranking hides the part that matters. A reserve is a claim on the future that requires five to ten years and a great deal of capital to become production. A production figure is the record of decisions taken a decade ago. The two rankings are separated by roughly that much time.
Which is why the interesting names in this table are the ones at the extremes. Zimbabwe and Mali are converting small reserve bases into real output now. Chile, Argentina and the United States are sitting on large ones. And Bolivia, holding 23 million tonnes of identified resources and mining none of it, is the clearest reminder that having lithium and supplying lithium have never been the same thing.
The reserve and production figures behind this story come from the United States Geological Survey's Mineral Commodity Summaries 2026, lithium chapter, which is in the public domain as a United States Government work; full credit for compiling and maintaining the series goes to the USGS National Minerals Information Center. Extraction-method context — evaporation times, development timelines and the geography of the lithium triangle — comes from the International Lithium Association's Lithium 101 explainer. All share and gap percentages are calculated by FactsFigs from the USGS figures.
FactsFigs reviews, cleans, and cross-checks every source dataset before shaping it into a data story. Each visualization is created and designed in FactsFigs Design Studio — an internal tool developed and owned by FactsFigs — and is the original work of a FactsFigs author, not an AI-generated copy of any existing graphic. Individual assets within a visual may or may not be produced with AI tools, but the design of the visual itself is solely FactsFigs' own.
Figures are estimates at the time of publication, provided for information only — nothing here is financial advice or a guarantee of accuracy.
Last verified: 08 Sept 2026
The charts in this article were built with our own publishing system. See what it does →