

+22.3 pp
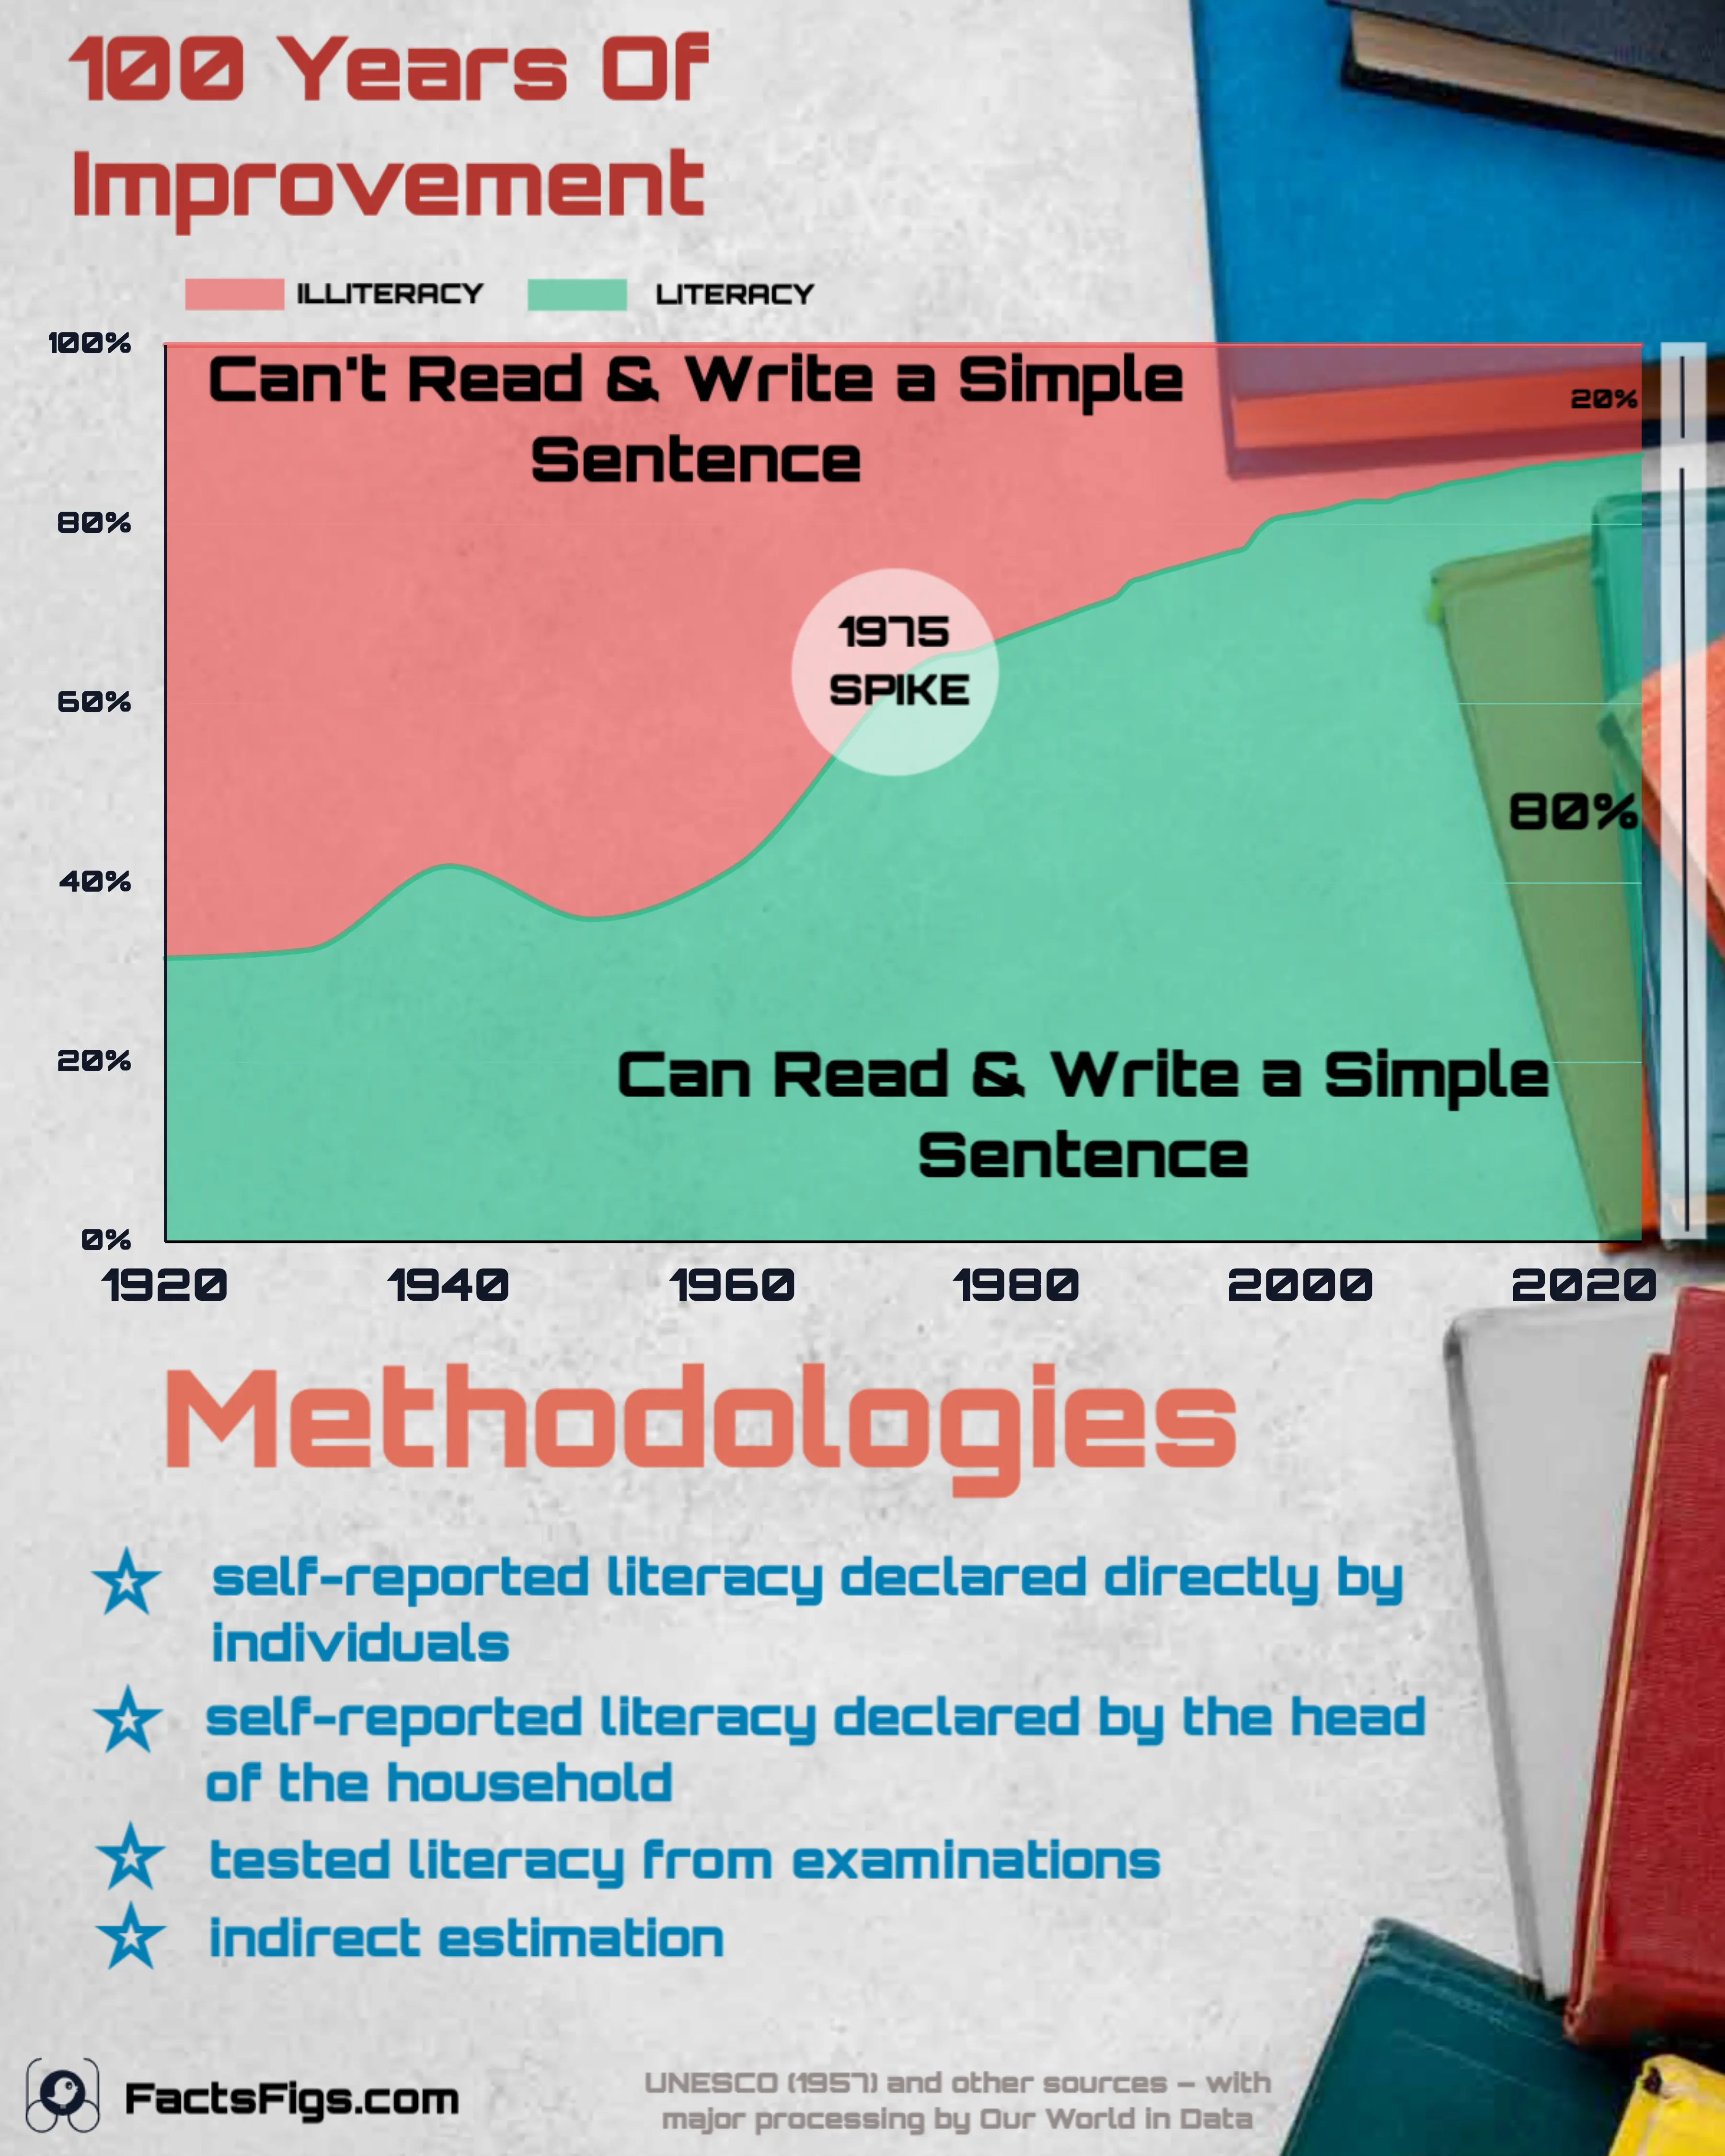
The share of the world's adults counted as literate rose from 65.4% in 1975 to 87.7% in 2024 — a gain of 22.3 percentage points in forty-nine years.

Facts & Figures
Visual Intelligence
What this post found, in about a minute
World adult literacy rose from 31.6% in 1920 to 87.7% in 2024, and from roughly one in ten two centuries ago. But the figure counts anyone who says they can read a simple sentence — most of it is self-reported and never tested — and where testing does happen it finds considerably less skill. This post sets out what “literate” actually means, how the number is collected, what the newer standardised tests found, and why more schooling no longer guarantees more reading.
Mass illiteracy has ended, by the only definition the world can afford to measure everywhere. Whether the people being counted can genuinely read remains largely unknown.
Continue reading below for the full detailed article →
Overview
A literate person, in the definition behind almost every number in this story, is someone who can — in UNESCO's words — with understanding, read and write a short, simple statement on their everyday life. That is a deliberately low bar, and it is the bar the chart above rests on. What varies between countries is not the definition but how they decide who clears it. Some ask people directly, in a single yes-or-no question. Some ask one household head to answer for everyone under the roof, which leaves women and children — the people least often counted as head — described by somebody else. Some infer literacy from schooling alone, and there the threshold moves: Greece counts you literate after six years of primary education, Paraguay after two. Only a minority of countries test anybody. Where tests do exist they disagree with the self-reports: the United States reports near-universal literacy, yet sits at around 275 on the PIAAC proficiency scale, where the countries measured spread across roughly 230 to 300. Literacy is a continuum being recorded as a switch.
1975 is where this series stops being a decade-by-decade reconstruction and starts being reported every year. It is also where the steepest climb begins.
+22.3 pp
The share of the world's adults counted as literate rose from 65.4% in 1975 to 87.7% in 2024 — a gain of 22.3 percentage points in forty-nine years.
Methodology
No single instrument produces the world literacy rate. It is assembled from national figures gathered in four different ways, then stitched to older estimates that were not gathered at all but reconstructed. Which method a country used changes what its number means, and countries have switched methods part-way through their own series — Mexico moves between self-reports and extrapolation.
The most common method. A census or survey asks a single yes-or-no question: can you read and write? Nothing is checked. The answer turns on what the person takes reading to mean — recognising the shape of a familiar word, or drawing one's own name rather than composing a sentence, can both be offered in good faith.
Many surveys ask one person to answer for everyone under the roof. That saves interview time and costs accuracy, and it costs it unevenly: women and children are the least likely to be counted as head of household, so their literacy is the most likely to be described by somebody else.
The only method that measures anything directly. PIAAC tests adults in roughly thirty countries, almost all of them wealthy. LAMP was built to reach developing countries but has only been field-tested in four — Jordan, Mongolia, Palestine and Paraguay. Some household surveys carry a lighter version: DHS asks respondents to read a simple sentence aloud. Where any test exists, it tends to find less skill than the self-reports claim.
Where nobody was asked, literacy is estimated from educational attainment instead. The link is real — in the United States in 1947, 95.3% of people with four years of schooling were counted literate, against 19.9% of those with none — but the threshold is set nationally. Greece requires six years of primary education before it counts you literate; Paraguay requires two.
For the years before censuses recorded literacy at all, historians count the share of people who could sign court records and marriage certificates. That yields a floor rather than a rate, because more people could read than could write. Buringh and van Zanden cross-checked the signatures against estimated book consumption per head and landed close to the same answer, which is much of the reason the long-run picture is trusted at all.
What Changed
The weaknesses of asking people about themselves have been understood for decades, and much of the last twenty years has gone into building the alternative: assessments that put a text in front of a person and score what they actually do with it. Several now exist, run by different organisations, built to different budgets, aimed at different parts of the world.
The most rigorous of them. Instead of a yes or a no, PIAAC places every adult on a 0-to-500 scale cut into six proficiency levels, from below Level 1 up to Level 5, with the boundaries set at 176, 226, 276, 326 and 376 points. Thirty-one countries are taking part in its second cycle; the first results, from fieldwork in 2022 and 2023, were published in December 2024, alongside a new domain for adaptive problem solving. The findings were sobering. Across the preceding decade literacy proficiency was flat or falling in most participating countries, and only two improved significantly — Finland by 15 points and Denmark by 9.
PIAAC demands money and technical capacity that most education budgets do not have, so its reach stops roughly where national wealth does. The World Bank's STEP programme carried skills measurement into a set of middle-income countries, and UNESCO's Institute for Statistics built Mini LAMP, a streamlined and deliberately cheaper version of its earlier LAMP assessment, specifically to reach low- and lower-middle-income countries.
A parallel effort measures reading where it is formed. In 2019 the World Bank and the UNESCO Institute for Statistics launched Learning Poverty — the share of ten-year-olds who cannot read and understand a simple text — and put it at 70% across low- and middle-income countries in 2022, up from 57% before the pandemic. The international household surveys, MICS and DHS, now carry literacy modules of their own, so at least some respondents are asked to read rather than asked whether they can.
The instruments improved faster than any agreement about what they should prove. The United Nations handbook for the indicator meant to enshrine proficiency concedes that no common threshold for a fixed level of proficiency has ever been validated by the international community. Each programme still sets its own bar, which is why a country can look literate on one measure and not on another.
In July 2024 the UNESCO Institute for Statistics proposed dropping the proficiency measure as the world's headline indicator, on the ground that it “has a coverage below 15% and there is no foreseeable increase”. As of 2023 only fifteen countries had any data for it going back to 2015, nearly all of them wealthy. In March 2025 the UN Statistical Commission agreed: proficiency was demoted to a thematic indicator, and the plain literacy rate — the same yes-or-no question, but reported for 143 countries — was promoted in its place. The better instrument exists. It simply cannot reach most of the world, so the number the world reports is still the one people give about themselves.
The Schooling Link
Schooling and literacy move together, and for most of the last century that was the whole story. The world's average adult had less than half a year of formal education in 1870. By 1950 it was three years. By 2020 it was nearly nine. The literacy line in the chart above climbs across the same stretch of time, and the two facts are not a coincidence.
It is visible in the earliest usable records. In the United States in 1947, literacy ran at 95.3% among adults with four years of schooling and 19.9% among those with none — a five-fold gap opened by four years of classroom time. Plot literacy against average years of schooling across countries today and the same slope appears. The relationship is strong enough that statisticians run it backwards, estimating literacy from school records in places where nobody has been asked or tested.
The link only pays where children are actually in class. UNESCO counted 272 million children, adolescents and young people out of school in 2023 — twenty-one million more than its own previous estimate. That population has shrunk by roughly 1% in nearly ten years: it fell by a third between 2000 and 2015, then started climbing again. A third of school-age children in low-income countries are out of school, against 3% in high-income ones.
Here the relationship starts to break. The World Bank's 2018 World Development Report, the first it had ever given over entirely to education, found that 60% of primary school children in developing countries were not reaching basic proficiency in reading, writing and arithmetic. In Malawi nearly 90% of grade-two pupils could not read a single word of a short text. By 2022 the World Bank and UNESCO put the share of ten-year-olds unable to read and understand a simple passage at 70% across low- and middle-income countries. Every one of those children is counted as schooled. Most of them will eventually be counted as literate.
The problem is not confined to poor ones. PISA tested roughly 700,000 fifteen-year-olds across 81 countries and economies in 2022 and found the OECD average in reading down 10 points on 2018 — twice the largest drop ever recorded between two rounds, and worth about half a year of learning. The OECD was explicit that the pandemic is only part of it: reading scores had been sliding before 2018. PIAAC found the same among adults, with literacy proficiency flat or falling in most participating countries across a decade in which those same populations grew steadily more schooled.
By the measure this story charts, yes, and spectacularly: the definition asks whether you can read a simple sentence about your own life, and school delivers that much reliably. By the measure the tests apply, the answer has stopped being obvious. Years of schooling keep climbing. Reading skill has stalled where it is measured carefully and is not arriving at all for most children in the poorest countries. The two lines that ran together for a century are coming apart — and only one of them is in the chart above.
The Underlying Data
Every figure behind the chart above, in full. Each row splits the world population aged 15 and over into the share who can read and write a simple statement about their everyday life and the share who cannot. The two columns are complements, so they sum to 100% in every year.
| World | 1920 | 68.38% | 31.62% |
| World | 1930 | 67.47% | 32.53% |
| World | 1940 | 58.12% | 41.88% |
| World | 1950 | 64.04% | 35.96% |
| World | 1960 | 58.38% | 41.62% |
| World | 1975 | 34.58% | 65.42% |
| World | 1976 | 34.43% | 65.57% |
| World | 1977 | 34.12% | 65.88% |
| World | 1978 | 33.5% | 66.5% |
| World | 1979 | 32.85% | 67.15% |
| World | 1980 | 32.24% | 67.76% |
| World | 1981 | 31.65% | 68.35% |
| World | 1982 | 31.07% | 68.93% |
| World | 1983 | 30.51% | 69.49% |
| World | 1984 | 29.85% | 70.15% |
| World | 1985 | 29.27% | 70.73% |
| World | 1986 | 28.73% | 71.27% |
| World | 1987 | 28.06% | 71.94% |
| World | 1988 | 26.45% | 73.55% |
| World | 1989 | 25.93% | 74.07% |
Showing 1-20 of 55
Figures are from Our World in Data’s “Literate and illiterate world population” series, which stitches together UNESCO’s 1953 and 1957 surveys, historical reconstructions by Buringh and van Zanden (2009) and van Zanden et al., and the modern UNESCO Institute for Statistics database. Coverage is deliberately uneven: the series carries one observation per decade from 1920 to 1960, jumps to 1975, and then runs annually through 2024. The pre-1975 points are estimates rather than censuses and carry wider uncertainty than the years that follow.
Conclusion
The answer to the question in the title is yes, and it is not close. In 1920 fewer than one adult in three could read and write a simple statement about everyday life. In 2024 the figure is 87.7%. Two centuries ago it was one in ten. On the definition the world has agreed to use, few human capabilities have ever spread this far this fast.
But that definition is a low bar, and the number attached to it is mostly people describing themselves. Wherever anyone has checked, the picture thins. Proficiency tests find less skill than the self-reports promise. 70% of ten-year-olds in low- and middle-income countries cannot read and understand a simple passage. Reading scores in the richest countries are falling. And in March 2025 the world formally gave up on making the tested measure its headline indicator — not because it was wrong, but because only fifteen countries could produce it.
So the chart above is true and incomplete at the same time. It records the end of mass illiteracy, which is real and worth saying plainly. What it cannot record is whether the people it counts can read a contract, a ballot or a prescription. The next stretch of this line will be decided by whether that second question ever becomes cheap enough to ask.
Our World in Data — Literacy Our World in Data — How Is Literacy Measured?
The series charted and tabulated here is Our World in Data's “Literate and illiterate world population”, which the publisher assembles from UNESCO's 1953 and 1957 surveys, historical reconstructions by Buringh and van Zanden (2009) and van Zanden et al., and the UNESCO Institute for Statistics database. Values are the share of the world population aged 15 and over.
Coverage is uneven by construction: one observation per decade from 1920 to 1960, a gap to 1975, then annual data through 2024. Points before 1975 are estimates rather than censuses and carry wider uncertainty. The apparent fall between 1940 and 1950 reflects a change in which countries the underlying UNESCO compilations covered, not a real decline in world literacy.
Definitions, measurement methods and their weaknesses are drawn from Our World in Data's methodology article, “How is literacy measured?”. Figures cited in the text from the OECD (PIAAC and PISA), the World Bank (World Development Report 2018, the STEP programme and the Learning Poverty indicator) and UNESCO and its Institute for Statistics (out-of-school counts, Mini LAMP, and the 2024 proposal to replace SDG indicator 4.6.1) are attributed in place and were checked against each organisation's own published documents.
Table values are displayed to two decimal places; the underlying data is unrounded.
Last verified: 07 Sept 2026
Related Publications
Jeddah Tower is 2.05 times the tenth-tallest. Of the ten tallest buildings under construction, only two have completion dates that hold up on site.
03 Oct 2026
US crude exports grew 84-fold from 2011 to 2025, then flattened: 2024 set the peak at 1,498.1 million barrels and 2025 fell 3.5%.
02 Oct 2026
The EIA's 2025 breakdown of US crude oil imports shows Canada supplying 63.4%, more than every other country combined, while Saudi Arabia accounts for just 4.4%.
26 Sept 2026
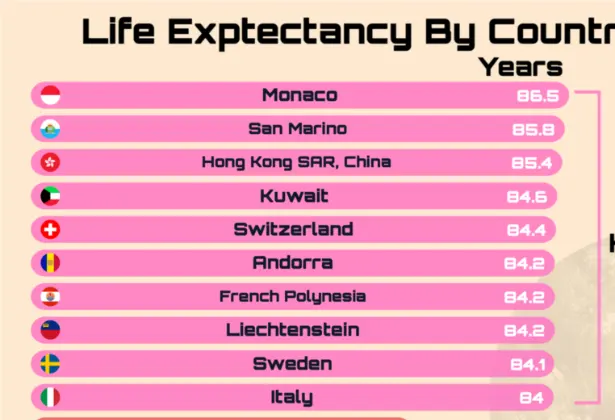
Monaco's life expectancy is 86.5 years. Nigeria's is 54.6. A 217-country ranking of the 31.9-year gap between them.
20 Sept 2026