TL;DR — Who Is Still Offline, and What Is Keeping Them Offline?
2.2 billion people, and a mobile signal over most of their heads
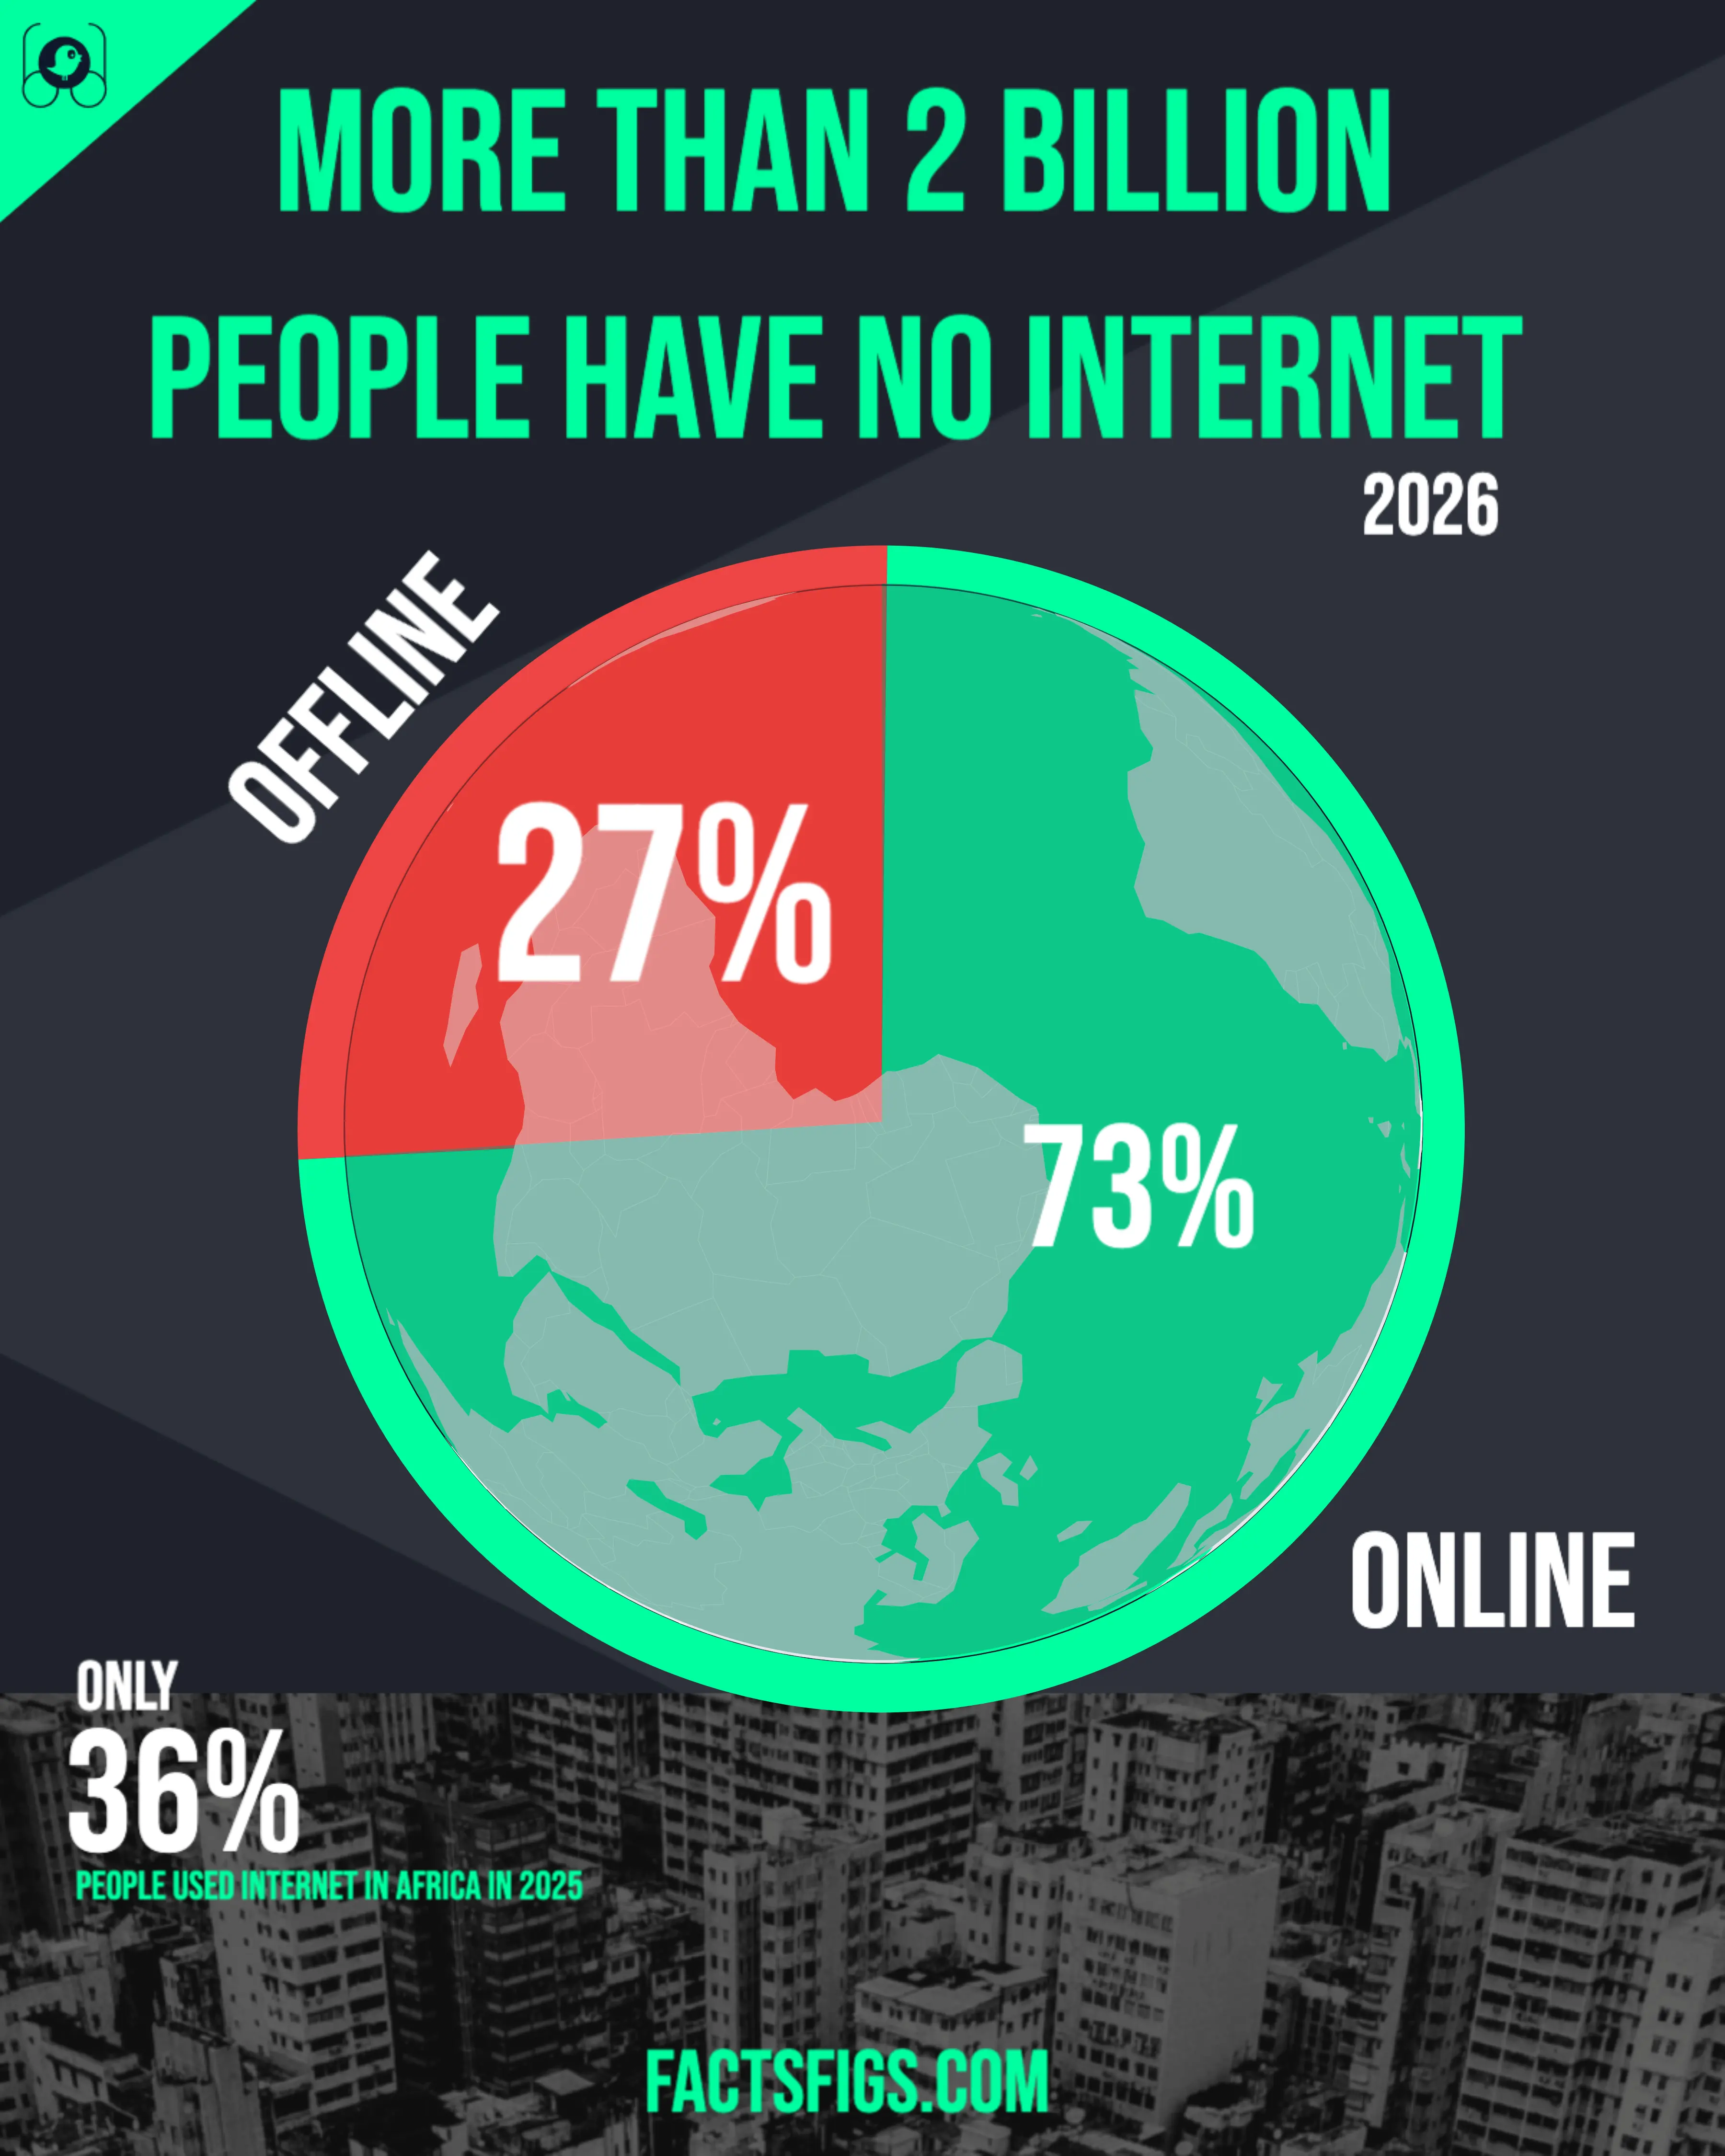
ITU counted 74% of the world's population online in 2025 — 6 billion people, up from 71% a year earlier. The remaining quarter is 2.2 billion people. The offline slice in the chart is arithmetic rather than a quotation: the agency publishes 74 and describes what is left as "the remaining quarter".
The interesting part is where those 2.2 billion live. Some 96% of the world's population is already covered by a 3G-or-better mobile network, leaving roughly 312 million people with no signal at all. Subtract the second figure from the first and about 1.9 billion people — close to 86% of everyone offline — are sitting inside a mobile broadband footprint they do not use.
That makes the last quarter far more a question of cost, devices, electricity and skills than of towers. The widest gap in ITU's entire dataset is income: 94% of people in high-income countries were online in 2025, against 23% in low-income countries.
! What the Data Actually Shows:
•
74% Online · 2.2 Billion Not:ITU's Facts and Figures 2025 puts 6 billion people online in 2025, 74% of the world's population, up from a revised 5.8 billion and 71% in 2024. Year-on-year growth was 3.3%, slightly faster than the 2.9% recorded the year before.
•
Coverage Is Not the Binding Constraint:96% of the world lives under at least a 3G network and roughly 312 million people do not. That leaves about 1.9 billion offline people inside a signal — arithmetic on two ITU figures, not a number ITU prints or a conclusion it draws.
•
Income Splits the World Harder Than Geography:High-income countries sit at 94% and low-income countries at 23%, a 71-point gap. The urban-rural gap is 27 points, the age gap 10 and the gender gap 6. Every other cut in the data is narrower than the one between rich and poor countries.
? The Numbers Behind the Story:
•
Online in 2025:74% of the world, or 6.0 billion people
•
Offline in 2025:2.2 billion, about 86% of them under a signal
•
Best vs. Worst ITU Region:CIS at 93% against Africa at 36%
Connectivity has largely stopped being an engineering problem and become an economic one. Mobile networks reached 90% of humanity in 2018 and have added just six percentage points since, because the last stretch is expensive to build and thinly populated once built. Meanwhile an entry-level mobile data plan costs 0.4% of average income in Europe and 9.4% in low-income countries — which is the plainest reason a signal overhead does not turn into a connection.
Continue reading below for the full detailed article →
Overview
Why Getting the Last Quarter Online Keeps Getting Harder
In 2025 the International Telecommunication Union counted 6 billion people online — 74% of the world's population, up from 71% the year before. That leaves 2.2 billion people who did not use the Internet at all in the previous three months, on any device, at home, at work or anywhere else. The number is smaller than it was, and it is shrinking more slowly than the headline suggests. The reason is not that the world has run out of network. ITU also reports that 96% of the world's population lives inside the footprint of a 3G-or-better mobile network, and that the roughly 312 million people with no coverage at all are concentrated where the next tower is expensive to build and thinly used once built. Put those two figures side by side and the shape of the problem changes: most of the people still offline are not waiting for infrastructure. They are priced out, device-short, power-short or skill-short. This piece is about them.
The Three Numbers That Define Who Is Still Offline
ITU's 2025 figures put 74% of humanity online and leave 2.2 billion people out of it. Three numbers explain who those people are and what is actually holding them back: how many of them already live under a mobile signal, how far apart the richest and poorest countries sit, and which region carries the deepest shortfall of all.
1.9 Billion Are Offline Inside a Mobile Signal
1.9B people
ITU reports 2.2 billion people offline in 2025 and roughly 312 million living beyond any mobile broadband network. Subtracting the second from the first leaves about 1.9 billion people — close to 86% of everyone offline — who already have a signal overhead and still do not use it. ITU publishes both inputs but never prints this figure itself.
71 Points Separate High- and Low-Income Countries
71 pp gap
In high-income countries 94% of people used the Internet in 2025. In low-income countries the figure was 23%. That 71-point gap is by far the widest division anywhere in ITU's dataset — nearly three times the 27-point urban-rural gap, and more than ten times the six-point gap between men and women. Income sorts the world first.
Africa at 36%, the Lowest of Six ITU Regions
36%
Africa reached 36% Internet use in 2025, against 93% in the CIS and 92% in Europe. It is also where almost half of everyone with no mobile network lives, where 5G reaches just 12% of the population, and where a 5GB mobile data plan costs 5.3% of average income against a world median of 1.4%.
The 2.2 Billion Offline, by the Numbers
96% of Offline People Live in Low- and Middle-Income Countries 96 %ITU's November 2025 press release states that 96 per cent of the people who remain offline live in low- and middle-income countries. This is a different statistic from the 96% network-coverage figure quoted elsewhere in the same material, and the two are unrelated.
Just 58% of Rural Residents Are Online Worldwide 58 %Internet use reached 85% among city dwellers in 2025 but only 58% in rural areas, a ratio of about 1.5 to 1. That ratio runs from 1.1 in Europe to 2.6 in Africa, so the rural penalty is far heavier in poorer regions.
Only 23% of People in Low-Income Countries Are Online 23 %Low-income countries reached 23% Internet use in 2025, up from 16% in 2019 — seven percentage points in six years, against a twenty-point gain for the world as a whole over the same span.
How the 1.9 Billion Is Calculated
This is the most striking number in the post and it is not a published ITU statistic, so here is exactly how it is built. Facts and Figures 2025 states that 2.2 billion people remained offline in 2025. The same report states that 96% of the world's population is covered by a 3G-or-better mobile network, and that the uncovered 4% comes to approximately 312 million people. Subtracting the second figure from the first leaves about 1.9 billion people who are offline despite living inside a mobile broadband footprint — roughly 86% of everyone offline. Both inputs come from the same report and the same reference year, so no vintages are being mixed, but both are rounded: "about 1.9 billion" and "roughly 86%" are as precise as the published figures support. ITU itself neither prints the number nor draws the conclusion.
Coverage vs. Use
Most of the Offline Already Live Under a Signal
Mobile network coverage is close to finished as a global project. ITU reports that 96% of the world's population lived within range of a 3G-or-better network in 2025 — 3.6% with only 3G, 37.6% reaching 4G and 55.1% reaching 5G. The last stretch is the hard one. Coverage first passed 90% in 2018 and has gained just six percentage points in the seven years since, because the roughly 312 million people still outside any footprint live where towers are expensive to build and lightly used once built. Almost half of them are in Africa.
That is what makes the subtraction worth doing. Take ITU's 2.2 billion offline, remove the 312 million with no network, and about 1.9 billion people are left who could connect to a mobile broadband network today and do not. That is roughly 86% of everyone offline. It is arithmetic on two ITU figures rather than an ITU finding, and both inputs are rounded — but the direction is not in question, and it reframes the whole problem.
What keeps those 1.9 billion off is a stack of ordinary obstacles rather than a missing tower: the price of a handset, the price of a gigabyte, electricity that is unreliable or absent, literacy and digital skills, content in the wrong language, and in many households an unwritten rule about who gets to use the one phone. ITU's own framing is that 96% of the people who are offline live in low- and middle-income countries — a different 96% from the coverage figure, measuring a different population, and worth keeping firmly separate from it.
Two Ways to Count
Why GSMA Counts 3.4 Billion Where ITU Counts 2.2
A reader who checks a second source will quickly find a bigger number. GSMA's State of Mobile Internet Connectivity 2026 reports 4.8 billion mobile Internet users at the end of 2025 — 59% of the world — and 3.4 billion people not using mobile Internet, of whom 38% of the global population live under coverage without using it and 3% have no coverage at all. Set against ITU's 6 billion online and 2.2 billion offline, that looks like a flat contradiction.
It is not. The two organisations count different populations. ITU counts anyone who used the Internet in the previous three months on any device over any connection, including fixed broadband at home, a shared household phone, and public access at a school, library or café. GSMA counts people using mobile Internet on a device of their own. The distance between 6.0 billion and 4.8 billion is mostly made up of people who get online through something other than a handset they personally own.
Both figures are correct on their own definitions, and neither belongs in the other's sentence. The chart at the top of this piece is ITU's, on ITU's definition, for 2025 — which is also why the offline slice is simply 100 minus ITU's published 74, rather than a share the agency prints.
The Widest Cut
Income Divides the World Harder Than Geography
Slice ITU's 2025 data any way you like and income wins. High-income countries sit at 94% Internet use, upper-middle-income at 89%, lower-middle-income at 63% and low-income at 23%. The 71-point distance between the top and bottom groups is the widest gap anywhere in the dataset. The next widest cut, urban against rural, is 27 points. Age is 10 points and gender is 6. Every much-discussed divide turns out to be smaller than the one between rich and poor countries.
The divides also compound rather than sit side by side. A city dweller in a high-income country is at 96%. A rural resident of a low-income country is at 14% — ITU's own phrasing is "only one in seven rural dwellers". That 82-point spread is wider than any single-dimension cut in the report, and it is the gap that actually describes who the 2.2 billion are: rural, poor, and usually both at once.
The UN's special country groupings tell the same story from another angle. The least developed countries reached 34% in 2025 and the landlocked developing countries 38%, against a world figure of 74%. Small island developing states sit at 64%, and are the one group in the entire dataset where women and men are online at exactly the same rate — 64% each, which ITU's own text confirms as genuine parity rather than a rounding artefact.
Region by Region
From 93% in the CIS to 36% in Africa
ITU's six regions run from the CIS at 93% and Europe at 92% down to Africa at 36%, a spread of 57 percentage points. The Americas reach 88%, Asia-Pacific 77% and the Arab States 70%. Only Africa and the Arab States sit below the world's 74%, and Africa sits so far below it, with so large a population, that it pulls the global figure down on its own.
Africa is the outlier more than once over. It has the lowest use, the lowest 5G coverage at 12% of population, the highest prices at 5.3% of average income for a 5GB mobile plan, the widest urban-rural ratio at 2.6 to 1, and almost half of everyone on earth with no mobile network at all. It is also where most of the remaining growth has to come from, because the regions already above 88% have very little headroom left to gain.
One caveat matters before anyone reads the table below as a map. ITU's six regions are administrative groupings, not continents. The Arab States cut across Africa and Asia — Egypt, Algeria, Morocco, Sudan, Libya and Tunisia are counted in both Africa and the Arab States — and the CIS cuts across Europe and Asia, with Russia and Belarus in both. There is no Oceania row, because Oceania sits inside Asia-Pacific. The six overlap, they do not partition humanity, and they do not sum to the world.
Affordability
What a Month of Mobile Data Costs, and Who Cannot Pay
The clearest reason a signal overhead does not become a connection is price, and ITU measures it in the only way that travels across borders: as a share of average income. An entry-level mobile broadband plan with at least 5GB a month costs 0.4% of GNI per capita in Europe and 9.4% in low-income countries. Africa as a region sits at 5.3%, against a world median of 1.4%. ITU's own summary is that subscribers in low-income countries spend about 22 times more, relative to what they earn, than subscribers in high-income countries.
The affordability benchmark ITU measures economies against is 2% of GNI per capita. In 2025, 130 of 205 economies met it on the mobile basket, six more than the year before, and 88 of 195 met it on the fixed basket. But only about four in ten low- and middle-income economies met the target on either basket — which is to say it is largely met where it was never really binding and missed where it matters most.
One thing not to do with these figures is read them as a trend. ITU moved to a data-only 5GB basket in 2024, and the 2024 numbers printed in its 2025 report are experimental back-casts fitted to that new methodology rather than the figures the agency published at the time. Year-on-year movements on this measure are not comparable in the ordinary way, so this post quotes 2025 levels and leaves the direction of travel alone.
Who the Offline Are
Rural, Female and Past Their Twenties
The rural-urban split is the second widest cut in ITU's data: 85% of city dwellers were online in 2025 against 58% of rural residents, a ratio of about 1.5 to 1 that has narrowed only slightly from 1.6 four years earlier. That ratio is 1.1 in Europe and 2.6 in Africa — so the penalty is not really about countryside as such. It is about countryside in places without much money.
The gender gap is real and narrower than its reputation. Women are at 71% globally and men at 77%, a six-point difference that works out to roughly 280 million more men than women using the Internet. ITU's parity score has sat at 0.92 since 2019, unmoved in six years. Europe, the Americas and the CIS have reached parity; the Arab States sit at 0.86 and Africa at 0.78, though Africa's figure has climbed sharply from 0.70 in 2019.
Age is the narrowest cut of all at world level: 82% of 15-to-24-year-olds are online against 72% of everyone else. But the average hides the interesting part. In high-income countries young people are only about 5% more likely to be online than the rest of the population, because the rest of the population is already at 94%. In low-income countries they are 1.9 times more likely — 38% against 20%. Youth connectivity arrives first, and everybody else follows slowly.
Momentum
Why Progress Is Slowing Where It Matters Most
Growth is real. World Internet use rose from 54% in 2019 to 74% in 2025 — twenty percentage points in six years — and the 2025 year-on-year increase of 3.3% was slightly faster than 2024's 2.9%. But the gains have not landed evenly. Lower-middle-income countries moved from 33% to 63% over the same six years, a thirty-point leap. Low-income countries moved from 16% to 23%. Seven points.
The infrastructure curve is flattening for the same underlying reason. Mobile coverage passed 90% of the world in 2018 and has added six points since, and ITU describes extending it further as "slow and complex". The places the remaining growth must come from — rural Africa, the least developed countries, the landlocked group whose mobile data prices actually moved up rather than down between the two most recent readings — are exactly the places where each additional percentage point is most expensive to buy.
A measurement note belongs here too, because the headline figures themselves move. ITU revised its 2024 estimate upward, from 5.5 billion Internet users to 5.8 billion, which pulled the 2024 offline count down from 2.6 billion to 2.3 billion. The older 2.6 billion is still widely quoted, and setting it against 2025's 2.2 billion would invent a one-year fall of 400 million people that never happened. On a consistent basis the move was 2.3 billion to 2.2 billion.
The Full Data Table
Internet Use Across ITU's Six Regions, 2019 and 2025
ITU's six regions are administrative groupings rather than continents: the Arab States cut across Africa and Asia, the CIS cuts across Europe and Asia, there is no separate Oceania row because Oceania sits inside Asia-Pacific, and the Americas combine North, Central and South America. The six therefore overlap and do not sum to the world row, which appears here as a benchmark rather than a total.
CIS
93%
76%
96%
88%
8%
0.9%
Europe
92%
82%
94%
87%
74%
0.4%
Americas
88%
76%
91%
75%
60%
1.8%
Asia-Pacific
77%
50%
88%
66%
70%
1.4%
Arab States
70%
54%
82%
51%
13%
1.5%
Africa
36%
25%
55%
21%
12%
5.3%
World (benchmark)
74%
54%
85%
58%
55%
1.4%
All values are ITU's published figures from Measuring digital development: Facts and Figures 2025. The 2019 column is that edition's own back-series and is comparable with its 2025 column, but not with figures ITU published in earlier editions. 5G coverage is the share of population within range of a 5G network. Data cost is the data-only mobile broadband basket of at least 5GB a month, as a share of GNI per capita, 2025.
Conclusion
A Demand Problem, Not a Signal Problem
Three quarters of humanity was online in 2025 and about a quarter was not. Read as a coverage story, that looks like 2.2 billion people waiting for a network to arrive. Read against ITU's own coverage figures, it looks like something else entirely: roughly 1.9 billion of them already live under a mobile broadband signal, and what stands between them and a connection is a handset they cannot afford, a data plan priced at nearly a tenth of a month's average income, a power supply that does not hold, or skills nobody taught them.
That changes what closing the digital divide has to mean in practice. Building networks out to the remaining 312 million uncovered people is still worth doing and still genuinely hard — six percentage points in seven years is the measure of how hard. But the larger job is on the demand side, and it is counted in handset prices, data tariffs, electrification and basic digital education rather than in base stations. The 71-point gap between high- and low-income countries will not close because a tower went up.
A closing note on freshness: every figure in this piece comes from ITU's Measuring digital development: Facts and Figures 2025, published in Geneva in November 2025 and still the current edition. ITU publishes the series annually in November, so a 2026 edition is due shortly and these numbers should be re-read against it once it lands.
The data behind this story comes from the International Telecommunication Union's Measuring digital development: Facts and Figures 2025, the UN agency's annual statistical report, published in Geneva in November 2025 and still the current edition at the time of writing. The regional, income-group, urban-rural, gender, age, network-coverage and affordability figures are ITU's own published values, taken from the report and its accompanying press release; GSMA's State of Mobile Internet Connectivity 2026 appears only to explain why two respected sources report different totals. The dataset is published by ITU for public use with attribution, and full credit for collecting, modelling and maintaining it goes to ITU's Telecommunication Development Bureau.
FactsFigs reviews, cleans, and cross-checks every source dataset before shaping it into a data story. Each visualization is created and designed in FactsFigs Design Studio — an internal tool developed and owned by FactsFigs — and is the original work of a FactsFigs author, not an AI-generated copy of any existing graphic. Individual assets within a visual may or may not be produced with AI tools, but the design of the visual itself is solely FactsFigs' own.
Figures are estimates at the time of publication, provided for information only — nothing here is financial advice or a guarantee of accuracy.
Last verified: 21 Sep 2026
The charts in this article were built with our own publishing system. See what it does →