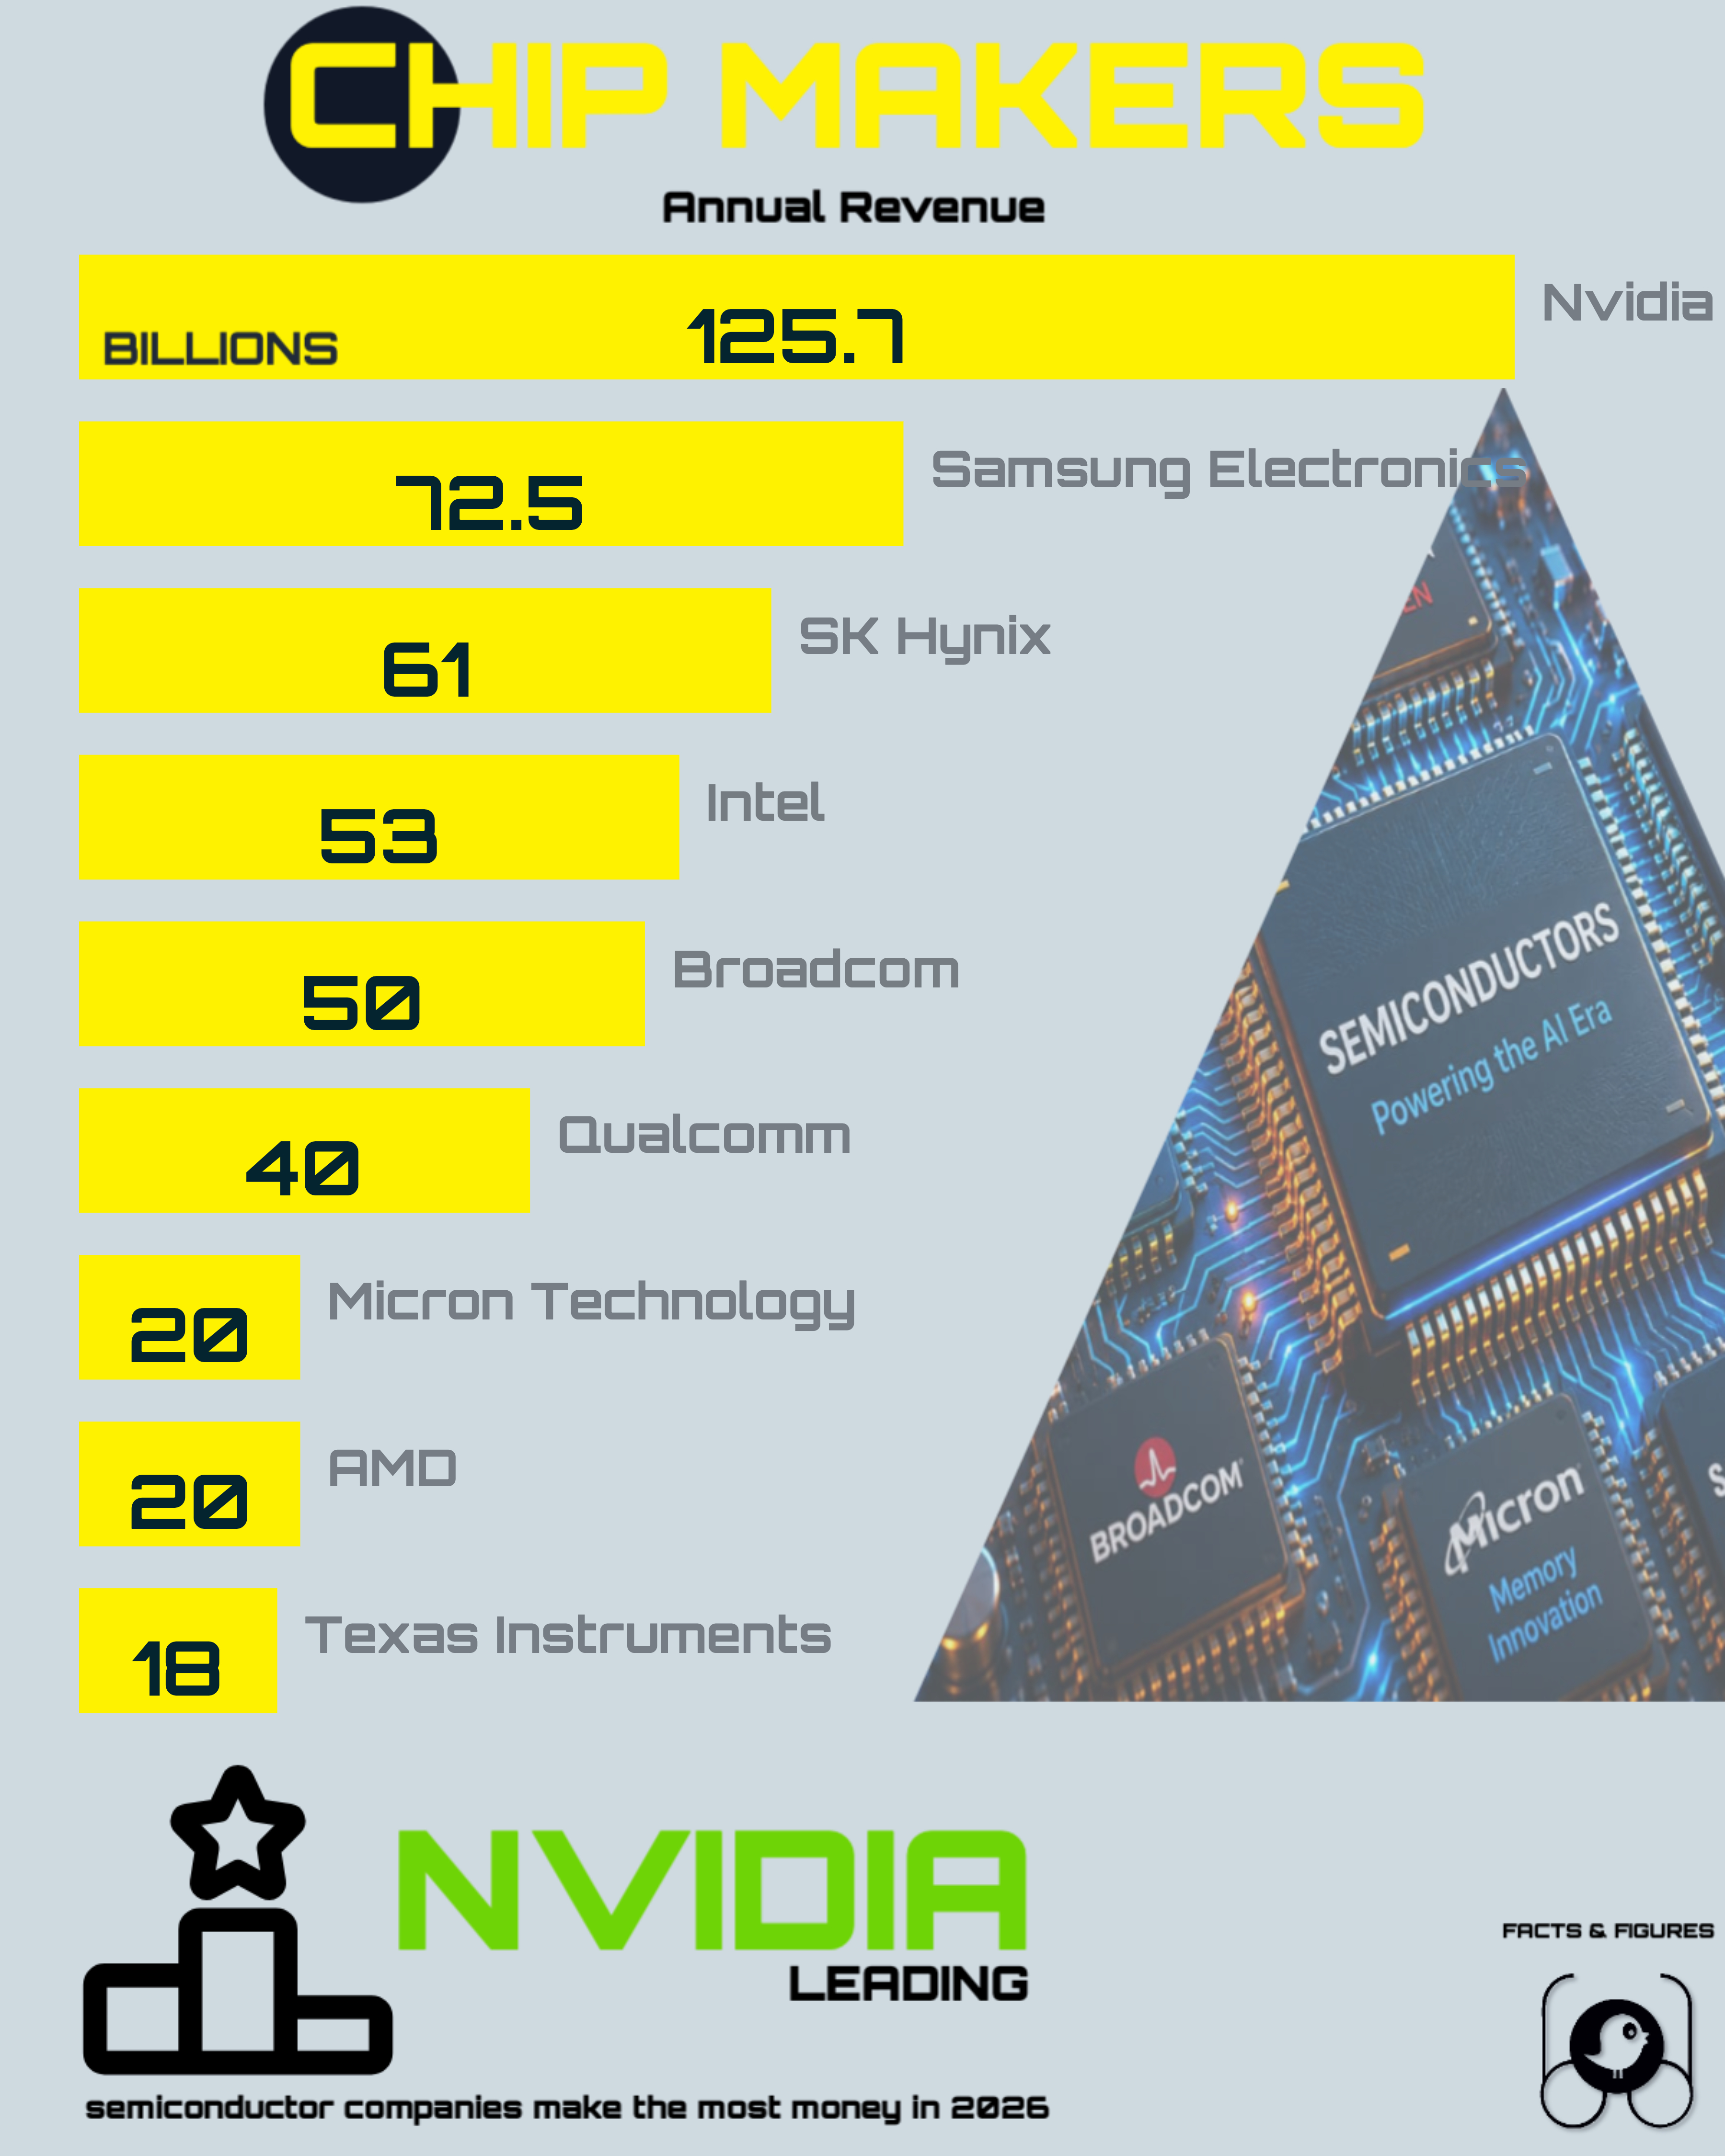
Top 10 Semiconductor Companies by Revenue
Facts & Figures
Visual Intelligence
Visuals are simplified for clarity. Read values and labels with the cited source context.
Primary Signal
Nvidia earns $125.7B, underscoring dominance driven by AI processors and datacenter GPUs.
Quick Snapshot
- Total Revenue 460.2 B Combined revenue of listed companies is $460.2B, indicating the sector's massive commercial scale.
- Top 3 Share 56 % Top three companies account for 56.3% of combined revenue, showing concentrated market power.
- High Earners 5 Five companies report at least $50B each, showing a concentrated top tier (5 of 9 firms).
Industry Landscape
The semiconductor industry is currently undergoing a structural transformation driven by the explosive demand for high-performance computing and artificial intelligence. As architectural shifts favor specialized hardware, market leaders are pivoting to prioritize datacenter acceleration, high-bandwidth memory, and advanced foundry services. This ranking highlights the current revenue leaders who are defining the compute-intensive future, illustrating how foundational silicon innovation has become the primary catalyst for global economic growth in the digital age.
Rank snapshot
Top-line: Who’s on top and by how much
Lead: Nvidia sits well ahead of every other semiconductor company in the 2025/2026 revenue dataset, reporting $125.7 billion versus Samsung Electronics at $72.5 billion and SK Hynix at $61.0 billion — a structurally significant gap driven by AI demand for datacenter GPUs and accelerators. Suggested lead sentence: “Nvidia’s AI-driven surge has widened the revenue gap: $125.7B versus the next competitor’s $72.5B.” Pull quote: “Nvidia earns $53.2B more than #2 — roughly 1.73× Samsung.” (Use the pull quote for emphasis in the lead visual.) Note: the table includes ranks 1–9; row #10 is missing from the supplied dataset and should be investigated before publication.
Scope & caveats
Data, scope and important caveats
Dataset basis: figures are reported in USD billions under the provided 2025/2026 Annual Revenue column; entries are taken directly from the supplied CSV and should be treated as reported or rounded values rather than normalized accounting figures. Units: USD billions; column label = 2025/2026 Annual Revenue. Approximations: several rows use shorthand (e.g., “50+ billion”, “40+ billion”, “20+ billion”) or a range (Texas Instruments listed as “15–18 billion”); treat these as approximations when computing shares or ranks and reconcile with original annual reports for precision. Missing rank: the dataset lists only nine companies (ranks 1–9); verify the intended #10 entry before final publication. Verification steps for editors: cross-check each figure with the company’s latest annual report or 10-K, note GAAP vs. non-GAAP differences, confirm currency conversions and fiscal-year alignment.
Data Table
Comparison Table
Use this block to show structured rows of data.
| No table data | |||
Upload a CSV file from the table block editor to populate this table.
How to read the chart
Visual guide: reading the chart and key callouts
Visualization plan: present a horizontal bar chart ordered by revenue (largest to smallest), labels showing company name and exact revenue string from the dataset (e.g., “Nvidia — $125.7B”). Color coding: assign category colors by primary driver — AI/Compute (Nvidia, AMD), Memory (Samsung, SK Hynix, Micron), Networking/ASICs (Broadcom), CPUs/Foundry (Intel), Analog/Wireless (Texas Instruments, Qualcomm) — and include a legend. Three chart annotations: (1) Nvidia lead: annotate absolute gap ($53.2B) and revenue multiple vs #2 (≈1.73×); (2) Memory cluster: group Samsung, SK Hynix and Micron with a bracket and note combined memory-driven position; (3) Mid-tier battleground: call out proximity among Intel, Broadcom, Qualcomm and AMD and flag approximation markers for “50+” and “40+” entries. Insets and tables: add a small inset pie or bar showing percent share of combined top-9 revenue, plus a 2-column table listing each company and its primary drivers (from the dataset) beneath the chart for quick reference.
Why Nvidia leads
Nvidia and the AI-driven revenue gap
Nvidia’s $125.7B is driven primarily by AI processors and datacenter GPUs; the company’s product mix is concentrated on high-performance accelerators that command premium ASPs and strong enterprise demand tied to large-scale AI training and inference. Ecosystem effects: Nvidia’s software stack, developer tools, and broad industry adoption create platform-level advantages that amplify hardware revenue relative to more commodity-like product lines. Business-model contrast: unlike memory incumbents (Samsung, SK Hynix, Micron) that sell high-volume DRAM and NAND, Nvidia’s revenue is skewed toward specialized compute, which alters margin profiles, capex dynamics and customer concentration risks. Suggested metrics to include in the graphic/story: revenue multiple vs #2 and #3, datacenter share of Nvidia revenue (as reported), and normalized gross-margin comparison vs memory peers to illustrate profitability differences. Analyst takeaway: “The revenue gap reflects platform-driven demand for accelerated compute — a structural shift that favors specialized silicon and integrated software stacks,” — industry analyst (paraphrased).
Bottom line
Conclusion
Takeaway: the semiconductor revenue landscape for 2025/2026 is defined by an AI-driven surge that places Nvidia well ahead of traditional memory leaders, while memory vendors and diversified incumbents retain strategic importance across different segments. Implications: expect continued capital spending on AI compute and high-bandwidth memory, supply-chain concentration around advanced packaging and HBM, and strategic shifts by foundries and fab-heavy players to capture acceleration demand. Next steps for coverage: verify the missing #10 entry, reconcile approximate figures with company filings, and consider a follow-up piece on margin and capex trends across compute vs. memory vendors.
Data Source and Attribution
Company Annual Reports & Investor RelationsCompaniesMarketCap
This ranking is compiled using publicly reported semiconductor revenue from company annual reports, investor filings and vendor rankings. Revenue figures represent semiconductor-related business operations and are normalized to U.S. dollars where applicable.
FactsFigs Methodology: Rankings are based on annual semiconductor revenue and are intended for informational and editorial purposes. Revenue may vary depending on fiscal year reporting periods and segment classifications.
Last verified: 28 June 2026
Related Publications
More from FactsFigs
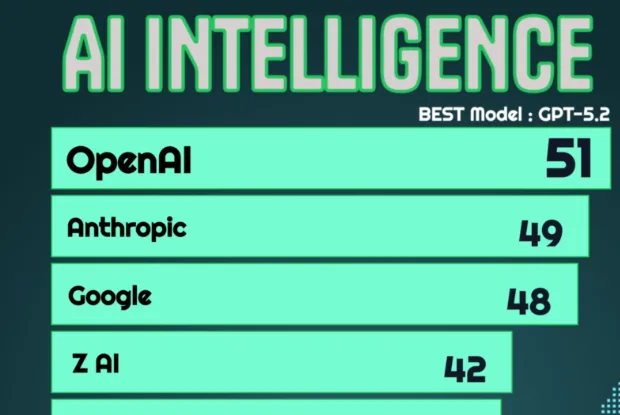
Top 10 AI Companies By Intelligence Score
OpenAI holds the highest single-model intelligence score at 51. The top three creators are tightly clustered, and model counts vary independently of peak score.
24 Jun 2026

Fifa 2026 Worldcup Match Venues
FIFA World Cup 2026 will be played across 16 stadiums in Canada, Mexico, and the United States. The venues collectively offer more than 1 million seats, making it the largest stadium network ever assembled for a World Cup. AT&T Stadium leads all host venues with a capacity of 94,000 spectators.
01 Jun 2026
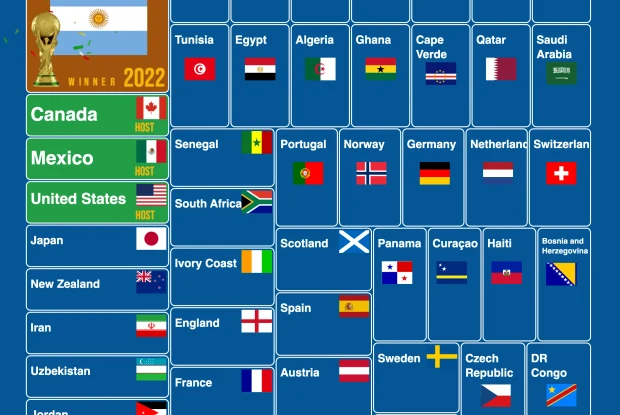
Fifa 2026 Football World Cup Teams
FIFA World Cup 2026 will feature a record 48 qualified teams. The expanded format creates the most globally representative tournament field in World Cup history. Canada, Mexico, and the United States enter automatically as co-host nations.
29 May 2026
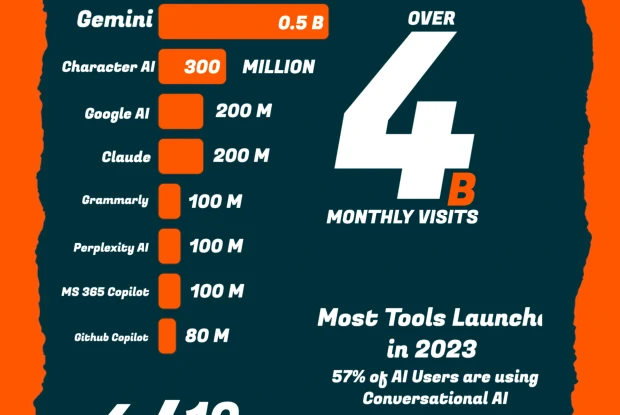
Top 10 AI Tools - Billions Of Visitors Per Month
Conversational AI platforms continue leading the AI economy by massive margins.ChatGPT alone records an estimated 1.8B monthly visits.
25 May 2026