TL;DR — Did Data Center Construction Take Off After ChatGPT?
US private data center construction, 46 months before and after November 2022
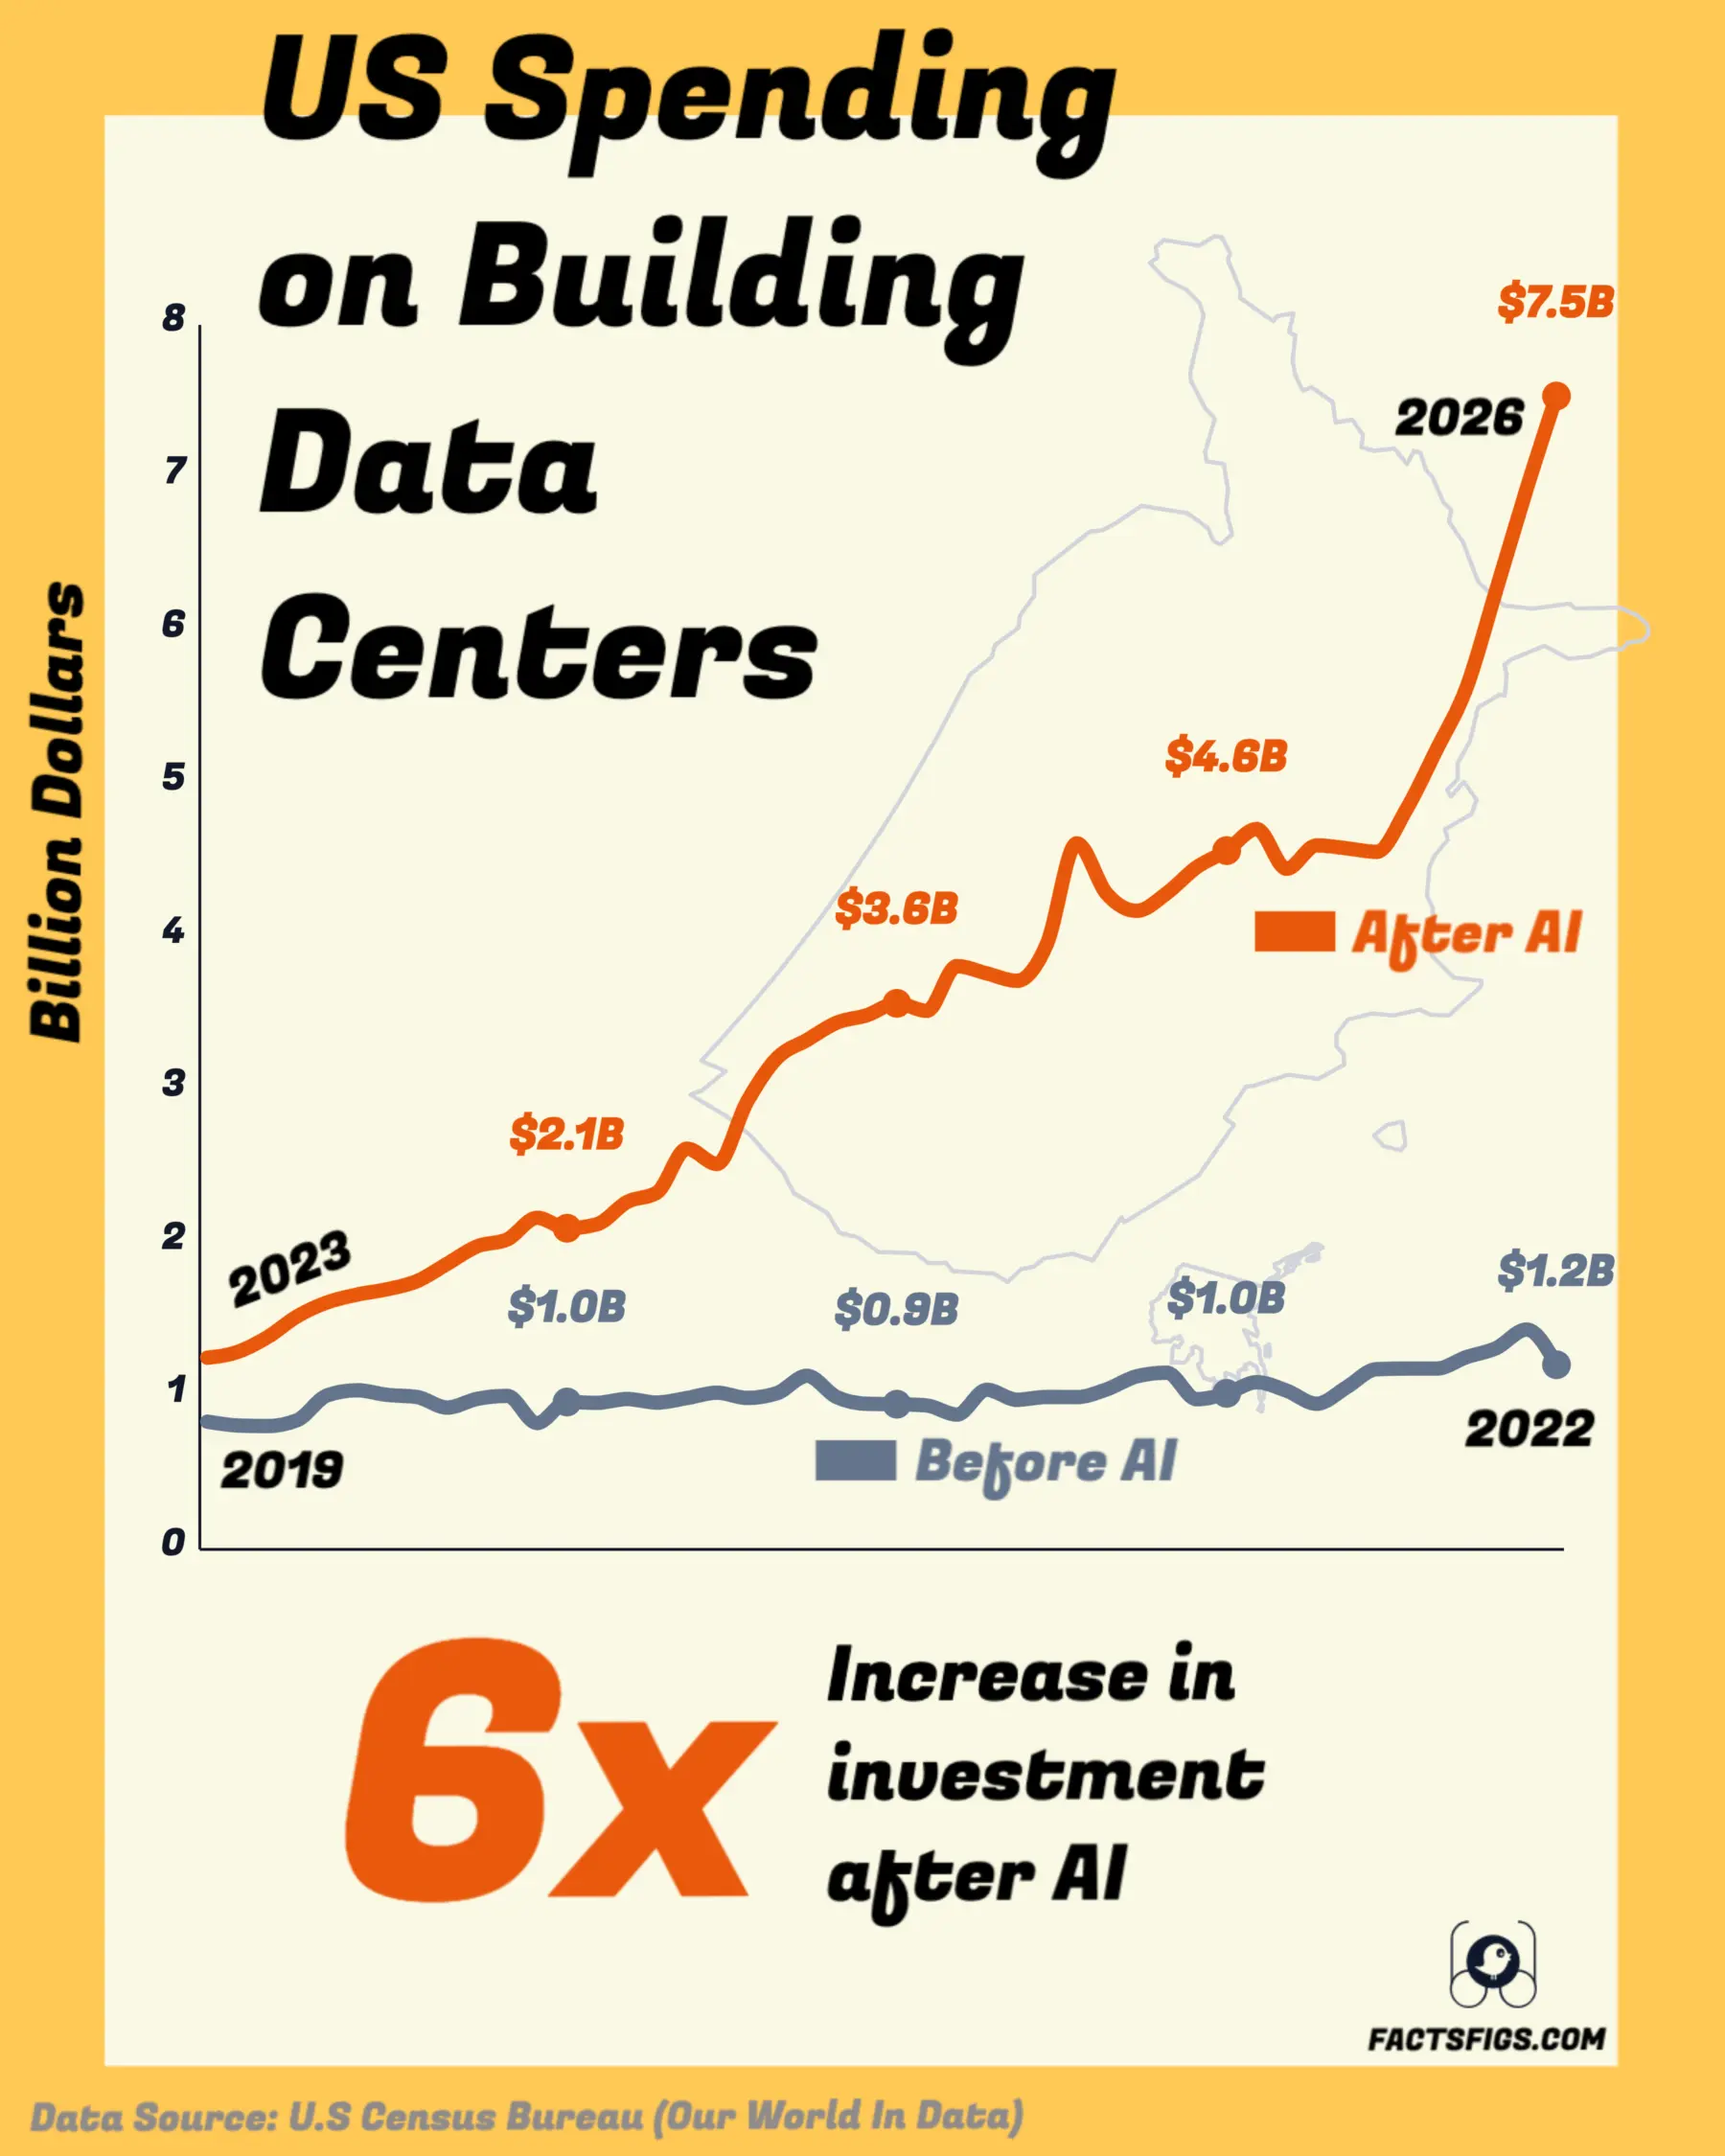
In the 46 months from November 2022, private owners put $158.6bn of data center construction in place across the US, 3.37 times the $47.1bn of the 46 months before, in August 2026 dollars.
The figures cover buildings only, not servers, and Census cannot tell AI facilities from the rest. Spending was already rising before ChatGPT, and the financing behind it is where the doubts sit.
! Five Points Behind the Comparison:
•
The Buildings Are About a Third:Epoch AI models a 1 GW AI site as 55.9% servers, 30.2% facility and 13.0% network. Census counts only the building.
•
Same Start, Different Slope:Monthly spending began each window near $1bn, then rose 1.45x in the first and 6.02x in the second.
•
The Buildout Predates ChatGPT:Real annual spending rose about 4.4x from 2014 to 2019, and the latest climb began in early 2022.
•
A Date Marker, Not a Cause:Gigawatt sites took 1 to 3.6 years to build, so early After months reflect earlier decisions.
•
Financing Is the Weak Point:Alphabet's Q2 free cash flow was -$5.9bn and Amazon's trailing-year figure is -$7.6bn.
? The Numbers Behind the Story:
•
After-window total, Nov 2022 to Aug 2026:$158.6bn
•
Before-window total, Jan 2019 to Oct 2022:$47.1bn
•
Share of private nonresidential construction, Nov 2022 to Aug 2026:2.0% to 11.3%
•
Month 46 spend, After window:$7.54bn (preliminary)
Data center buildings are going up at a pace the previous 46 months never approached, but the series tracks a construction schedule, not AI demand. The open question is who pays for the chips and power inside.
Continue reading below for the full detailed article →
Overview
What These Figures Count, and What They Skip
The US Census Bureau tracks data centers as a building category: the structure, the mechanical and electrical plant, architects' fees, and interest and taxes during construction. It excludes racks and servers, which is why these dollars sit far below the capex headlines. Everything is adjusted for inflation into August 2026 dollars, and "Before AI" is simply the 46 months to October 2022, a date marker rather than a measured category. The comparison asks how fast the buildings are going up, not what AI costs.
The Three Numbers That Frame the Buildout
Three figures carry the comparison: how much more was built after November 2022, how steeply monthly spending climbed inside that window, and how much of all private nonresidential construction now goes into data centers. Each is a Census figure, and each carries the same caveat: the buildings are only a slice of what AI infrastructure costs.
After Spending Outran Before by 3.37x
3.37x
The 46 months from November 2022 to August 2026 add up to $158.6bn in August 2026 dollars, against $47.1bn for the 46 months from January 2019 to October 2022. The windows are equal in length and inflation is removed, yet the later one is 3.37 times larger. The gap comes from slope, since both began near $1bn a month.
Monthly Spend Grew 6.02x in the After Window
6.02x
Inside the After window, monthly spending climbed from $1.25bn in November 2022 to a preliminary $7.54bn in August 2026. The window before moved from $0.83bn to $1.21bn, a 1.45x rise. Because both begin at similar heights, the contrast lies in how fast each line climbs, not in where it started or which year was chosen.
Data Centers' Share of Private Nonresidential Building
11.3%
Data centers were 2.0% of US private nonresidential construction in November 2022 and 11.3% in August 2026, on Census figures in current dollars. Over the year to August 2026, all other private nonresidential building fell about 6% while the total was roughly flat, so the sector's growth now comes almost entirely from this one category.
The After Window by the Numbers
Nov 2022, month 1 $1.25bn The start of the After window, a level the Before window had nearly reached by October 2022 at $1.21bn.
Nov 2024, month 25 $3.52bn Monthly spending had nearly tripled in two years and first passed $3bn in June 2024.
Aug 2026, month 46 $7.54bn A preliminary Census reading; June and July 2026 are revised, and August can still move.
Census files data centers under private office construction as buildings that contain the hardware for storing, processing and transmitting digital information. The value covers the shell, electrical work, air-conditioning, emergency backup power, design fees, and interest and taxes paid during construction. The definition excludes racks and servers.
Epoch AI Model · Servers 55.9%, Facility 30.2%
Epoch AI's May 2026 cost model puts a stylised US hyperscaler 1 GW AI site at $37.9bn up front: servers $21.2bn (55.9%), facility $11.4bn (30.2%) and network equipment $4.9bn (13.0%). The facility line is built from a data center construction cost index, close to what Census counts. Epoch says it is not an estimate for any specific facility.
Microsoft describes the same split. Of $41bn of capital expenditure in April to June 2026, including finance leases, roughly two thirds went on short-lived assets, mainly CPUs and GPUs, CFO Amy Hood said. The rest was long-lived assets, which covers more than buildings, so a third is a ceiling for the building share.
Headlines need the same care. The IEA says capex at five large technology companies passed $400bn in 2025, while Census puts all US private data center construction at $49.7bn that year in current dollars. Company capex includes servers and sites abroad, so the two are an order-of-magnitude check, not a ratio.
Before the Pivot
Why the Buildout Did Not Start in November 2022
The Before window is not a flat baseline. In real terms, US data center construction rose about 4.4 times from $2.5bn in 2014 to $11.1bn in 2019, so the window opens after a long climb. Inside it, monthly spending still grew 1.45x, from $0.83bn in January 2019 to $1.21bn in October 2022.
Most of that growth came late. Calendar-year spending in real terms went from $11.1bn in 2019 to $14.3bn in 2022, only 1.29x, and monthly spending averaged $1.18bn across January to October 2022 against $0.92bn in 2019. The upturn began in early 2022, months before ChatGPT arrived in November.
Back-Cast History · Published Only Since July 2024
None of this history was watched as it happened. The AGC reported that Census released its first data center estimates in July 2024, with monthly values back to January 2014; before that, the buildings sat inside the broader office category. The 2014 to 2022 figures are a reconstruction, with no independent series to check them against.
After November 2022
How Monthly Spending Climbed From $1.25bn to $7.54bn
There is no step at the pivot. October 2022 stood at $1.21bn and November at $1.25bn; the line simply keeps rising and gets steeper. Monthly spending first reached $2bn in September 2023, $3bn in June 2024, $4bn in April 2025 and $5bn in April 2026, then passed $6bn in June 2026.
Calendar years show the same staircase in real terms: $21.9bn in 2023, $37.0bn in 2024 and $51.6bn in 2025, against $14.3bn in 2022. January to August 2026 already totals $45.6bn, 37% above the same eight months of 2025.
The steepest stretch is the latest. Spending rose from $4.84bn in March 2026 to a preliminary $7.54bn in August, up 56%, and the final ten months alone, November 2025 to August 2026, add up to $54.6bn, more than the whole $47.1bn Before window. That is also where revision risk is highest.
Cause and Timing
Why the ChatGPT Date Is a Marker, Not a Cause
November 2022 is where the comparison splits, not a switch the industry flipped. Census does not separate AI data centers from cloud, colocation and enterprise ones, so "Before AI" and "After AI" are labels for dates. Microsoft's Hood said customers increasingly build solutions that use both AI and non-AI infrastructure.
Build times rule out a quick effect. Epoch AI found that gigawatt-scale sites which broke ground in the past three years took 1 to 3.6 years to reach 1 GW, and Census records value put in place, meaning work done in the month, not contracts signed. Spending in early 2023 mostly reflects projects approved earlier.
The defensible reading is that a buildout already accelerating in 2022 kept going, and AI demand is now the reason companies give for it, as Alphabet's June 2026 equity raise shows. The later months, at several times the pre-2022 pace, are where an AI link is plausible. The early ones are not evidence of it.
Where the Sites Are
Where Construction Is Moving: Atlanta Overtakes Northern Virginia
Census publishes no state breakdown for this category that we found, so geography comes from brokers' trackers, which count megawatts rather than dollars. JLL's midyear 2026 report says 77% of North American capacity under construction is in frontier markets, naming West Texas, Ohio, Louisiana, Indiana and the Carolinas. CBRE's first-half 2026 report calls Atlanta the most active construction market in North America for the first time, with nearly 2,900 MW under way, overtaking Northern Virginia.
Gigawatt figures depend on who is counting. CBRE counts 7,481 MW under construction in primary markets, up 24.8% on a year earlier. JLL counts more than 66 GW under construction across North America. Sightline's estimate, reported by Bloomberg on 1 April 2026, had only about 5 GW of roughly 12 GW due online in the US in 2026 under construction, though SemiAnalysis answered that its denominator was flawed and that the two largest hyperscalers alone exceed 5 GW.
Chips vs Buildings
Why Capex Can Keep Climbing While Buildings Level Off
In April to June 2026, Alphabet, Amazon and Meta spent $129.2bn on property and equipment, up 82% from $71.2bn a year earlier. Census-measured data center construction rose 36% over the same quarter in current dollars, from $12.5bn to $17.1bn. The scopes differ, so the gap fits money shifting to chips without proving it.
The One Peak Forecast · $86bn in 2026, $63bn by 2030
If more of each dollar goes to hardware, construction can plateau while total capex rises. The only explicit forecast of a peak we found, from Moca Systems via Bisnow in November 2025, has US data center spending at $86bn in 2026 and $63bn by 2030. Census's seasonally adjusted rate for preliminary August 2026 is $85.0bn a year, level with that peak, and the line has not turned. The forecast predates the current data vintage and does not say whether it is nominal or real.
Lease accounting adds a wrinkle. Microsoft is extending data center useful lives from 15 to 25 years, moving more leases from finance to operating and cutting its calendar 2026 capex guidance to about $175bn with underlying investment unchanged. A building a developer constructs and Microsoft leases appears in Census as construction but may not appear in Microsoft's capex.
Company Filings
Alphabet, Amazon and Meta Spending on Property and Equipment, Q2 2025 vs Q2 2026
Purchases of property and equipment from each company's second-quarter 2026 results release, in billions of US dollars. These cover servers, non-data-center property and sites abroad, which is why they dwarf Census's building-only series.
Alphabet and Meta report purchases of property and equipment on the cash flow statement; Amazon's is gross cash purchases. Meta's headline capex including finance-lease principal was $31.08bn for Q2 2026. Microsoft is excluded because it reports capex including finance leases on a different basis: $41bn for April to June 2026.
Counter-Case · Financing
Who Pays? Negative Cash Flow, New Debt and an $800bn Gap
The strain shows in cash flow. Alphabet's second-quarter free cash flow was -$5.9bn: $39.1bn of operating cash flow against $44.9bn of purchases of property and equipment. It raised $49.6bn of net equity in June 2026, with proceeds earmarked, among other uses, for capital expenditures to scale AI infrastructure. Amazon's trailing-twelve-month free cash flow is -$7.6bn, down from +$18.2bn a year earlier.
Regulators are naming the risk. On 30 September 2026 the Bank of England's Financial Policy Committee said the rapid increase in AI-related debt issuance had raised capital markets' exposure to AI. Morgan Stanley put global AI-related issuance at about $450bn by early September, double 2025's, according to reports. After July's sharp falls in AI and semiconductor stocks, the committee warned, a more significant shock could trigger a sharper repricing.
The revenue side is a projection. Bain & Company's 2025 technology report says $2tn of annual revenue would be needed by 2030 to fund the computing power AI demand implies, and that even with AI-related savings the world is $800bn short. None of this points to a stop in the Census series; it points to who carries the cost if revenue arrives late.
Counter-Case · Demand
What the Bulls Argue: Full Buildings and Preleased Space
Brokers see demand, not a bubble. JLL's midyear 2026 report says concern about a potential bubble "should be viewed in the context of 99% occupancy, particularly when the largest data center tenants rank among the world's most profitable and highest-rated companies." It reports 1% vacancy for the third consecutive year and says most tenants securing space today are contracting for 2028 deliveries.
CBRE's first-half 2026 data agree. Vacancy held at 1.4% across primary markets, and more than 80% of capacity under construction is already preleased, up from 74.3% a year earlier. The two brokers measure different universes, which explains 1% against 1.4%. Tenants signing before buildings finish is not what speculative overbuilding looks like today; the open question is whether those tenants can keep paying.
All 46 Months
Every Month of Both Windows, Side by Side, in August 2026 Dollars
Monthly US private data center construction spending, with the Before AI and After AI windows aligned by month number. The last column divides the After figure by the Before figure for the same month number, from 1.50x at the start to 6.25x at month 46.
1
Jan 2019
0.83
Nov 2022
1.25
1.50x
2
Feb 2019
0.81
Dec 2022
1.29
1.59x
3
Mar 2019
0.81
Jan 2023
1.39
1.72x
4
Apr 2019
0.84
Feb 2023
1.52
1.80x
5
May 2019
1.01
Mar 2023
1.61
1.60x
6
Jun 2019
1.04
Apr 2023
1.66
1.60x
7
Jul 2019
1.01
May 2023
1.70
1.68x
8
Aug 2019
1.00
Jun 2023
1.75
1.76x
9
Sep 2019
0.93
Jul 2023
1.87
2.01x
10
Oct 2019
0.98
Aug 2023
1.98
2.01x
11
Nov 2019
1.00
Sep 2023
2.02
2.02x
12
Dec 2019
0.83
Oct 2023
2.17
2.62x
Showing 1-12 of 46
Page 1 of 4
Download this data (CSV)Source data: US Census Bureau and BLS, US government statistics; inflation adjustment by FactsFigs
Value put in place by privately owned data center projects, not seasonally adjusted, deflated with CPI-U (FRED CPIAUCSL) to August 2026 dollars. August 2026 is preliminary and June and July 2026 are revised. October 2025 CPI was never published and is interpolated.
Method
How the Figures Were Built, and Where They Could Shift
Census measures value put in place, the work done in a month. It is a voluntary survey of owners, nonrespondents are imputed, and private nonresidential estimates are increased by 25% to cover projects missing from the sample frame. The series used here is not seasonally adjusted, so it shows actual monthly spend.
Inflation Basis · CPI in August 2026 Dollars
Every dollar figure is deflated with the consumer price index (FRED CPIAUCSL) into August 2026 dollars, so the comparison does not partly measure the 2021 to 2023 inflation spike. BLS never published October 2025 CPI because of a lapse in appropriations, so that month is interpolated as the geometric mean of September and November 2025 and flagged in the data.
A construction-cost index, an equal-weighted blend of BLS producer prices for new industrial and new warehouse building, would shrink the Before window's growth to 1.15x instead of 1.45x, because building costs rose about 48% over it against about 18% for CPI. The headline holds either way: 5.41x against 5.01x from November 2022 to June 2026, matching Our World in Data's five-fold finding.
August 2026 is preliminary and June and July are revised, so the last three points can still move. Census revises this series, and the current vintage sits well above the figures quoted in earlier reporting, so numbers from older articles should not be compared with it. We could not find a Census note dating that revision, so we do not attribute it to a particular release.
Verdict
What 46 Months Each Can and Cannot Show
What the data settles: US data center buildings have gone up far faster in the latest 46 months than in the 46 before, 3.37x in total, and much of that is a recent surge, with the final ten months exceeding the whole earlier window. The buildout was already growing, and AI demand is the explanation owners now give for the later acceleration.
What it does not settle: how much of the building is AI, how much of AI spending the buildings represent, or whether the climb continues. The buildings are about a third of a modelled AI site's bill, Census cannot split AI from cloud, and the financing evidence puts the risk in who pays rather than who rents. The next Census releases, which revise August's preliminary figure, are the cleanest test.
The data behind this story comes from the US Census Bureau's Value of Private Construction Put in Place, data center category, not seasonally adjusted, deflated with the consumer price index published by the Bureau of Labor Statistics via FRED. Both are US government statistics, and full credit for collecting and maintaining them goes to the Census Bureau and the Bureau of Labor Statistics. The framing follows Edouard Mathieu's 1 September 2026 insight at Our World in Data.
FactsFigs reviews, cleans, and cross-checks every source dataset before shaping it into a data story. Each visualization is created and designed in FactsFigs Design Studio — an internal tool developed and owned by FactsFigs — and is the original work of a FactsFigs author, not an AI-generated copy of any existing graphic. Individual assets within a visual may or may not be produced with AI tools, but the design of the visual itself is solely FactsFigs' own.
Figures are estimates at the time of publication, provided for information only — nothing here is financial advice or a guarantee of accuracy.
Last verified: 5 Oct 2026
The charts in this article were built with our own publishing system. See what it does →