TL;DR: Which Age Group Worries Most About AI Taking Their Jobs?
US working adults asked whether their type of work could be automated in their lifetime
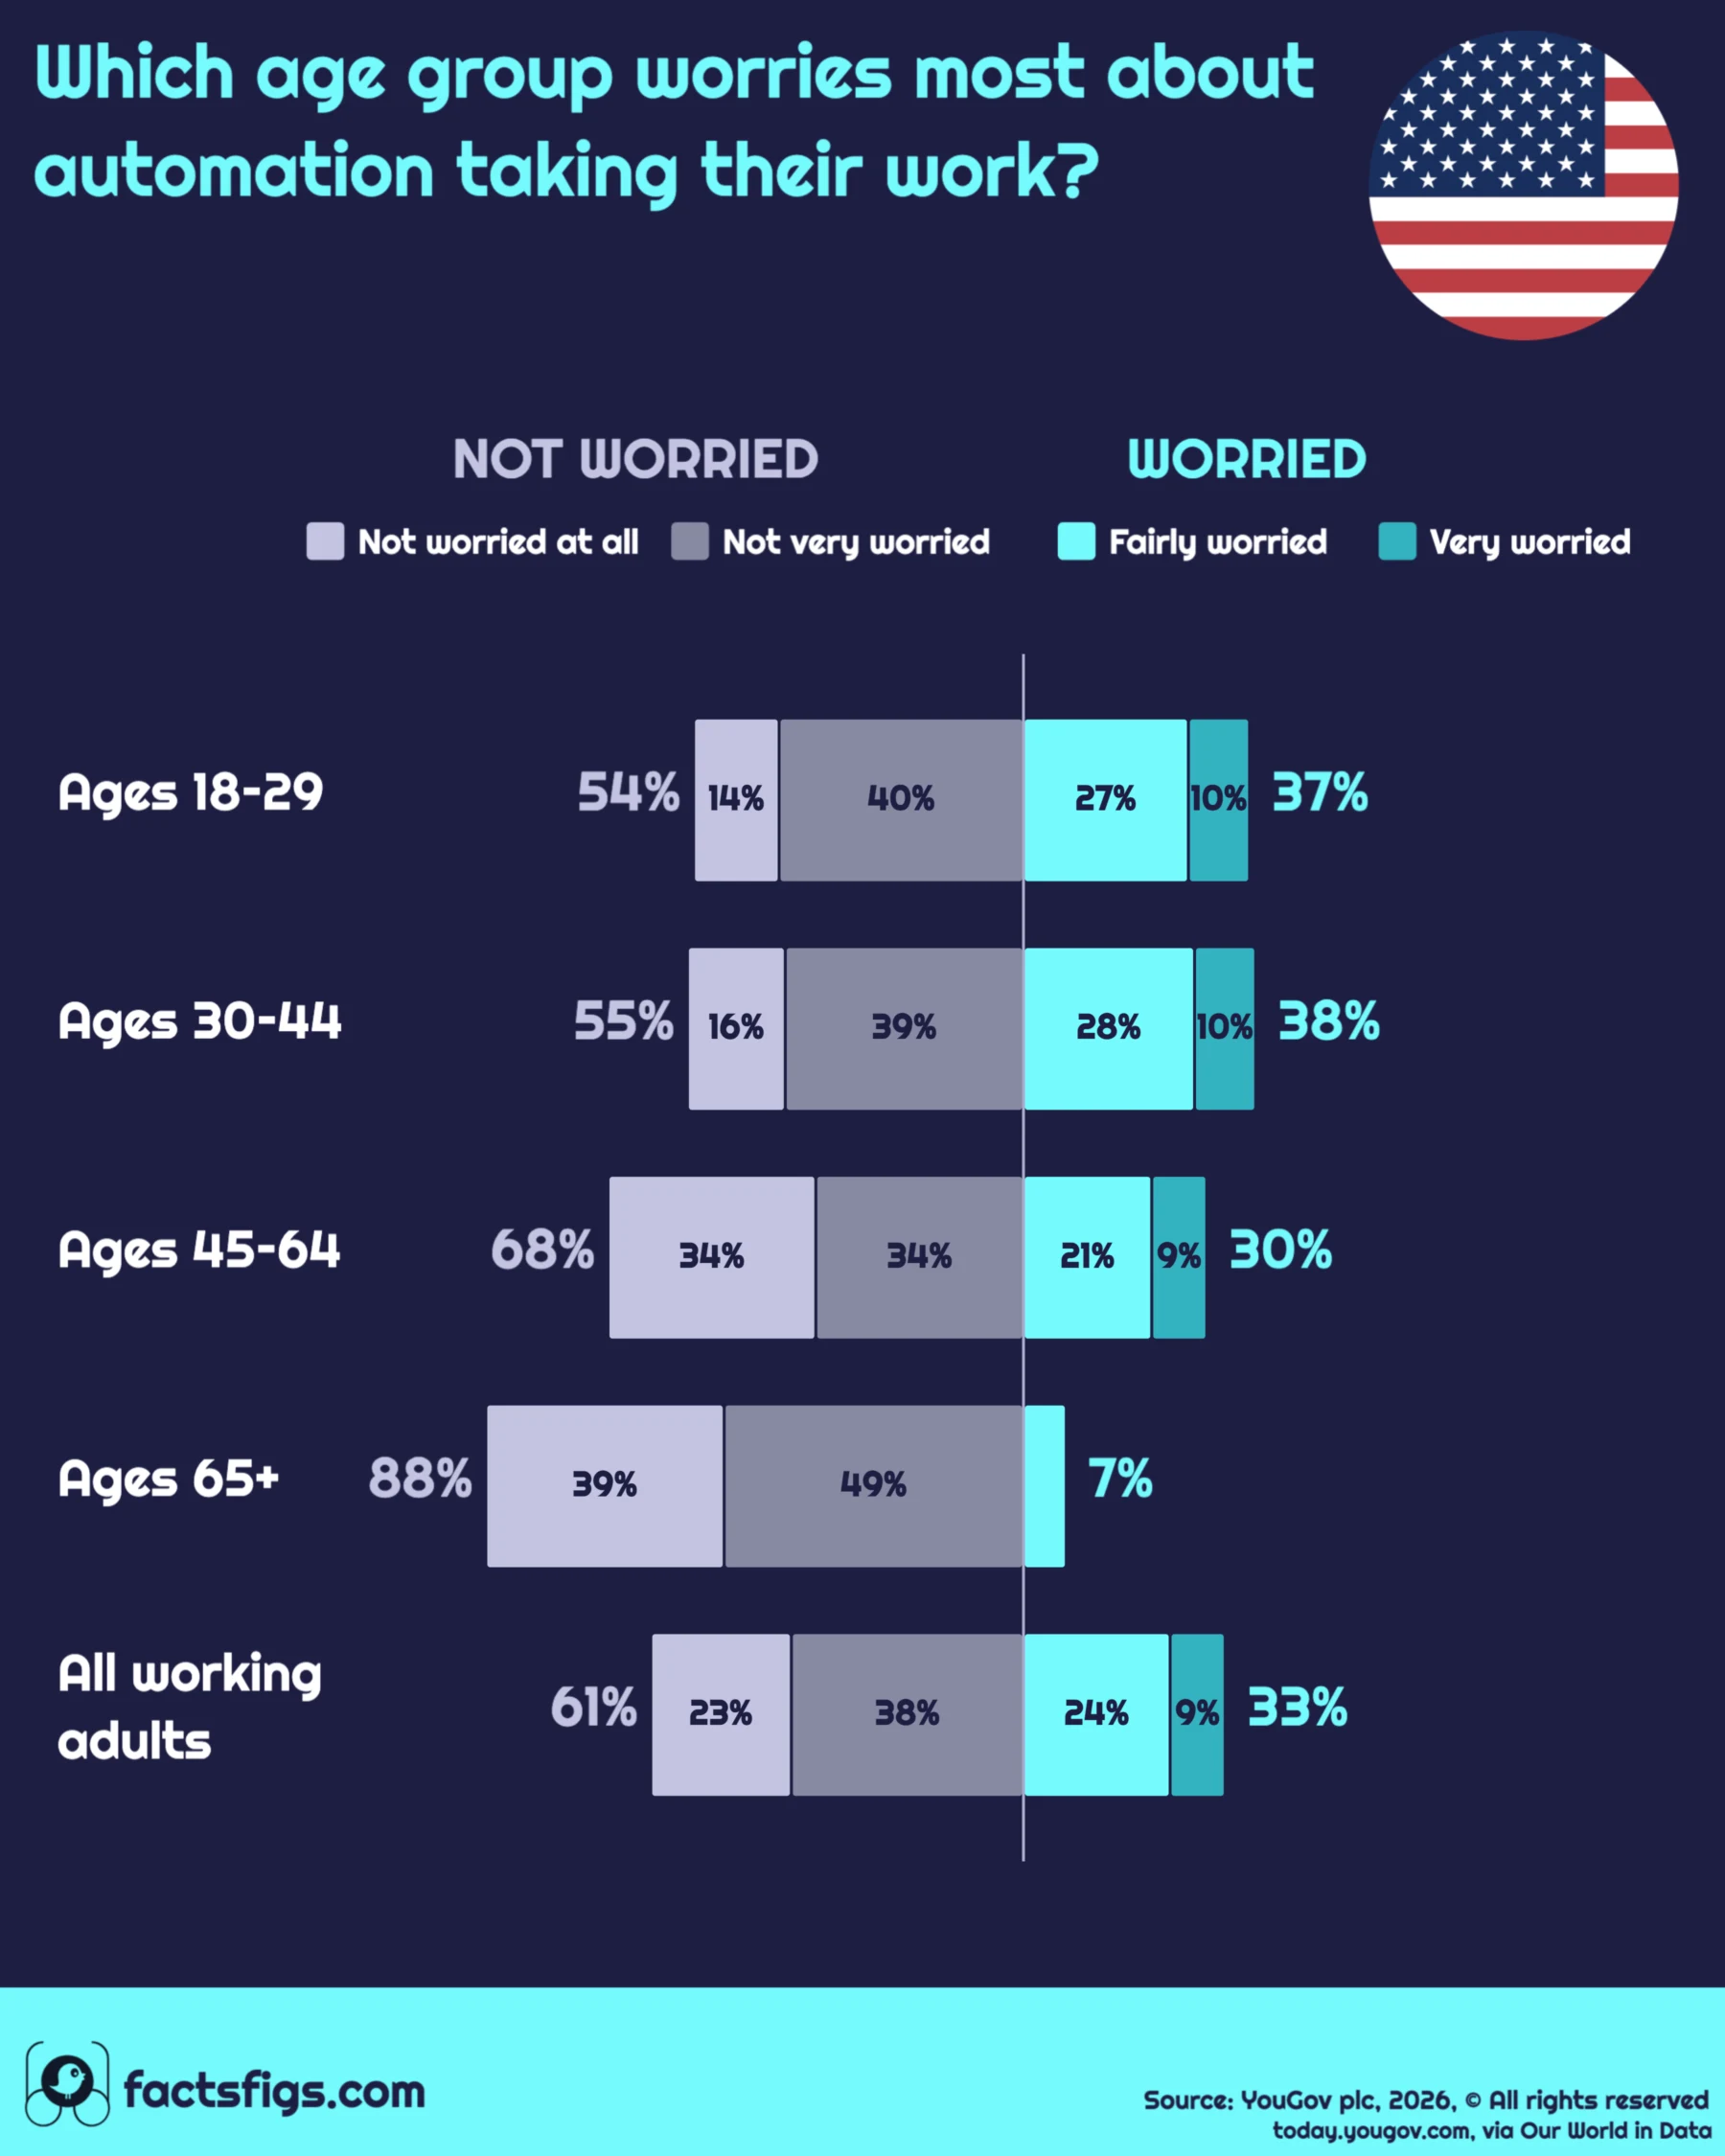
Workers under 45 are the most worried. In YouGov's January 2026 survey, 38% of those aged 30 to 44 and 37% of those aged 18 to 29 said they were very or fairly worried that their type of work could be automated within their lifetime. Workers over 65 are the least worried by a wide margin, at 7%.
The question asks about automation in general, not AI by name. The top two groups have swapped places seven times in eleven surveys, so they are best read as a tie.
! What Sets the Age Groups Apart:
•
Under-45s Are a Tie:18 to 29 led in 7 of 11 waves and 30 to 44 in 4. Their five-year averages are 37.2% and 36.3%.
•
Over-65s Are Clearly Last:Lowest in 10 of 11 waves since January 2021. 0% of over-65s said "very worried" in January 2026.
•
45 to 64 Is Catching Up:Worry in this group rose from 12% in January 2021 to 30% in January 2026.
•
Overall Worry Has Plateaued:One in three working adults is worried, a level that has held between 31% and 33% since January 2023.
? The Numbers Behind the Story:
•
Worried, ages 30 to 44:38%
•
Worried, ages 18 to 29:37%
•
Worried, ages 45 to 64:30% (12% in Jan 2021)
•
Worried, ages 65 and over:7%
Age divides this question far more sharply than gender, the only other split in the data: the gap between the under-45s and the over-65s is about 30 points, while men and women differ by less than 4.
Continue reading below for the full detailed article →
Overview
What the Survey Asked, and What It Did Not
Twice a year, in January and July, YouGov asks US working adults one question: "How worried, if at all, are you that your type of work could be automated within your lifetime?" The answers are weighted to match the US population by age, gender, race, education, region, party and income. Each wave reaches between 460 and 568 working adults. The question never mentions AI, so the figures measure worry about automation of any kind. Our World in Data republishes the tracker under the heading of AI and jobs, and the chart above uses the January 2026 wave, the latest it carries.
The Three Numbers That Split Workers by Age
Three figures from the January 2026 wave carry the story: the most worried group, the least worried group and the group whose worry has moved furthest since the tracker began in 2021.
38% of Workers Aged 30 to 44 Are Worried
38%
In January 2026, 10% of workers aged 30 to 44 said they were very worried and 28% fairly worried that their type of work could be automated within their lifetime. That edges the 18 to 29 group by a single point, a gap well inside the noise of a survey that reaches only about 500 working adults in each wave.
Only 7% of Workers Over 65 Are Worried
7%
Workers over 65 are the least worried group in ten of the eleven survey waves since January 2021. In January 2026, 0% said they were very worried, 7% were fairly worried and 88% were not very or not at all worried. The group is small, so its exact share swings from one wave to the next.
Worry at 45 to 64 Rose From 12% to 30%
30%
In January 2021 only 12% of workers aged 45 to 64 were worried their work could be automated. By January 2026 that had reached 30%, and the share not worried at all had dropped from 49% to 34%. No other age group moved as far in the same five years, and the latest wave is the group's highest.
Ages 30 to 44 by the Numbers
Very worried 10% Tied with 18 to 29 for the highest "very worried" share of any age group in January 2026.
Fairly worried 28% The largest "fairly worried" share of the four age groups, one point above 18 to 29.
Not worried at all 16% Less than half the 34% of 45 to 64 year olds who said the same.
The Most Worried
Are Younger Workers More Worried About AI Taking Their Jobs?
Yes, but not only the youngest. In January 2026, 37% of workers aged 18 to 29 and 38% of those aged 30 to 44 were very or fairly worried that their type of work could be automated within their lifetime. Both groups put 10% in the "very worried" column, and the difference sits entirely in the "fairly worried" answers, 27% against 28%.
Over eleven waves the lead has changed hands seven times. The 18 to 29 group came out ahead in seven waves and the 30 to 44 group in four, and their averages since January 2021 are 37.2% and 36.3%. The youngest group also swings harder, from a low of 23% in January 2022 to a high of 47% in January 2024. With roughly 500 working adults per wave split across four age groups, a one-point gap says nothing about which group is really more worried.
What does separate the under-45s from older workers is how few of them dismiss the idea outright. Only 14% of 18 to 29 year olds and 16% of 30 to 44 year olds said they were not worried at all, against 34% of 45 to 64 year olds. Younger workers were also the least sure, with 9% of 18 to 29 year olds answering "don't know", the highest of any group.
The Least Worried
Why Workers Over 65 Barely Worry About Automation
Workers over 65 are the least worried group in ten of the eleven waves. The one exception, January 2021, had them at 13% against 12% for the 45 to 64 group. In January 2026, 7% of over-65s were fairly worried, 0% were very worried, and 88% said they were not very or not at all worried.
The question itself offers one reading. It asks about automation "within your lifetime", and a worker over 65 has fewer working years left for it to happen in. YouGov does not ask respondents for their reasons, so that is a reading of the wording, not a finding of the survey.
The exact figure for this group deserves less trust than its rank. Working adults over 65 are a small slice of each sample, and their worried share has bounced between 0% in January 2025 and 14.1% in July 2025. The share not worried at all fell from 69.7% in July 2025 to 39% in January 2026, a move too large to read as a real shift in opinion in six months.
The Fastest Riser
How Workers Aged 45 to 64 Caught Up Since 2021
The biggest change in the tracker is not among the young. In January 2021, 12% of workers aged 45 to 64 were very or fairly worried their work could be automated, the lowest figure of any group that wave. By January 2026 it was 30%, more than double, and within eight points of the under-45s.
The rise shows at both ends of the scale. "Very worried" climbed from 4% to 9%, and the share not worried at all fell from 49% to 34%. Unlike the over-65s, this group moved in one direction for most of the period: it has been at 20% or higher in every wave since July 2023.
The survey cannot say why. YouGov's question asks about automation in general and records no reasons, so the rise cannot be pinned on any one technology. What the data does show is that the age gap is narrowing from the middle rather than from either end.
Across all working adults, worry rose from 23% in January 2021 to 33% in January 2023 and then stopped climbing. In the seven waves since, the worried share has stayed between 31% and 33%. One in three working Americans is worried about automation; two in three are not.
The early rise was steepest among the under-45s, who both reached 44% or more in January 2023. Since then the overall plateau has hidden two opposite movements: the 45 to 64 group still rising, and the youngest group falling back from its January 2024 peak of 47% to 37%.
Gender barely matters by comparison. In January 2026, 34.7% of working men and 31% of working women were worried, a gap of under four points against about thirty between the under-45s and the over-65s. On this question, age is the line that divides workers.
Share of each group giving each answer to YouGov's question on whether their type of work could be automated within their lifetime. Sort any column to reorder the rows.
Our World in Data counts this tracker among the few sources that ask the same question of the same population over time, which is what makes the five-year comparison possible. It covers working adults in the United States only, so retirees and people out of work are not in the figures.
Each wave reaches between 460 and 568 people before they are split by age. Differences of a few points between age groups, or between one wave and the next, are within the range a sample this size produces by chance. The ranking at the extremes is solid; the exact percentages for small groups are not.
The question asks about automation, not AI. Respondents may have pictured software, robots or anything else that replaces work, and the survey does not record which. It also measures worry, not risk: a group that worries less is not shown to be safer, only less concerned.
FactsFigs reviews, cleans, and cross-checks every source dataset before shaping it into a data story. Each visualization is created and designed in FactsFigs Design Studio, an internal tool developed and owned by FactsFigs, and is the original work of a FactsFigs author, not an AI-generated copy of any existing graphic. Individual assets within a visual may or may not be produced with AI tools, but the design of the visual itself is solely FactsFigs' own.
Figures are estimates at the time of publication, provided for information only; nothing here is financial advice or a guarantee of accuracy.
Last verified: 11 Nov 2026
The charts in this article were built with our own publishing system. See what it does →