TL;DR — Who Leads AI Infrastructure Investment, Measured by Capex?
Cash capex of five companies over their two latest complete fiscal years
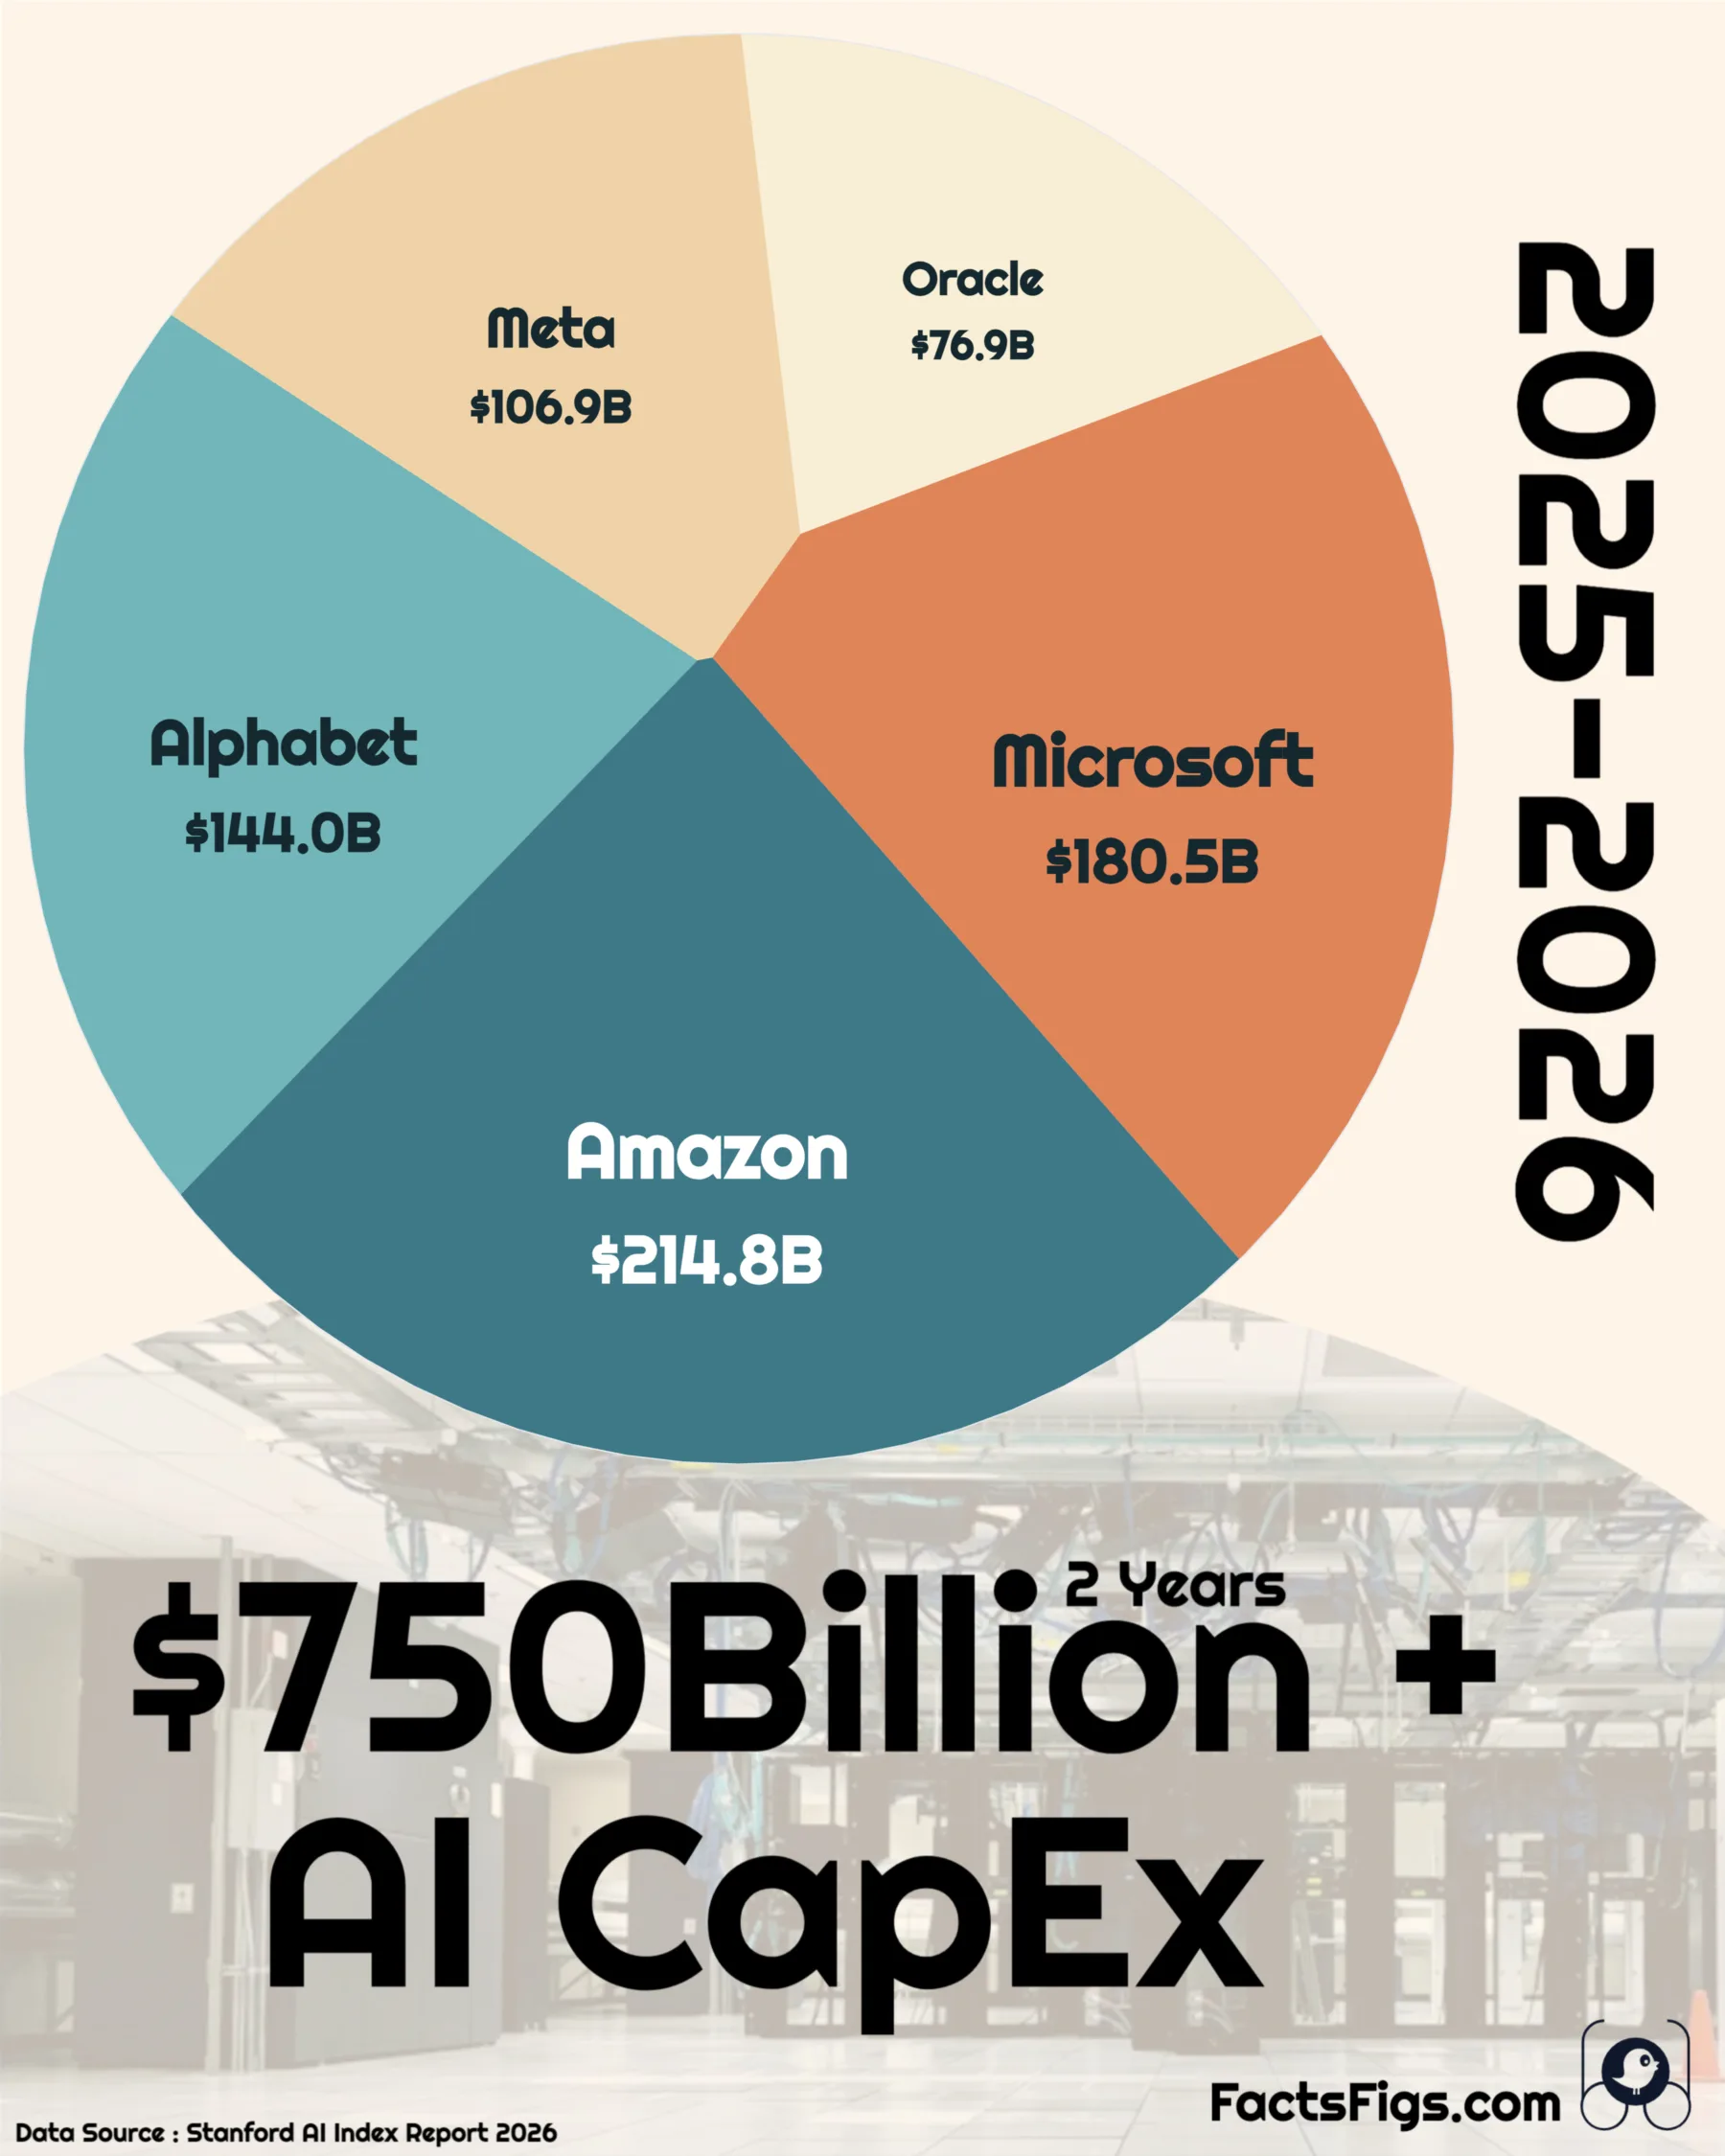
Amazon, Microsoft, Alphabet, Meta and Oracle reported $723.1B of cash capital expenditure over their two most recent complete fiscal years, with Amazon at $214.8B (29.7%) and Oracle at $76.9B (10.6%). Four of the five fall between $106.9B and $214.8B, and the largest total is under 3x the smallest.
None of the five says how much of that is AI, so the total is the closest filed proxy for AI infrastructure investment, not a measure of it. Microsoft overtakes Amazon once finance leases are counted, and Alphabet overtakes Microsoft on aligned calendar windows.
! Five Caveats Behind the Ranking:
•
Capex Is Not AI Spending:No company breaks out AI. Amazon's filing shows AWS took 65.7% of its 2024–25 property additions, so about a third is not cloud at all.
•
Leases Swap the Top Two:Microsoft added $45.1B of finance-lease assets outside capex. Counting them, it leads at 28.8% and Amazon falls to 27.9%.
•
Fiscal Years Do Not Align:Microsoft's window ends 30 June 2026 and Oracle's 31 May 2026, against 31 December 2025 for the other three.
•
Alphabet Is Second on Calendar Windows:On calendar 2024–25 or the 24 months to June 2026, Alphabet ranks second and Microsoft third.
•
Oracle Is Growth, Not Size:Oracle's capex rose 2.62x in a year, and its first quarter of FY2027 alone reached $28.5B.
? The Numbers Behind the Story:
•
Combined two-year capex, five companies:$723.1B
•
Amazon, FY2024 plus FY2025:$214.8B
•
Oracle, FY2025 plus FY2026:$76.9B
•
Combined growth, fiscal 2022 to latest year:3.0x ($154.7B to $464.6B)
The five budgets add up to a number no filing labels as AI, and the order of the top two depends on which defensible definition you pick. Read the ranking as four comparable giants and a fast-rising Oracle.
Continue reading below for the full detailed article →
Overview
What $723.1B of Capex Counts, and What It Skips
The $723.1B total is cash capital expenditure: the cash-flow line for purchases of property and equipment, summed over each company's two most recent complete fiscal years and read from SEC filings. It covers servers, network gear, data centers and land, plus offices and, at Amazon, fulfilment sites and satellites. No filing labels any of it as AI, so the figure is the closest filed proxy for AI infrastructure investment rather than a measurement of it. Leases signed but not yet started, announced programs and forward guidance sit outside the total and are kept apart below.
The Three Numbers That Frame Five Capex Budgets
Three figures carry the story: the combined filed total, how far it has climbed since ChatGPT launched, and the finance-lease gap that decides who is first. Each comes from SEC filings, and none of them is an AI-only number.
$723.1B of Capex From Five Companies
$723.1B
Amazon, Microsoft, Alphabet, Meta and Oracle reported $723.1B of cash capital expenditure across their two most recent complete fiscal years. Amazon contributes 29.7% and Oracle 10.6%, so the largest total is under 3x the smallest. The sum comes from each company's cash-flow statement, not from AI disclosures, because none of the five reports AI infrastructure as a line item.
Combined Capex Is 3.0x Its Fiscal 2022 Level
3.0x
In each company's 2022 fiscal year the five spent $154.7B; in their latest complete years they spent $464.6B. Oracle rose 12.3x and Microsoft 4.85x, while Amazon, the largest spender, grew 2.07x. The comparison spans three to four fiscal years depending on the company, so it describes scale rather than an annual growth rate.
Microsoft Added $45.1B in Finance Leases
$45.1B
Finance leases sit outside filed capex, and Microsoft took $45.1B of data-center capacity that way over FY2025 and FY2026, a quarter on top of its $180.5B. The other four added under $8B each. Counting those leases, Microsoft leads at 28.8% and Amazon falls to 27.9%, so the top two swap places.
Amazon by the Numbers
FY2024 capex $83.0B Gross purchases of property and equipment in calendar 2024, the first year of Amazon's window.
FY2025 capex $131.8B A 1.59x rise in one year, taking the two-year total to $214.8B and a 29.7% share.
AWS share of additions 65.7% AWS's share of Amazon's 2024–25 net property additions; the rest went to fulfilment, transport, stores, offices and satellites.
All Five Companies' Capex by Fiscal Year, Ranked by Total
Gross cash purchases of property and equipment from each company's annual report, in US$ billions, with the year-end that sets each window. Shares are of the $723.1B combined total.
1
Amazon
FY2024 + FY2025
31 Dec
83.0
131.8
214.8
29.7%
2
Microsoft
FY2025 + FY2026
30 Jun
64.6
115.9
180.5
25.0%
3
Alphabet
FY2024 + FY2025
31 Dec
52.5
91.4
144.0
19.9%
4
Meta
FY2024 + FY2025
31 Dec
37.3
69.7
106.9
14.8%
5
Oracle
FY2025 + FY2026
31 May
21.2
55.7
76.9
10.6%
Download this data (CSV)SEC EDGAR filings, US government records in the public domain; totals and shares calculated by FactsFigs
Totals and shares are computed before rounding, so Alphabet's years (52.5 + 91.4) show 143.9 against a 144.0 total and Meta's (37.3 + 69.7) show 107.0 against 106.9. Amazon's figure is gross purchases; its own net-of-proceeds measure gives $206.0B.
Capex vs AI
Why Capex Is Not the Same as AI Spending
The filings do not break out AI. Microsoft's 10-K says it will keep investing in capital expenditures "to support growth in our cloud offerings and our investments in AI training and other infrastructure." Alphabet describes its capex as "primarily" technical infrastructure, Meta's as servers, data centers and network infrastructure, and Oracle's jump as "primarily due to the expansion of our data centers." None gives an AI share.
Amazon is the only one of the five with a filed segment split, and it shows how much is not AI. AWS took $149.8B of Amazon's $228.1B in net property additions across 2024 and 2025, or 65.7%, on an accrual basis. The rest went to North America, International and corporate: the fulfilment network, transport, stores, offices and satellites.
Applied to Amazon's $214.8B cash total, that remaining third is about $74B, roughly 10% of the $723.1B. It is FactsFigs arithmetic across two accounting bases, so read it as a floor for spending that is not data-center cloud. AWS itself is all cloud, not only AI, so the AI share of Amazon's capex cannot be computed from the filing.
The only outside estimate we found is CreditSights, which wrote on 10 November 2025 that about 75% of aggregate hyperscaler capex in 2026 would be for AI infrastructure. It is a single source and a forecast for 2026, and the text we could read states no method, so it is not applied to the filed 2024 to 2026 totals here. We found no second estimate of an AI share.
Retail Meets Cloud
Why Amazon Leads: Part Cloud, Part Retail Network
Amazon's $214.8B is gross: $83.0B in 2024 and $131.8B in 2025, a 1.59x rise. Amazon also reports its own cash capex measure, net of proceeds from asset sales and incentives, at $77.7B and $128.3B, or $206.0B in all. On that definition its share is 28.8% rather than 29.7%, and the other four companies are unchanged. The ranking uses gross purchases because that matches the cash-flow line taken for the other four.
Management describes the spending as mainly "technology infrastructure (the majority of which is to support AWS business growth)" and added capacity for the fulfillment network, so the figure mixes cloud buildout with a retailer's logistics.
Finance Leases
Why Microsoft Leads Once Finance Leases Count
Microsoft takes a large share of its data-center capacity on finance leases, and those do not pass through the cash-flow line used for the ranking. The right-of-use assets it obtained were $20.5B in FY2025 and $24.6B in FY2026, $45.1B in all. That is 25.0% on top of its $180.5B, against $7.9B at Oracle, $3.8B at Amazon, $1.9B at Alphabet and $0.8B at Meta.
Add those assets to each company's total and Microsoft leads with $225.6B (28.8%) while Amazon falls to $218.6B (27.9%). Alphabet at $145.9B, Meta at $107.7B and Oracle at $84.7B keep their places. The lease-inclusive version mixes accrual and cash and is not the capex any company reports, so treat it as an indicator of direction and size.
We chose cash capex for the ranking because one rule treats all five the same, and it is the line the filings report. But the top two swap under the other defensible definition, so "Amazon leads" is a statement about cash. Companies draw the line differently themselves: Meta's own headline adds finance-lease principal, reaching $111.4B against $106.9B here.
Fiscal Years
Why Microsoft's Second Place Depends on Its Fiscal Year
The five windows cover different months. Amazon, Alphabet and Meta run January 2024 to December 2025, Oracle's runs June 2024 to May 2026 and Microsoft's July 2024 to June 2026. Capex rose 1.6x to 1.9x a year at four of the five and 2.6x at Oracle, so later windows are bigger, which flatters Microsoft and Oracle against the December filers.
Put everyone on calendar 2024 and 2025 and Alphabet is second at $144.0B, Microsoft third at $138.6B, and Oracle falls to $46.2B on its nearest quarter-ends, December 2023 to November 2025. Amazon's share rises from 29.7% to 33.0% and Microsoft's drops from 25.0% to 21.3%.
Take the 24 months to 30 June 2026 instead and Amazon reaches $280.7B, Alphabet $199.4B, Microsoft $180.5B, Meta $141.5B and Oracle $76.9B. Amazon first, Meta fourth and Oracle fifth hold in every scenario; only positions two and three flip. "Microsoft is second" is true only on fiscal-year windows, which is why each year-end is printed above.
Four Definitions
How the Ranking Moves Under Four Windows and Definitions
Two-year capex in US$ billions, with rank in brackets, for the same five companies measured four ways. Only the last column departs from cash purchases.
Amazon
214.8 (#1)
214.8 (#1)
280.7 (#1)
218.6 (#2)
Microsoft
180.5 (#2)
138.6 (#3)
180.5 (#3)
225.6 (#1)
Alphabet
144.0 (#3)
144.0 (#2)
199.4 (#2)
145.9 (#3)
Meta
106.9 (#4)
106.9 (#4)
141.5 (#4)
107.7 (#4)
Oracle
76.9 (#5)
46.2 (#5)
76.9 (#5)
84.7 (#5)
Five combined
723.1
650.6
878.9
782.6
Download this data (CSV)Calculated by FactsFigs from SEC annual and quarterly filings, US government records in the public domain
Calendar and 24-month windows are built from quarterly filings. Oracle's calendar window runs December 2023 to November 2025 and its 24-month window June 2024 to May 2026, each one month off. Finance-lease assets are non-cash right-of-use assets obtained, an accrual-type measure, added to the fiscal-year totals. Totals are computed before rounding.
Growth, Not Size
Why Oracle's Smallest Slice Is the Fastest-Growing
Oracle's $76.9B is the smallest total, but its capex went from $21.2B in FY2025 to $55.7B in FY2026, a 2.62x jump in a year. FY2024 was $6.9B, so the latest year is 8.1x that, and 12.3x FY2022's $4.5B. Its first quarter of FY2027, June to August 2026, reached $28.5B on its own, equal to 37% of the whole two-year total, though it falls after the window.
The spending outran the cash. FY2026 operating cash flow of $32.0B against $55.7B of capex left free cash flow of about -$23.7B, a figure derived from the 10-K. In the same year the cash-flow statement shows $46.1B of proceeds from new senior notes and other borrowings, against $6.9B repaid, and $5.0B from mandatory convertible preferred stock.
The larger commitment sits off the ranking. Oracle reports $260B of additional lease commitments not yet started, substantially all data centers, due to commence from the first quarter of FY2027 to FY2029 on terms of 15 to 19 years. That is 3.4x its two-year capex, which is why Oracle is the extreme case of the lease caveat.
Since ChatGPT
How Five Budgets Grew 3.0x Since ChatGPT
Against each company's fiscal 2022 the five spent $154.7B; in their latest complete years they spent $464.6B, 3.0x as much. Fiscal 2022 is the year that includes ChatGPT's 30 November 2022 launch for the three December filers, and the year to mid-2022 for Microsoft and Oracle. Oracle grew 12.3x ($4.5B to $55.7B), Microsoft 4.85x ($23.9B to $115.9B), Alphabet 2.90x ($31.5B to $91.4B), Meta 2.23x ($31.2B to $69.7B) and Amazon 2.07x ($63.6B to $131.8B).
Read it as scale, not a growth rate. The baselines sit three to four years before the latest year, and the climb was not smooth: Amazon fell to $52.7B in 2023, Meta to $27.0B, and Oracle dipped to $6.9B in FY2024 before its jump. The buildings that house this equipment are a separate measure, covered in our analysis of US Census construction data.
Leases signed but not yet started dwarf the ranking. At each company's latest year-end, undiscounted payments came to $329.1B at Microsoft (commencing FY2027 to FY2033), $260B at Oracle, $103.8B at Meta (2026 to 2030), $96.4B at Amazon and $58.5B at Alphabet, mostly for data centers. Operating and finance leases are not split, only finance leases would count as capex, and the dates differ, so we do not add them up. Meta reports a further $131.05B of other commitments, mostly third-party cloud capacity.
Announcements are intentions, not filings. The Stargate Project, announced on 21 January 2025 by OpenAI, SoftBank, Oracle and MGX, intends to invest $500B over four years in US AI infrastructure and to begin deploying $100B immediately. It is its own company, and Oracle is an equity funder and technology partner, so Stargate's spending is not Oracle's capex.
Google said in November 2025 it would invest $40B in three Texas data centers through 2027, and Microsoft announced $17.5B for India over 2026 to 2029, covering data centers, AI infrastructure and skilling. Whatever the companies build under such plans reaches the filings as capex or leases when it happens, so adding announcements to the ranking would risk counting the same money twice.
A Widely Cited Figure
Why We Use Filings, Not Headline Capex Charts
Capex headlines often rest on estimates. Stanford's AI Index 2026 gives a 2025 capex figure for Google that is more than 60% above what Alphabet's own 10-K shows: "we spent $52.5 billion and $91.4 billion on capital expenditures" in 2024 and 2025. Adding finance-lease assets lifts 2025 only to $93.1B, and even the twelve months to June 2026 come to $132.4B.
The Index's sentence cites a chart labelled as Citi Research, with 2025 and 2026 marked as estimates, which suggests a projection was quoted as a reported figure. That is our inference, and we found no erratum. The lesson for any capex ranking is to name the basis: here it is filed cash purchases of property and equipment, with nothing forecast.
Verdict
What the Capex Ranking Can and Cannot Settle
What it settles: on filed cash capex, Amazon leads at $214.8B, Oracle is smallest at $76.9B, and the other three sit between $106.9B and $180.5B. Amazon first, Meta fourth and Oracle fifth hold under every window and definition we tested, and the five together are spending about 3.0x what they did in fiscal 2022.
What it does not settle: how much of the $723.1B is AI, whether Amazon or Microsoft is first, and whether Microsoft or Alphabet is second. Those answers move with finance leases and fiscal years, and they will move again when the December filers publish fiscal 2026 around January and February 2027.
The data behind this story comes from the annual reports (Form 10-K) of Amazon, Microsoft, Alphabet, Meta and Oracle, via the SEC's EDGAR financial-data service. The filings are US government records in the public domain, and full credit for collecting and maintaining them goes to the SEC and to the filing companies.
FactsFigs reviews, cleans, and cross-checks every source dataset before shaping it into a data story. Each visualization is created and designed in FactsFigs Design Studio — an internal tool developed and owned by FactsFigs — and is the original work of a FactsFigs author, not an AI-generated copy of any existing graphic. Individual assets within a visual may or may not be produced with AI tools, but the design of the visual itself is solely FactsFigs' own.
Figures are estimates at the time of publication, provided for information only — nothing here is financial advice or a guarantee of accuracy.
Last verified: 7 Oct 2026
The charts in this article were built with our own publishing system. See what it does →