TL;DR: Which Country Supplies the Most US Crude Oil?
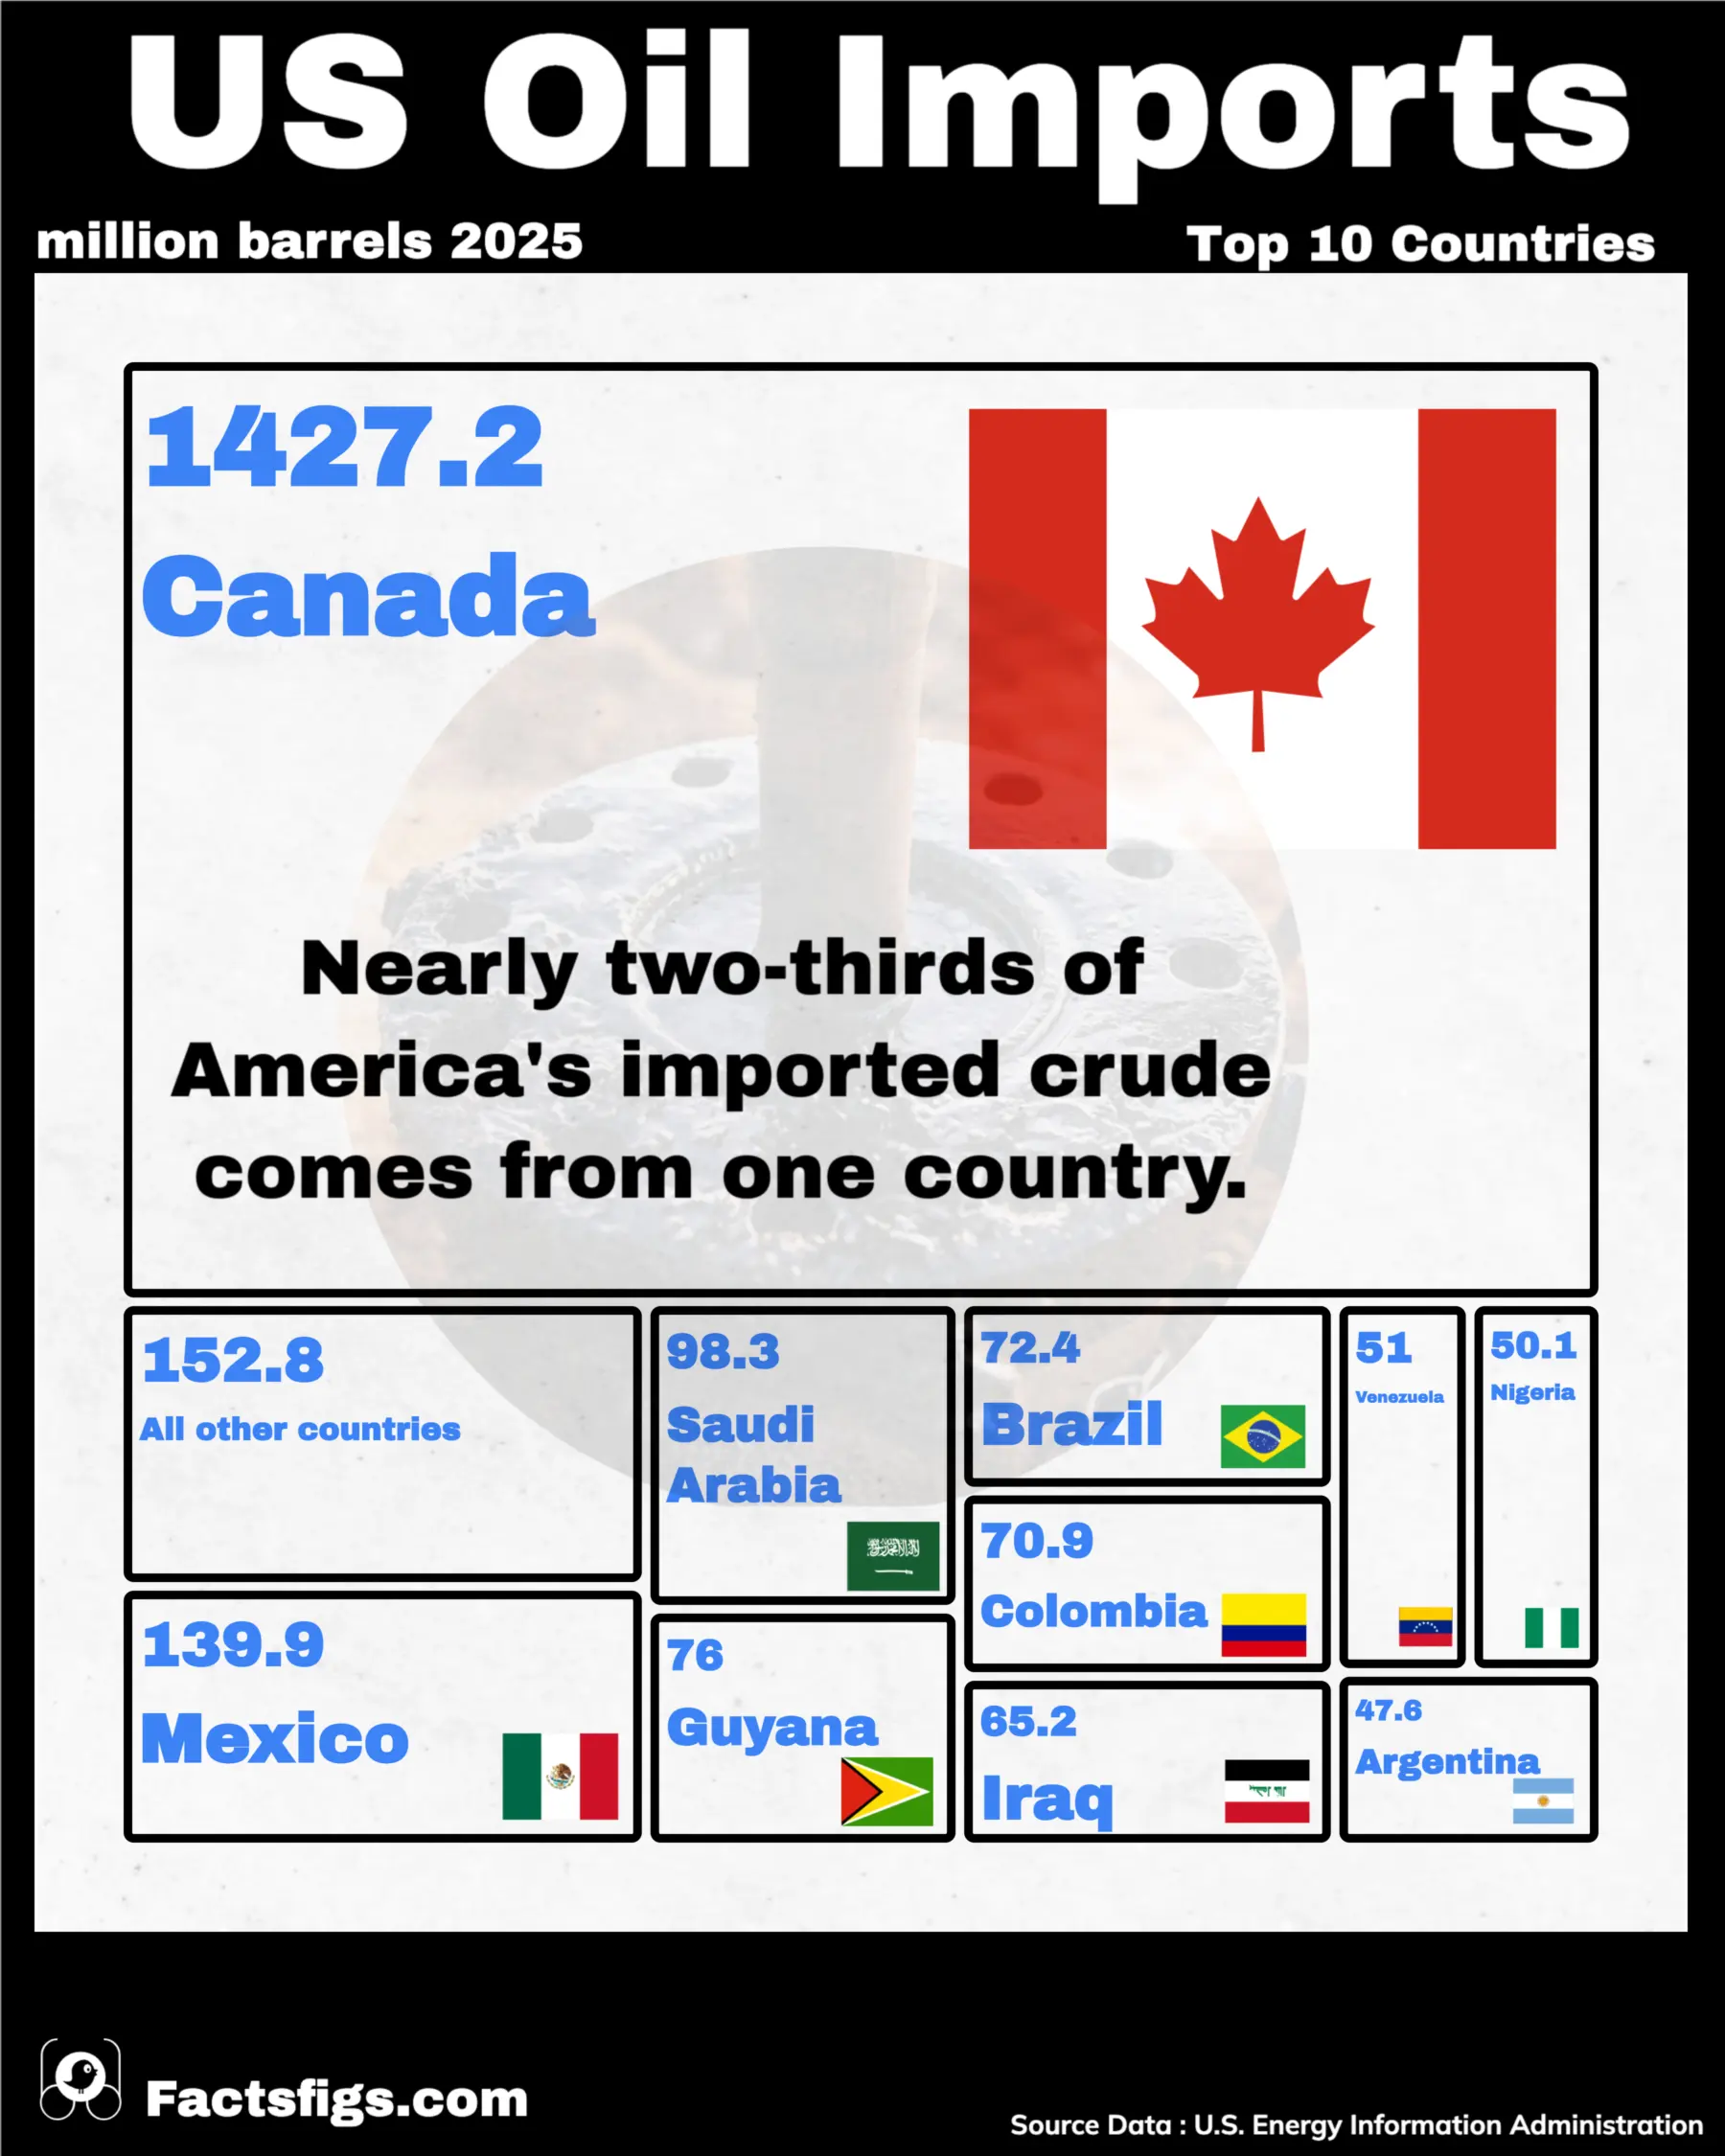
Canada supplies 63.4% of America's imported crude oil, more than every other country in the world combined.
The US imported 2,251.4 million barrels of crude oil in 2025, about 2.25 billion, and Canada supplied 1,427.2 million of them, 63.4% of the total. That is 1.73 times as much as every other supplying country put together, including Mexico, the second-largest supplier at 139.9, and Saudi Arabia, third at 98.3.
Two countries grew against a shrinking market. Argentina's shipments rose 91%, from 25.0 to 47.6 million barrels, as its Vaca Muerta shale fields reached export scale. Guyana rose 18%, from 64.4 to 76.0, on the strength of its offshore oil boom, moving past Brazil, Colombia and Iraq in the ranking.
Venezuela fell 39%, from 83.4 to 51.0, the steepest drop of any of the ten ranked countries and far beyond what the market's overall 7% contraction explains on its own. Most of the other declines, Mexico's 18%, Brazil's 10%, Colombia's 10%, Iraq's 10% and Nigeria's 11%, sit close to that market-wide number and look like the tide going out rather than countries losing ground individually.
The Middle East barely registers by comparison. Saudi Arabia is 4.4% of US crude imports, Iraq 2.9%, and the entire Persian Gulf together comes to 7.9%, an order of magnitude below what one North American neighbor supplies on its own.
! What the 2025 Ranking Shows:
•
Canada's Share Keeps Growing:Canada's 63.4% share of US crude imports in 2025 is up from roughly 61.7% the year before, even as its own barrel count fell 4%, because the total import pool shrank faster than Canada's volume did.
•
Argentina Nearly Doubled:Argentina's exports to the US rose from 25.0 to 47.6 million barrels, a 91% jump, the largest percentage gain of any country in the ranking.
•
Venezuela Fell by More Than a Third:Venezuela's shipments dropped from 83.4 to 51.0 million barrels, a 39% decline, the steepest of any of the ten ranked suppliers.
? The Figures Behind the Ranking:
•
Biggest supplier:Canada, 1,427.2 million barrels, 63.4% of US crude imports
•
Persian Gulf total:7.9% of US crude imports, led by Saudi Arabia's 4.4%
•
Sharpest riser:Argentina, +91% (25.0 to 47.6 million barrels)
•
Sharpest decliner:Venezuela, -39% (83.4 to 51.0 million barrels)
The story of US oil imports in 2025 isn't the Middle East. It's one neighboring country supplying nearly two of every three barrels, and a handful of much smaller suppliers rearranging themselves around the edges of a shrinking market.
Continue reading below for the full detailed article →
Overview
Why Canada, Not the Gulf, Supplies Most US Oil
Ask most Americans where their gasoline's crude oil comes from, and the reflexive answer is the Middle East: Saudi Arabia, Iraq, tankers crossing the Persian Gulf. The Energy Information Administration's 2025 country-by-country count of crude oil imports, in million barrels a year, tells a different story. Canada alone supplied 1,427.2 of the 2,251.4 million barrels the US imported that year, about 1.43 of 2.25 billion, 63.4% of the total and 1.73 times as much as every other country combined. Saudi Arabia supplied 98.3, a share of 4.4%, and the entire Persian Gulf together reached just 7.9%, not much more than a tenth of what one country delivers by pipeline and rail across a shared land border. This ranking counts crude oil only, not the combined crude-and-refined-products series the EIA also publishes, which pulls in countries like South Korea and the Netherlands that import crude from elsewhere and sell the US refined fuel made from someone else's oil rather than their own. Restricting the count to crude leaves the truer picture: ten countries that actually produce oil and ship it to America, plus a shrinking field of everyone else.
The Three Numbers Behind America's Most Lopsided Trade Relationship
Canada's dominance, the size of the gap between it and everyone else, and how little the Persian Gulf actually contributes are the three numbers that carry this whole story. Together they explain why most people's mental picture of where US oil comes from doesn't match the EIA's own 2025 count.
63.4% of US Crude Imports Come From Canada
63.4%
Canada shipped 1,427.2 million barrels of crude oil to the United States in 2025, about 1.43 billion, 63.4% of everything the country imported. That volume moves almost entirely by pipeline and rail across one shared land border, a route no ocean tanker can match, and its share only grew as the overall import pool shrank.
1.73 Times Every Other Country Combined
1.73x
Add up every other country that sold crude to the United States in 2025, Mexico, Saudi Arabia, Guyana, Brazil, Colombia, Iraq, Venezuela, Nigeria, Argentina and everyone left in the remainder bucket, and the total comes to 824.2 million barrels. Canada alone shipped 1,427.2, 1.73 times that combined figure, from a single supplying nation.
Persian Gulf Supplies Just 7.9% of US Crude
7.9%
Saudi Arabia supplied 98.3 million barrels in 2025, 4.4% of US crude imports, and Iraq added another 65.2, 2.9%. Every other Gulf state sits inside the residual bucket, and together the whole Persian Gulf reaches just 7.9% of the total, a fraction of what one North American neighbor ships alone.
Canada by the Numbers
Canada 63.4 %1,427.2 million barrels, 63.4% of the 2025 total.
Mexico 6.2 %139.9 million barrels, the second-largest supplier.
Saudi Arabia 4.4 %98.3 million barrels, the largest Gulf supplier.
The Shrinking Pool
Why Most Declines Are the Tide Going Out
America's total crude oil imports fell from 2,411.1 to 2,251.4 million barrels between 2024 and 2025, a drop of 7%. Against that backdrop, most of the individual country declines below aren't really stories about one supplier losing ground to another. They are what happens when the whole pool gets smaller and every country's raw barrel count falls a little, even if its share of the total barely moves.
Mexico's shipments fell 18%, from 169.8 to 139.9. Brazil fell 10%, from 80.8 to 72.4. Colombia fell 10%, from 78.4 to 70.9. Iraq fell 10%, from 72.5 to 65.2. Nigeria fell 11%, from 56.4 to 50.1. Every one of those drops sits within a few points of the market-wide 7% contraction, which is why none of them moved by more than a single percentage point in their share of the 2025 total.
Argentina and Guyana did the opposite. Both countries increased their raw shipments to the US even as the total market contracted, which is a different kind of story than simply keeping pace with a shrinking field. The next two sections cover them individually, followed by Venezuela, whose 39% drop is far too steep to explain by the tide alone.
The Riser: Argentina
Argentina's Shale Boom Reaches Export Scale
Argentina's crude shipments to the United States rose from 25.0 to 47.6 million barrels between 2024 and 2025, a gain of 91%, the steepest percentage increase of any country in the ranking. The growth traces to Vaca Muerta, Argentina's shale formation, reaching export scale.
Even after nearly doubling, Argentina remains the smallest of the ten ranked countries, just behind Nigeria's 50.1. It is the rate of change, not the absolute volume, that stands out: nowhere else in the table did a country's shipments move by anywhere close to 91% in a single year.
The Riser: Guyana
Guyana's Offshore Boom Keeps Climbing
Guyana's shipments to the US rose from 64.4 to 76.0 million barrels between 2024 and 2025, an 18% increase powered by the country's offshore oil boom. That growth pushed Guyana ahead of Brazil, Colombia and Iraq in the 2025 ranking, up to fourth place among the ten countries the EIA tracks individually.
Guyana's 76.0 million barrels now exceeds what Iraq, a country whose oil exports have been measured for generations, shipped to the US in 2025. It is the only country in the top four that grew its raw volume year over year rather than simply losing less than everyone else.
The Decliner: Venezuela
Venezuela's Shipments Fell by More Than a Third
Venezuela's crude shipments to the US fell from 83.4 to 51.0 million barrels between 2024 and 2025, a drop of 39%, the steepest decline of any of the ten ranked countries. That single-country drop is 5.6 times the size of the 7% contraction across the whole import pool.
Because the decline is so much larger than what the shrinking market explains on its own, Venezuela's drop reads as a story about that country specifically rather than a side effect of the smaller overall pool, the way Mexico's or Brazil's declines do. It fell from 83.4 million barrels in 2024 to 51.0 in 2025, now the eighth largest of the ten ranked countries, ahead of only Nigeria and Argentina.
The Full Ranking
US Crude Oil Imports by Country, 2024 vs. 2025
Rank and share reflect 2025 volumes. The EIA's source table also publishes inline aggregate rows for All Countries, OPEC, Non-OPEC and Persian Gulf; those are excluded here, and the countries within them are counted individually or folded into "All other countries" below, so the ranking reflects real supplying nations only.
Units are million barrels of crude oil per year, not a daily rate. The EIA also publishes this same series as thousand barrels per day; a reader cross-checking against that table will see different-looking numbers for the same underlying volumes. Figures reflect crude oil only; the EIA's broader crude-plus-products series would rank South Korea and the Netherlands in the top 15, though neither produces meaningful crude oil of its own.
The Verdict
What Canada's 63% Share Means for US Energy Security
A single country supplying 63.4% of US crude oil imports is the kind of concentration that would worry policymakers if that country sat on the other side of an ocean, or answered to a rival power. Canada is neither. Its oil moves by pipeline and rail across a shared land border, the product of decades of integrated trade rather than a single year's tanker traffic.
The comparison to the Middle East is instructive precisely because it undercuts the old dependency story. Saudi Arabia is 4.4% of US crude imports and the whole Persian Gulf is 7.9%, an order of magnitude below Canada's share. The 1970s framing of American energy security as a Gulf-oil problem doesn't match where the barrels actually come from in 2025.
None of that erases the risk that comes with relying on one supplier this heavily. A pipeline outage, a labor dispute or a trade quarrel would matter more to US refiners than an equivalent disruption almost anywhere else, precisely because no other country ships anywhere near enough to make up the difference. Concentration with a friendly, adjacent supplier is a different kind of risk than concentration with a distant, volatile one, but it is still concentration.
The data behind this story comes from the US Energy Information Administration's U.S. Crude Oil Imports table, pet_move_impcus_a2_nus_epc0_im0_mbbl_a, covering crude oil only rather than the EIA's broader crude-plus-products series, in thousand barrels, annual. The dataset is a US government work in the public domain, and full credit for collecting and maintaining it goes to the EIA.
FactsFigs reviews, cleans, and cross-checks every source dataset before shaping it into a data story. Each visualization is created and designed in FactsFigs Design Studio, an internal tool developed and owned by FactsFigs, and is the original work of a FactsFigs author, not an AI-generated copy of any existing graphic. Individual assets within a visual may or may not be produced with AI tools, but the design of the visual itself is solely FactsFigs' own.
Figures are estimates at the time of publication, provided for information only, nothing here is financial advice or a guarantee of accuracy.
Last verified: 26 Sept 2026
The charts in this article were built with our own publishing system. See what it does →