TL;DR — Where Does Life Expectancy Vary Most Around the World?
A 31.9-year gap separates the country with the world's highest and lowest life expectancy
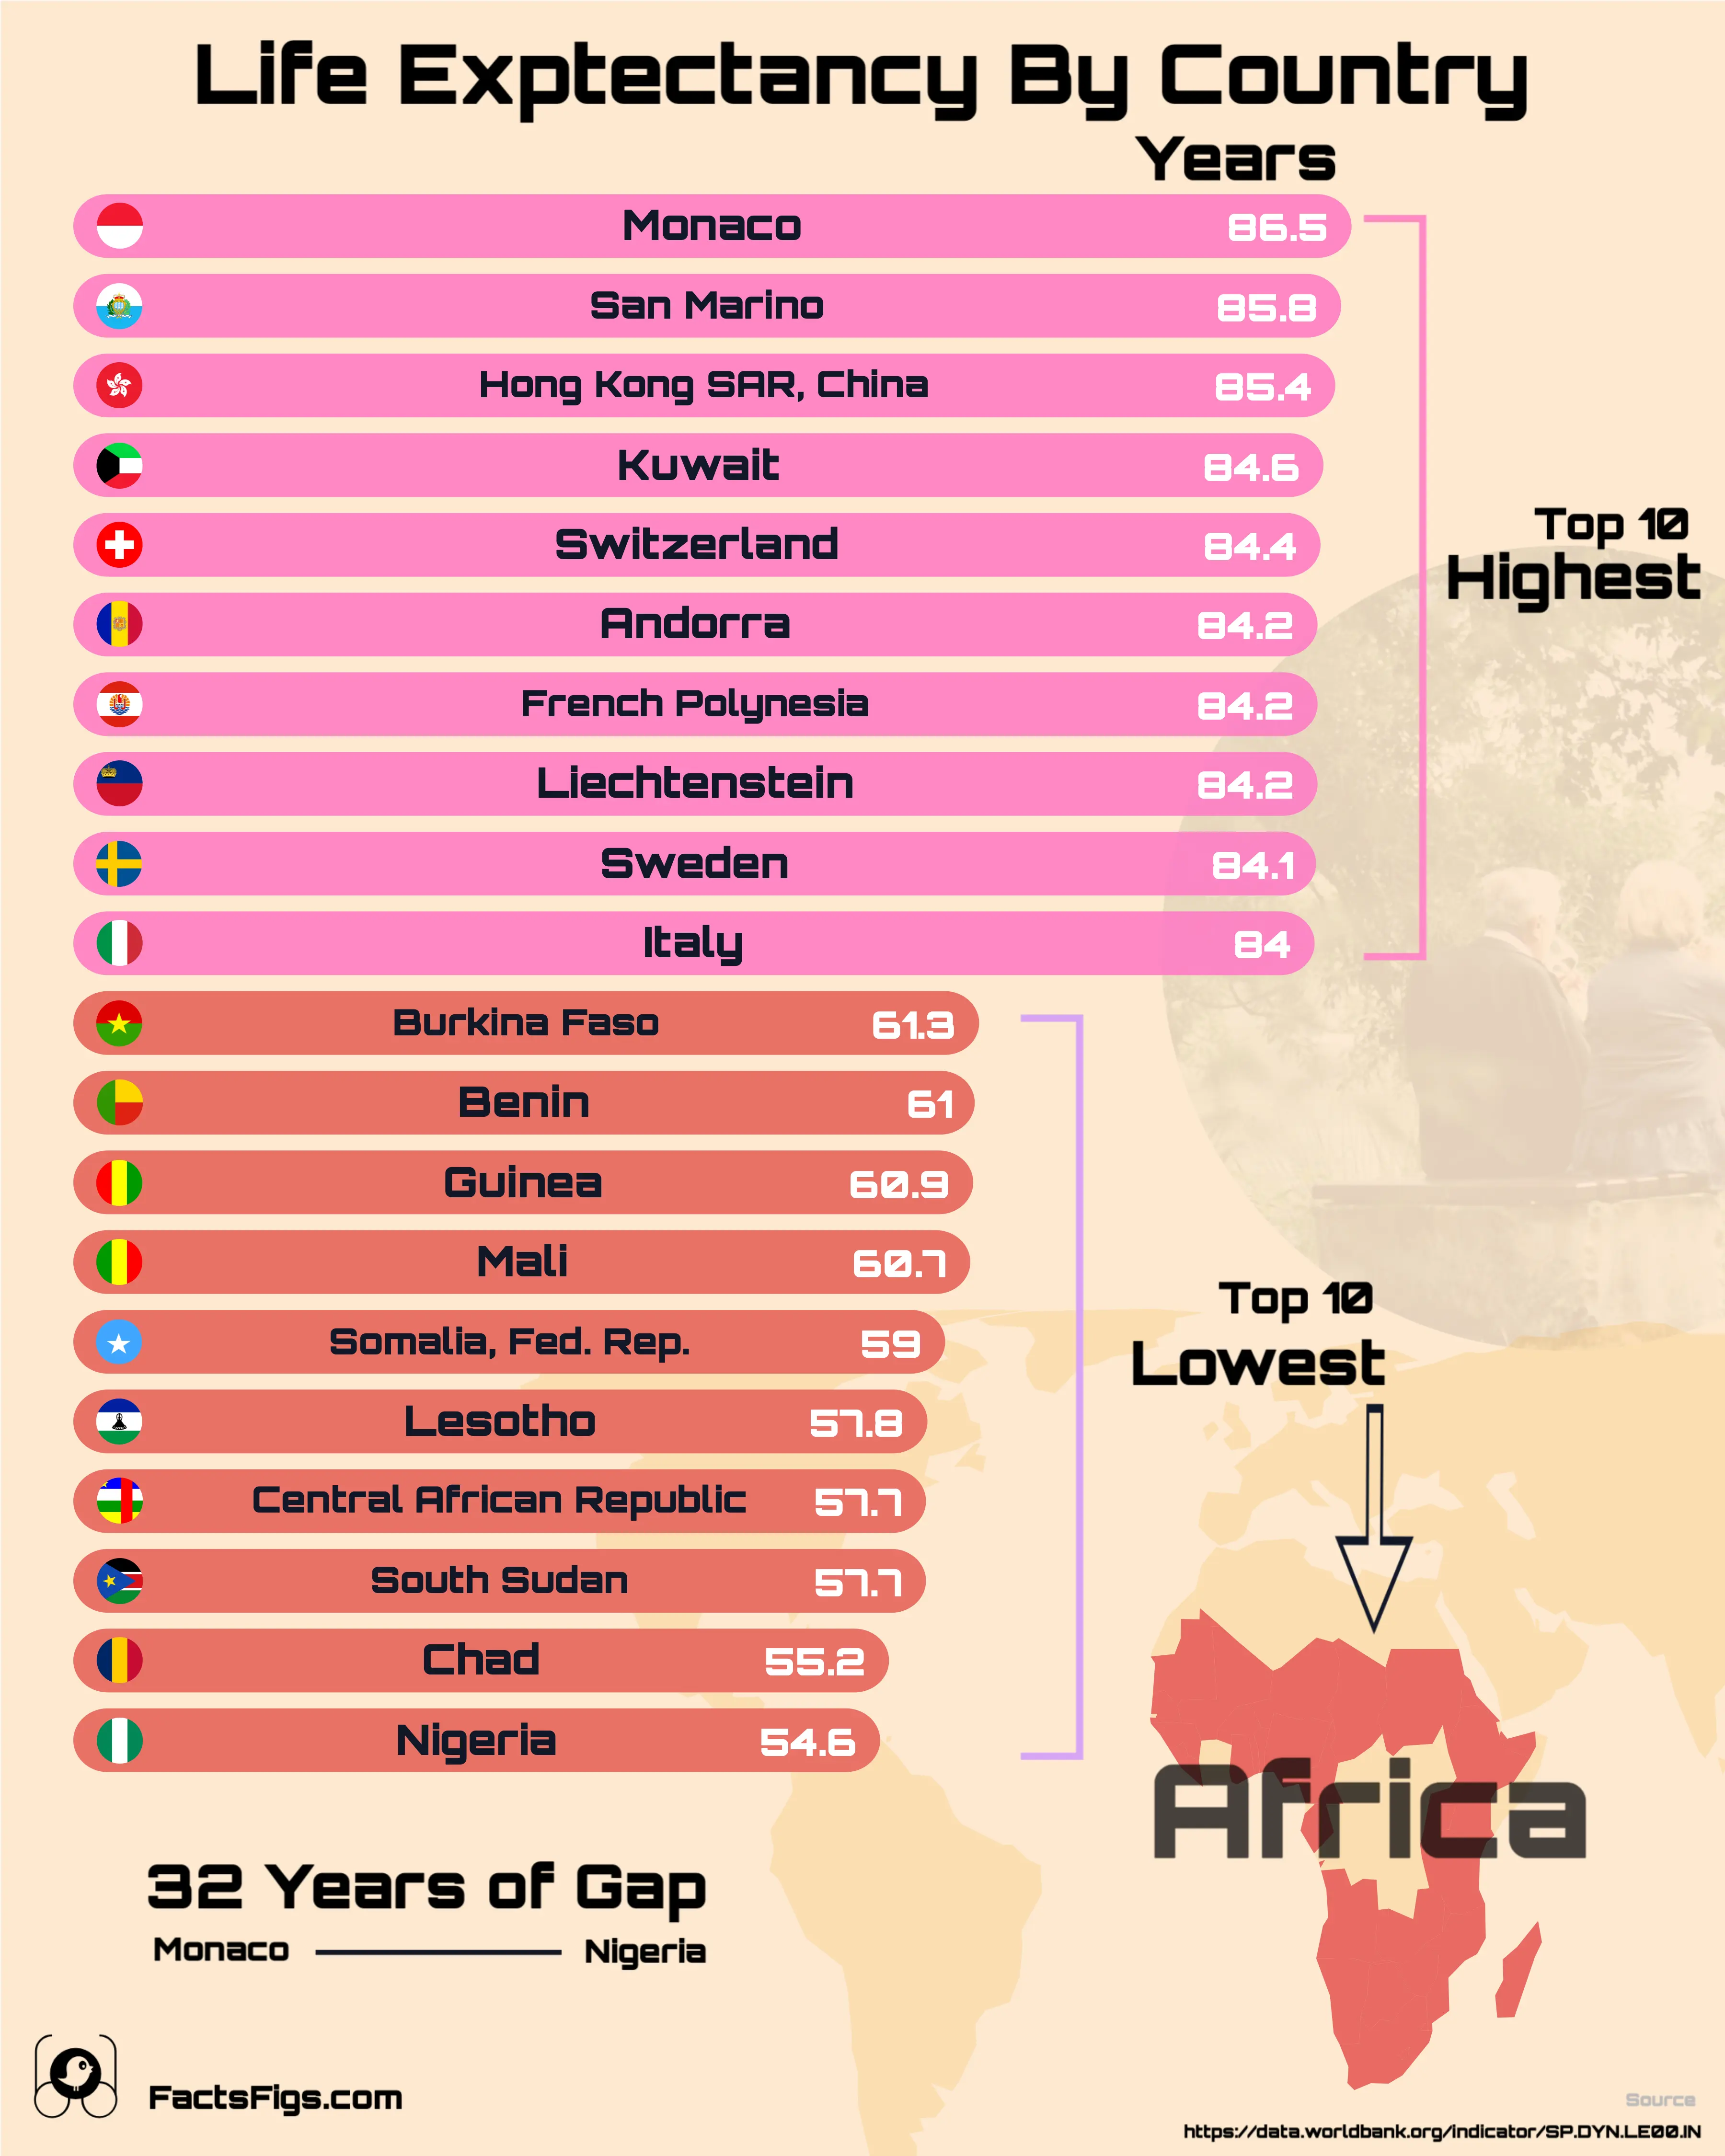
The World Bank's 2024 life expectancy estimates cover 217 countries and territories, and the range between them is enormous. Monaco sits at the top with 86.5 years. Nigeria sits at the bottom with 54.6 — a difference of 31.9 years between the longest-living and shortest-living national populations on the same planet, in the same year.
The world median is 74.7 years, which splits the 217-country field close to evenly. Monaco sits 11.8 years above that median; Nigeria sits 20.1 below it. All ten of the lowest-ranked countries are in Sub-Saharan Africa, while the ten highest cluster in Europe, East Asia and the wealthier Gulf states.
None of this means a baby born in Nigeria today can expect to die at 54.6. Life expectancy at birth is an average pulled down hard by deaths in the first years of life — the single most common misreading of the statistic, and the subject of the closing section below.
Monaco's placement invites an objection worth naming directly: it is a city-state of roughly 36,000 people with an economy built on banking, tourism and residency for the wealthy, which is not obviously comparable to Nigeria's more than 200 million people, or to most of the 217 countries in between. Averaging across full cohorts answers that objection instead of relying on it. The ten highest-ranked countries in this dataset average 84.7 years; the ten lowest average 58.6; the difference between those two groups is 26.1 years — almost as wide as the single-country gap, and much harder to dismiss as one small nation's quirk of geography and wealth.
! What the Numbers Actually Say:
•
Monaco Leads at 86.5 Years:San Marino (85.8) and Hong Kong SAR (85.4) follow directly behind, keeping the top of the table concentrated among small, wealthy territories rather than the world's largest economies.
•
Nigeria Sits Lowest at 54.6 Years:Chad (55.2) and a tie between Central African Republic and South Sudan (57.7 each) round out the bottom four. All ten of the lowest-ranked countries in the full 217-country table are in Sub-Saharan Africa.
•
The Gap Is 31.9 Years:That is larger than the 20.1-year distance between Nigeria and the 74.7-year world median on its own, and about 1.7 times the 11.8-year distance between Monaco and that same median.
? The Figures Behind the Answer:
•
World median life expectancy:74.7 years across 217 countries
•
Highest: Monaco:86.5 years, 11.8 above the median
•
Lowest: Nigeria:54.6 years, 20.1 below the median
•
The gap:31.9 years between the two
Where a person is born still predicts how long they are likely to live more than almost any other single fact about them — and the gap is wide enough to separate entire regions of the world by three decades of expected life.
Continue reading below for the full detailed article →
Overview
What a 31.9-Year Range in Life Expectancy Means
Life expectancy at birth is the World Bank's headline measure of population health: how many years a child born today would be expected to live if current mortality patterns held constant for their whole life. The indicator, SP.DYN.LE00.IN, is drawn from national vital-registration and survey data compiled through the World Development Indicators, and the 2024 edition covers 217 individual countries and territories once regional and income-group aggregates are stripped out. What follows is that full ranking: the twenty countries at the extremes first, then all 217 sorted from Monaco at the top to Nigeria at the bottom, each measured against the 74.7-year world median. A short section after the ranking explains the main forces behind the spread, and a closing note addresses the statistic's most common misreading — because a country's life expectancy at birth is not the age most of its people actually reach. Two sections inside the ranking below go beyond the single Monaco-Nigeria comparison: one measures the gap using ten-country group averages rather than individual extremes, and another sorts all 217 countries into the seven World Bank regions the institution itself uses to track health outcomes, since a country-by-country list can obscure how consistently — or inconsistently — an entire region performs.
The Three Numbers Behind the World's Life Expectancy Gap
Monaco and Nigeria sit at opposite ends of a global life-expectancy table built from the World Bank's 2024 estimates. Between them is the widest gap in the entire 217-country dataset: 31.9 years. The world median of 74.7 years splits the field roughly in half, with Monaco 11.8 years above it and Nigeria 20.1 below.
Monaco Leads the World at 86.5 Years
86.5 years
Monaco records the highest life expectancy of any of the 217 countries the World Bank tracks, at 86.5 years — 11.8 years above the world median of 74.7. San Marino follows at 85.8 and Hong Kong SAR at 85.4, keeping the top of the table concentrated among small, wealthy territories in Europe and East Asia rather than the world's largest economies.
Nigeria Sits Lowest at 54.6 Years
54.6 years
Nigeria's 54.6 years is the lowest national life expectancy in the 2024 dataset, sitting 20.1 years below the world median. Chad follows at 55.2, then Central African Republic and South Sudan tied at 57.7. All ten of the lowest-ranked countries in the entire 217-country table are in Sub-Saharan Africa.
A 31.9-Year Gap Separates Them
31.9 years
The distance between Monaco's 86.5 years and Nigeria's 54.6 is the widest span in the entire 217-country table — wider than the 20.1-year gap between Nigeria and the world median on its own, and roughly 1.7 times the 11.8-year gap that separates Monaco from that same median. No other pair of countries in the dataset is farther apart.
Monaco by the Numbers
Monaco 86.5 yrs86.5 years — the world's highest 2024 estimate.
World median 74.7 yrs74.7 years across all 217 countries.
Nigeria 54.6 yrs54.6 years — the world's lowest 2024 estimate.
The Drivers
What Actually Drives the Life-Expectancy Gap
Three mechanisms account for most of the spread. Rich countries spend roughly sixty times as much per person on healthcare as the poorest ones, and that gap in spending tracks closely with how many children survive past their fifth birthday. Falling child and maternal mortality drove most of the world's life-expectancy gains over the past century, and where those rates stay high, they still pull the birth-cohort average down hard. Conflict compounds both effects: a regression analysis of health data from 181 countries between 2000 and 2019 found that armed conflict is linked to sustained increases in under-five mortality for three to five years afterward, and in maternal mortality for up to seven. All ten of the lowest-ranked countries in this dataset are in Sub-Saharan Africa, a region where low health spending, high child mortality and active conflict often overlap.
That mechanism shows up starkly in the raw child-mortality numbers behind this ranking. The World Health Organization puts Sub-Saharan Africa's under-five mortality rate at 71.6 deaths per 1,000 live births in 2024, against a global average of 37.4 — the highest of any region, and nearly fourteen times the rate in Europe and Northern America. A statistic built from life expectancy at birth is mechanically sensitive to exactly this kind of gap: a region that loses roughly one in fourteen children before age five will show a lower cohort average than one that loses a fraction of that, even before any difference in adult mortality is counted.
Beyond a Single Pair
Why Group Averages Tell the Gap Story Better
Monaco is an outlier in more than life expectancy. The country covers under two square kilometers, has roughly 36,000 residents, and runs an economy built on banking, real estate and tourism for the wealthy — nothing like the profile of Nigeria's more than 200 million people, or of most of the 217 countries in between. Treating its 86.5-year figure as the ceiling of the entire ranking risks explaining a genuinely global pattern with one small nation's circumstances.
Averaging across full cohorts removes that risk. The ten highest-ranked countries in this dataset — Monaco, San Marino, Hong Kong SAR, Kuwait, Switzerland, Andorra, French Polynesia, Liechtenstein, Sweden and Italy — average 84.7 years. The ten lowest — Nigeria, Chad, Central African Republic, South Sudan, Lesotho, Somalia, Mali, Guinea, Benin and Burkina Faso — average 58.6 years. The difference is 26.1 years, nearly as wide as the 31.9-year gap between the two single extremes, and it survives the objection that either end of the table is a statistical fluke. The top-ten boundary itself splits a tie: Italy and Japan both post 84.0 years, and only the dataset's ordering, not a meaningful health difference, puts one at tenth and the other at eleventh.
By Region
How the Seven World Bank Regions Compare
Sorting all 217 countries into the seven regions the World Bank uses for its own reporting shows the same pattern at a coarser grain. North America's median life expectancy is 82.1 years, though the region has only three countries in this dataset: the United States, Canada and Bermuda. Europe & Central Asia, with 58 countries, sits at 79.9. The Middle East, North Africa, Afghanistan & Pakistan grouping, 23 countries, is next at 76.7, followed by Latin America & the Caribbean, 42 countries, at 75.7, South Asia, 6 countries, at 74.1, and East Asia & Pacific, 37 countries, at 73.0. Sub-Saharan Africa, the largest single region in the dataset at 48 countries, has by far the lowest median: 64.3 years.
That regional floor sits below almost every individual country ranked above it. Sub-Saharan Africa's 64.3-year median is lower than all 53 countries in the dataset that reach 80 years or higher — the lowest of that group, Czechia, still posts 80.0. Within the region itself, only two of its 48 countries clear 75 years: Seychelles, the regional high point at 76.3, and Cabo Verde at 76.2. The distance between the best-performing region, North America at 82.1, and the worst, Sub-Saharan Africa at 64.3, is 17.8 years — a gap wide enough to separate entire continents' worth of people, not just two individual countries.
The Full Ranking
All 217 Countries Ranked by Life Expectancy, 2024
Each row is a country's 2024 life expectancy at birth, its distance from the 74.7-year world median, and its World Bank region. Regional and income-group aggregates are excluded, leaving 217 individual countries and territories with their own estimate.
1
🇲🇨 Monaco
86.5
+11.8
Europe & Central Asia
2
🇸🇲 San Marino
85.8
+11.1
Europe & Central Asia
3
🇭🇰 Hong Kong SAR, China
85.4
+10.7
East Asia & Pacific
4
🇰🇼 Kuwait
84.6
+9.9
Middle East, North Africa, Afghanistan & Pakistan
5
🇨🇭 Switzerland
84.4
+9.7
Europe & Central Asia
6
🇦🇩 Andorra
84.2
+9.5
Europe & Central Asia
7
🇵🇫 French Polynesia
84.2
+9.5
East Asia & Pacific
8
🇱🇮 Liechtenstein
84.2
+9.5
Europe & Central Asia
9
🇸🇪 Sweden
84.1
+9.4
Europe & Central Asia
10
🇮🇹 Italy
84.0
+9.3
Europe & Central Asia
11
🇯🇵 Japan
84.0
+9.3
East Asia & Pacific
12
🇪🇸 Spain
83.9
+9.2
Europe & Central Asia
13
🇬🇮 Gibraltar
83.6
+8.9
Europe & Central Asia
14
Korea, Rep.
83.6
+8.9
East Asia & Pacific
15
🇲🇴 Macao SAR, China
83.3
+8.6
East Asia & Pacific
16
🇸🇬 Singapore
83.3
+8.6
East Asia & Pacific
17
🇮🇱 Israel
83.2
+8.5
Middle East, North Africa, Afghanistan & Pakistan
18
🇱🇺 Luxembourg
83.2
+8.5
Europe & Central Asia
19
🇳🇴 Norway
83.2
+8.5
Europe & Central Asia
20
🇦🇺 Australia
83.1
+8.4
East Asia & Pacific
Showing 1-20 of 217
Page 1 of 11
Regional and income-group aggregates (e.g. "World," regional averages) are excluded from this table; each row is an individual country or territory's own World Bank estimate.
Reading the Full List
How Many Countries Actually Live Long Lives?
The Monaco-Nigeria comparison sits at the extreme tails of a much larger distribution, and the tails are thin. Only three of the 217 countries in this dataset reach 85 years or higher: Monaco at 86.5, San Marino at 85.8 and Hong Kong SAR at 85.4. Expand the threshold to 80 years and the count rises to 53 countries, roughly 24% of the field. At 75 years it is 106 countries, just under half. At 70 years it is 153, or 71% of every country and territory the World Bank tracks — meaning most of the world's population lives somewhere with a life expectancy most people would consider reasonably long.
The bottom of the distribution is smaller still. Only six countries in the entire dataset fall below 60 years, and every one of them — Nigeria, Chad, Central African Republic, South Sudan, Lesotho and Somalia — is in Sub-Saharan Africa. That six-country cluster, not the wider 217-country field, is what actually explains why the region's overall median sits so far below the rest of the world: a small number of countries with severe, compounding mortality pressures pull a regional average down much further than a broad, even distribution ever could.
The Common Misreading
What a 54.6-Year Life Expectancy Does Not Mean
Life expectancy at birth is a period average across everyone born in a given year, weighted heavily by deaths in infancy and early childhood — which is why the figure can swing far faster than intuition about aging suggests. Nigeria's 54.6 years is not the age most Nigerians die at; someone who survives childhood already has a meaningfully higher expected age, the same pattern documented globally for how life expectancy calculated from an older starting age runs well above the birth-year figure. The birth-cohort number is the right tool for comparing population health across countries. It is the wrong one for guessing how long any individual adult will live.
This is not a quirk specific to Nigeria's data. Demographic researchers have long noted that in any population with a high concentration of deaths in infancy and early childhood, life expectancy at birth can sit well below the age most people who survive that window actually go on to reach — one widely cited illustration holds that a society with a birth-year life expectancy of just 30 can still see a person who survives to age five expect another 40 years of life, because the low average is driven almost entirely by deaths concentrated at the very start of life rather than spread evenly across every age. Nigeria's 54.6-year figure works the same way: a low starting number produced disproportionately by mortality in the first years of life, not evidence of a compressed adult lifespan.
The data behind this story comes from the World Bank's World Development Indicators, indicator SP.DYN.LE00.IN, "Life expectancy at birth, total (years)," for 217 countries and territories in the 2024 edition, with regional and income-group aggregates excluded. The underlying figures are compiled by the World Bank from United Nations Population Division estimates and national statistical sources, and full credit for collecting and maintaining the series goes to the World Bank Group.
FactsFigs reviews, cleans, and cross-checks every source dataset before shaping it into a data story. Each visualization is created and designed in FactsFigs Design Studio — an internal tool developed and owned by FactsFigs — and is the original work of a FactsFigs author, not an AI-generated copy of any existing graphic. Individual assets within a visual may or may not be produced with AI tools, but the design of the visual itself is solely FactsFigs' own.
Figures are estimates at the time of publication, provided for information only — nothing here is financial advice or a guarantee of accuracy.
Last verified: 20 Sep 2026
The charts in this article were built with our own publishing system. See what it does →