Fastest MLB Pitchers Since 2008: Can Anyone Beat Chapman's 105.8?

By Saif Ur Rahman Published 02 Oct 2026 Updated 02 Oct 2026
Sports World 2 views
FactsFigs
0 shares
FactsFigs Data Story
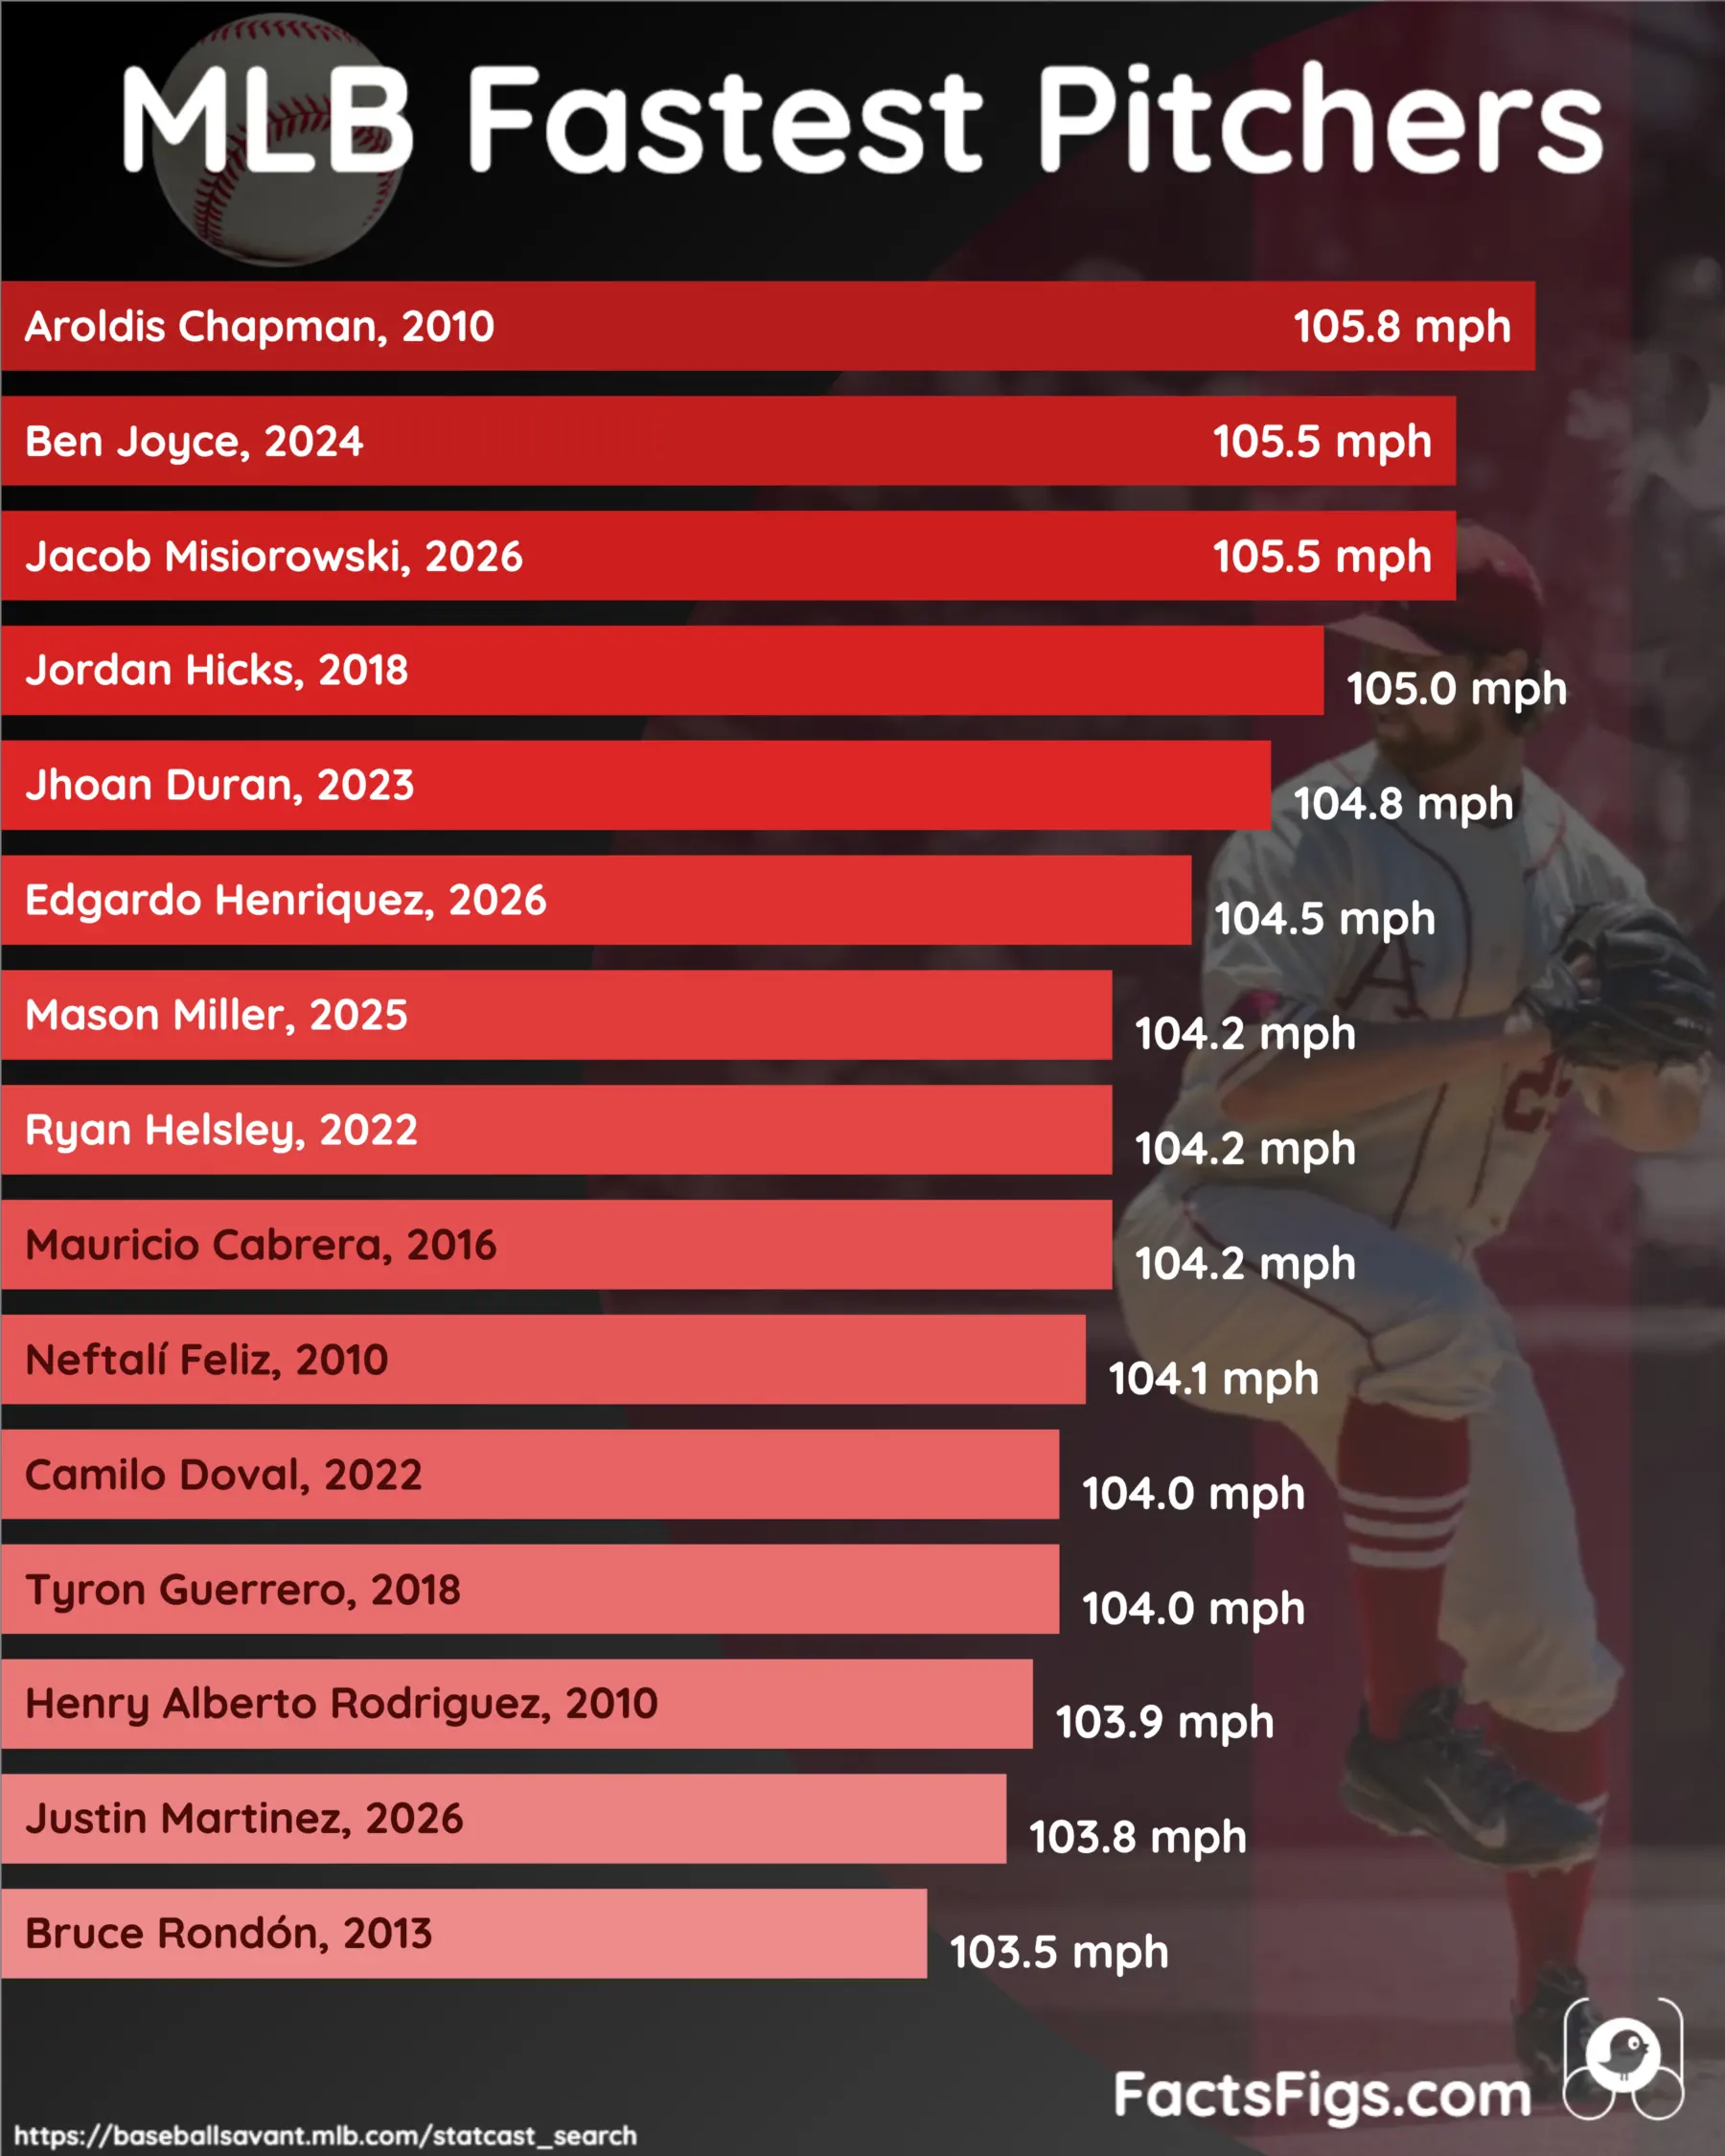
Horizontal bar chart of the 15 fastest MLB pitchers since 2008, one bar per pitcher at his fastest regular-season pitch in mph, labelled with the year. Aroldis Chapman leads at 105.8 mph, Ben Joyce and Jacob Misiorowski follow at 105.5, and Bruce Rondón is 15th at 103.5. The bars start at 100 mph rather than zero.

TL;DR — Who Has Thrown the Fastest Pitch Since 2008?

Chapman's 2010 record still stands, but the list belongs to recent arms

Aroldis Chapman's 105.8 mph on 24 September 2010 is still the fastest regular-season pitch since MLB began tracking every pitch in 2008, with Ben Joyce and Jacob Misiorowski 0.3 mph behind at 105.5. Ten of the 15 fastest pitchers peaked in 2018 or later, and three of them did it in 2026. This is not an all-time list: Bob Feller and Nolan Ryan were timed with different instruments, so they are context, not bars.

! What the Data Shows:

  • •
    An Old Record, a Young Field: Chapman's pitch is from 2010, yet 10 of the 15 peaks came in 2018 or later.
  • •
    One Row per Pitcher: Chapman threw 8 of the 10 fastest individual pitches, so the list counts pitchers, not throws.
  • •
    One Measurement Convention: Pre-2017 speeds are adjusted to release point, which is why Chapman reads 105.8 and not 105.1.

? Key Numbers:

  • •
    Fastest Pitch: 105.8 mph, Aroldis Chapman, 2010
  • •
    Peaks in 2018 or Later: 10 of 15
  • •
    Chapman's Share of the 10 Fastest Pitches: 8 of 10
  • •
    Spread, First to 15th: 2.3 mph (2.2%)

The headline name is from 2010; the shape of the list is from now. Chapman's record has outlasted 16 more seasons, but two pitchers sit 0.3 mph below it, less than the 0.7 mph correction applied to his own pitch.

Continue reading below for the full detailed article →

Overview

Why This List Starts in 2008 and Not Earlier

Ask who threw the fastest pitch in baseball history and the names that come back are Nolan Ryan and Bob Feller. Neither is among the 15 names below, because neither number was measured the way a modern pitch is. Ryan's 100.9 mph in 1974 was a radar reading taken about 10 feet short of the plate, and Feller's celebrated 107.6 mph was never measured at all: the instrument read 98.6 mph at the plate in 1946. Baseball Savant's pitch-level record, which tracks every pitch in every park, begins in 2008. So the question here is narrower and fairer: since 2008, who has thrown the hardest regular-season pitch, counting each pitcher once?

The Three Numbers Behind the Fastest-Pitcher Race

Three figures frame the race: the speed nobody has beaten, how recent the pack chasing it is, and how much of the leaderboard one man fills when throws are counted instead of throwers.

105.8 mph: The Pitch Nobody Has Matched

105.8 mph

Aroldis Chapman threw it for the Cincinnati Reds against the San Diego Padres on 24 September 2010, and it was a ball. MLB's Gameday feed logged it at 105.1 mph; Baseball Savant's release-point figure, which Guinness World Records also lists, is 105.8. It remains the highest regular-season reading of the tracked era, 0.3 mph clear of the next two.

10 of 15 Peaked in 2018 or Later

10 of 15

Only five of the 15 fastest pitches came in the nine PITCHf/x seasons from 2008 to 2016: Chapman, Neftalí Feliz and Henry Alberto Rodriguez in 2010, Bruce Rondón in 2013 and Mauricio Cabrera in 2016. The other ten arrived from 2018 on, three of them in 2026. The record is old; the crowd chasing it is not.

8 of the 10 Fastest Pitches Are Chapman's

8 of 10

Count pitches instead of pitchers and the leaderboard collapses into one man. Chapman owns 8 of the 10 fastest regular-season pitches since 2008, 14 of the top 21 once ties at 104.8 are included, and 70 of the 143 thrown at 104.0 mph or faster. That is why this ranking keeps one row per pitcher.

Aroldis Chapman by the Numbers

  • A Ball, Not a Strike The record pitch missed the zone and was called a ball.
  • 105.1 on Gameday, 105.8 on Savant The 0.7 mph difference is Savant's release-point adjustment to 2010 PITCHf/x data.
  • The Only Left-Hander of the 15 The other 14 pitchers on the list all throw right-handed.

One Row per Pitcher

Why This Ranks Pitchers, Not Pitches

The obvious objection is that Chapman threw the eight fastest pitches, so the list should be eight Chapmans. Count that way and he owns 8 of the 10 fastest regular-season pitches since 2008, with only one each from Joyce and Misiorowski making the cut at 105.1 mph and above.

Widen it to the 15 fastest pitches, which with ties at 104.8 means 21, and Chapman has 14. Only five pitchers appear: Chapman, Joyce with 3, Jordan Hicks with 2, and Misiorowski and Jhoan Duran with one each. Across all 143 pitches of 104.0 mph or faster, Chapman has 70 and Misiorowski 22. A chart of pitches would be mostly one man; a chart of pitchers shows who else is in the room.

The Measurement

Why Chapman's 105.1 Became 105.8

Chapman's record pitch carries two numbers because baseball has measured pitches from two places. From 2008 to 2016, speeds came from PITCHf/x cameras that read the ball early in flight. From 2017, Statcast has reported speed as the ball leaves the hand. MLB's Gameday feed still holds the 24 September 2010 pitch at 105.1 mph. Baseball Savant publishes 105.8.

The gap is a correction, not a dispute. Savant's documentation says the 2008 to 2016 values are "adjusted to roughly out-of-hand release point" so every year sits on one scale, and SABR reports the change added 0.7 mph to Chapman's pitch. Every row here uses Savant's release-point figure. For pitches from 2018 on, Savant and Gameday matched to the decimal in every comparison made.

Mixing conventions is the error a page would never reveal. Put Chapman's 105.1 beside everyone else's release-point numbers and he falls from first to third. Five rows (Chapman, Feliz, Rodriguez, Rondón and Cabrera) carry the flat 0.7 adjustment, and Savant's own word for it is "roughly," so they carry slightly more uncertainty than the ten native Statcast ones.

The 105 Club

Four Pitchers Have Reached 105 mph, Only One Before 2018

Ben Joyce and Jacob Misiorowski are tied at 105.5 mph, 0.3 short of Chapman. Joyce threw his for the Los Angeles Angels on 3 September 2024, a swinging strike against the Dodgers. Misiorowski's came for the Milwaukee Brewers on 26 June 2026, fouled off by a Cubs hitter. Joyce ranks higher because his second-fastest pitch, 104.8, beats Misiorowski's 104.7.

Jordan Hicks is the bridge between eras. His 105.0 mph sinker for the St. Louis Cardinals on 20 May 2018 was a foul ball against the Phillies. Between Chapman in 2010 and Hicks in 2018 nobody reached 105 at all, and after Hicks nobody did again until Joyce in 2024.

Ranks 5 to 10

Six Pitchers Between 104.1 and 104.8, Four Since 2022

Jhoan Duran's 104.8 mph for the Minnesota Twins on 19 July 2023 tops the group, and it was one of only two record pitches put in play; Ryan Helsley's was the other. Edgardo Henriquez of the Dodgers reached 104.5 on 4 September 2026, a sinker fouled off by the Nationals.

Mason Miller (San Diego Padres, 5 August 2025), Helsley (St. Louis Cardinals, 27 September 2022) and Mauricio Cabrera (Atlanta Braves, 2 September 2016) all peaked at 104.2, ordered by their second-fastest pitches of 104.1, 104.0 and 103.9. Neftalí Feliz closes the group at 104.1 for the Texas Rangers on 1 September 2010.

Ranks 11 to 15

At the Cutoff, Tenths of an mph Decide Who Is In

Camilo Doval and Tyron Guerrero both topped out at 104.0 mph, Doval for the San Francisco Giants on 23 September 2022 and Guerrero for the Miami Marlins on 13 August 2018. Doval's was a cutter, the only one among the 15 record pitches; ten are four-seam fastballs and four are sinkers.

Henry Alberto Rodriguez of the Oakland Athletics is 13th at 103.9, from 15 September 2010. Justin Martinez of the Arizona Diamondbacks is 14th at 103.8, a called strike from 15 September 2026, exactly 16 years later to the day.

Fifteenth is the closest call. Bruce Rondón of the Detroit Tigers threw 103.5 twice on 7 August 2013; Kelvin Herrera threw 103.5 once in 2012, with a second-best of 102.9. Rondón gets the spot on that countback, a judgement call.

The Full Data Table

The 15 Fastest MLB Pitchers, 2008 to 2026, by Peak Speed

One row per pitcher, regular season only, ranked by fastest pitch. Team is the club he pitched for that day. Ties are ordered by each pitcher's second-fastest pitch.

1Aroldis Chapman105.824 Sep 2010Cincinnati RedsFour-seam fastballPITCHf/x, adjusted
2Ben Joyce105.53 Sep 2024Los Angeles AngelsFour-seam fastballStatcast
3Jacob Misiorowski105.526 Jun 2026Milwaukee BrewersFour-seam fastballStatcast
4Jordan Hicks105.020 May 2018St. Louis CardinalsSinkerStatcast
5Jhoan Duran104.819 Jul 2023Minnesota TwinsFour-seam fastballStatcast
6Edgardo Henriquez104.54 Sep 2026Los Angeles DodgersSinkerStatcast
7Mason Miller104.25 Aug 2025San Diego PadresFour-seam fastballStatcast
8Ryan Helsley104.227 Sep 2022St. Louis CardinalsFour-seam fastballStatcast
9Mauricio Cabrera104.22 Sep 2016Atlanta BravesFour-seam fastballPITCHf/x, adjusted
10Neftalí Feliz104.11 Sep 2010Texas RangersFour-seam fastballPITCHf/x, adjusted
11Camilo Doval104.023 Sep 2022San Francisco GiantsCutterStatcast
12Tyron Guerrero104.013 Aug 2018Miami MarlinsFour-seam fastballStatcast
13Henry Alberto Rodriguez103.915 Sep 2010Oakland AthleticsSinkerPITCHf/x, adjusted
14Justin Martinez103.815 Sep 2026Arizona DiamondbacksSinkerStatcast
15Bruce Rondón103.57 Aug 2013Detroit TigersFour-seam fastballPITCHf/x, adjusted

The Trend

Why This Is a Now Story, Not a Nostalgia One

The nine PITCHf/x seasons from 2008 to 2016 produced five of the 15 peaks. The ten seasons since produced ten, though none came in 2017, 2019, 2020 or 2021. Three arrived in 2026: Misiorowski on 26 June, Henriquez on 4 September and Martinez on 15 September.

Almost all of them are still throwing. Eleven of the 15 pitched in the majors in 2026, Chapman included; the four who did not are Cabrera, Feliz, Rodriguez and Rondón. ESPN reported that on 8 May 2026 Misiorowski threw three pitches at 103.6 mph, the fastest any starter had thrown since pitch tracking began in 2008. Seven weeks later he threw 105.5.

What the list cannot show is why. It records one ceiling per pitcher, not how hard the average fastball is thrown, so it shows the hardest throws clustering in recent seasons, not that the league as a whole throws harder.

Before the Radar Gun

Why Bob Feller and Nolan Ryan Are Not on This List

Bob Feller's story is mostly arithmetic. On 20 August 1946, an Army ordnance chronograph at Griffith Stadium in Washington clocked a Feller pitch at 98.6 mph as it crossed the plate. The 107.6 mph that circulates comes from adding roughly 1 mph per 5.5 feet of flight, a rule of thumb one secondary account credits to the 2016 documentary Fastball. It is an estimate, not a reading.

Nolan Ryan's 100.9 mph in 1974, from a Rockwell International radar device at Anaheim Stadium, is a real measurement, but it was taken about 10 feet in front of the plate, after the pitch had slowed. Modern readings are taken at release, so the two cannot share a bar. A 108.1 mph "release equivalent" circulates for Ryan; it could not be verified, so it stays out.

The one pre-2008 reading on the same footing is Joel Zumaya's 104.8 mph in Game 1 of the 2006 American League Championship Series, reported at release and confirmed by SABR. It was a postseason pitch, and Savant holds no 2006 data. In the regular season Zumaya reached 103.4 in 2009, just below this list's cutoff.

The Rules

What Postseason and Spring Games Would Change

Only regular-season games count, and any pitch thrown counts, whether ball, strike, foul or in play. Add the postseason and the 15 names stay the same, but Mason Miller's peak moves from 104.2 to 104.5, thrown on 1 October 2025 in the National League Wild Card Series, lifting him from seventh to sixth. Add spring training, the All-Star Game and exhibitions as well and Andrew Cashner enters at 104.0, from a spring game on 4 March 2012, pushing Rondón out.

The Verdict

The Record Stands, but by Less Than the Adjustment

Chapman's 105.8 is still the fastest regular-season pitch of the tracked era, and his second-fastest, 105.7, shows it was no fluke. But his lead over Joyce and Misiorowski is 0.3 mph, smaller than the 0.7 mph correction that moved his pitch onto the modern scale. Gaps of a tenth or two between neighbours are inside any radar's noise, so the order below the top few is a ranking by published number, not proof of a real gap.

What survives is the shape: 15 pitchers, 2.3 mph from first to last, two thirds of them peaking in 2018 or later. Treat the newest rows as provisional: the data runs through the regular-season finale on 27 September 2026, Savant can revise values, and three of the 15 rows come from the last four months.

Data Source and Attribution

Baseball Savant Statcast Search

The data behind this story comes from Baseball Savant's Statcast Search, via its pitch-level CSV export for regular-season games from 2008 to 2026, cross-checked against the MLB Stats API. The dataset is public pitch-tracking data published by MLB, and full credit for collecting and maintaining it goes to MLB Advanced Media. The one-row-per-pitcher ranking, tiebreaks and shares are FactsFigs calculations. Anyone can reproduce the ranking in Statcast Search by setting game type to Regular Season, seasons 2008 through 2026, and release speed above 103.4 mph, then taking each pitcher's single fastest pitch: that query returns 475 pitches from 18 pitchers, of whom the top 15 are listed here.

FactsFigs reviews, cleans, and cross-checks every source dataset before shaping it into a data story. Each visualization is created and designed in FactsFigs Design Studio - an internal tool developed and owned by FactsFigs - and is the original work of a FactsFigs author, not an AI-generated copy of any existing graphic. Individual assets within a visual may or may not be produced with AI tools, but the design of the visual itself is solely FactsFigs' own.

Figures are estimates at the time of publication, provided for information only - nothing here is financial advice or a guarantee of accuracy.

Last verified: 2 Oct 2026

The charts in this article were built with our own publishing system. See what it does →