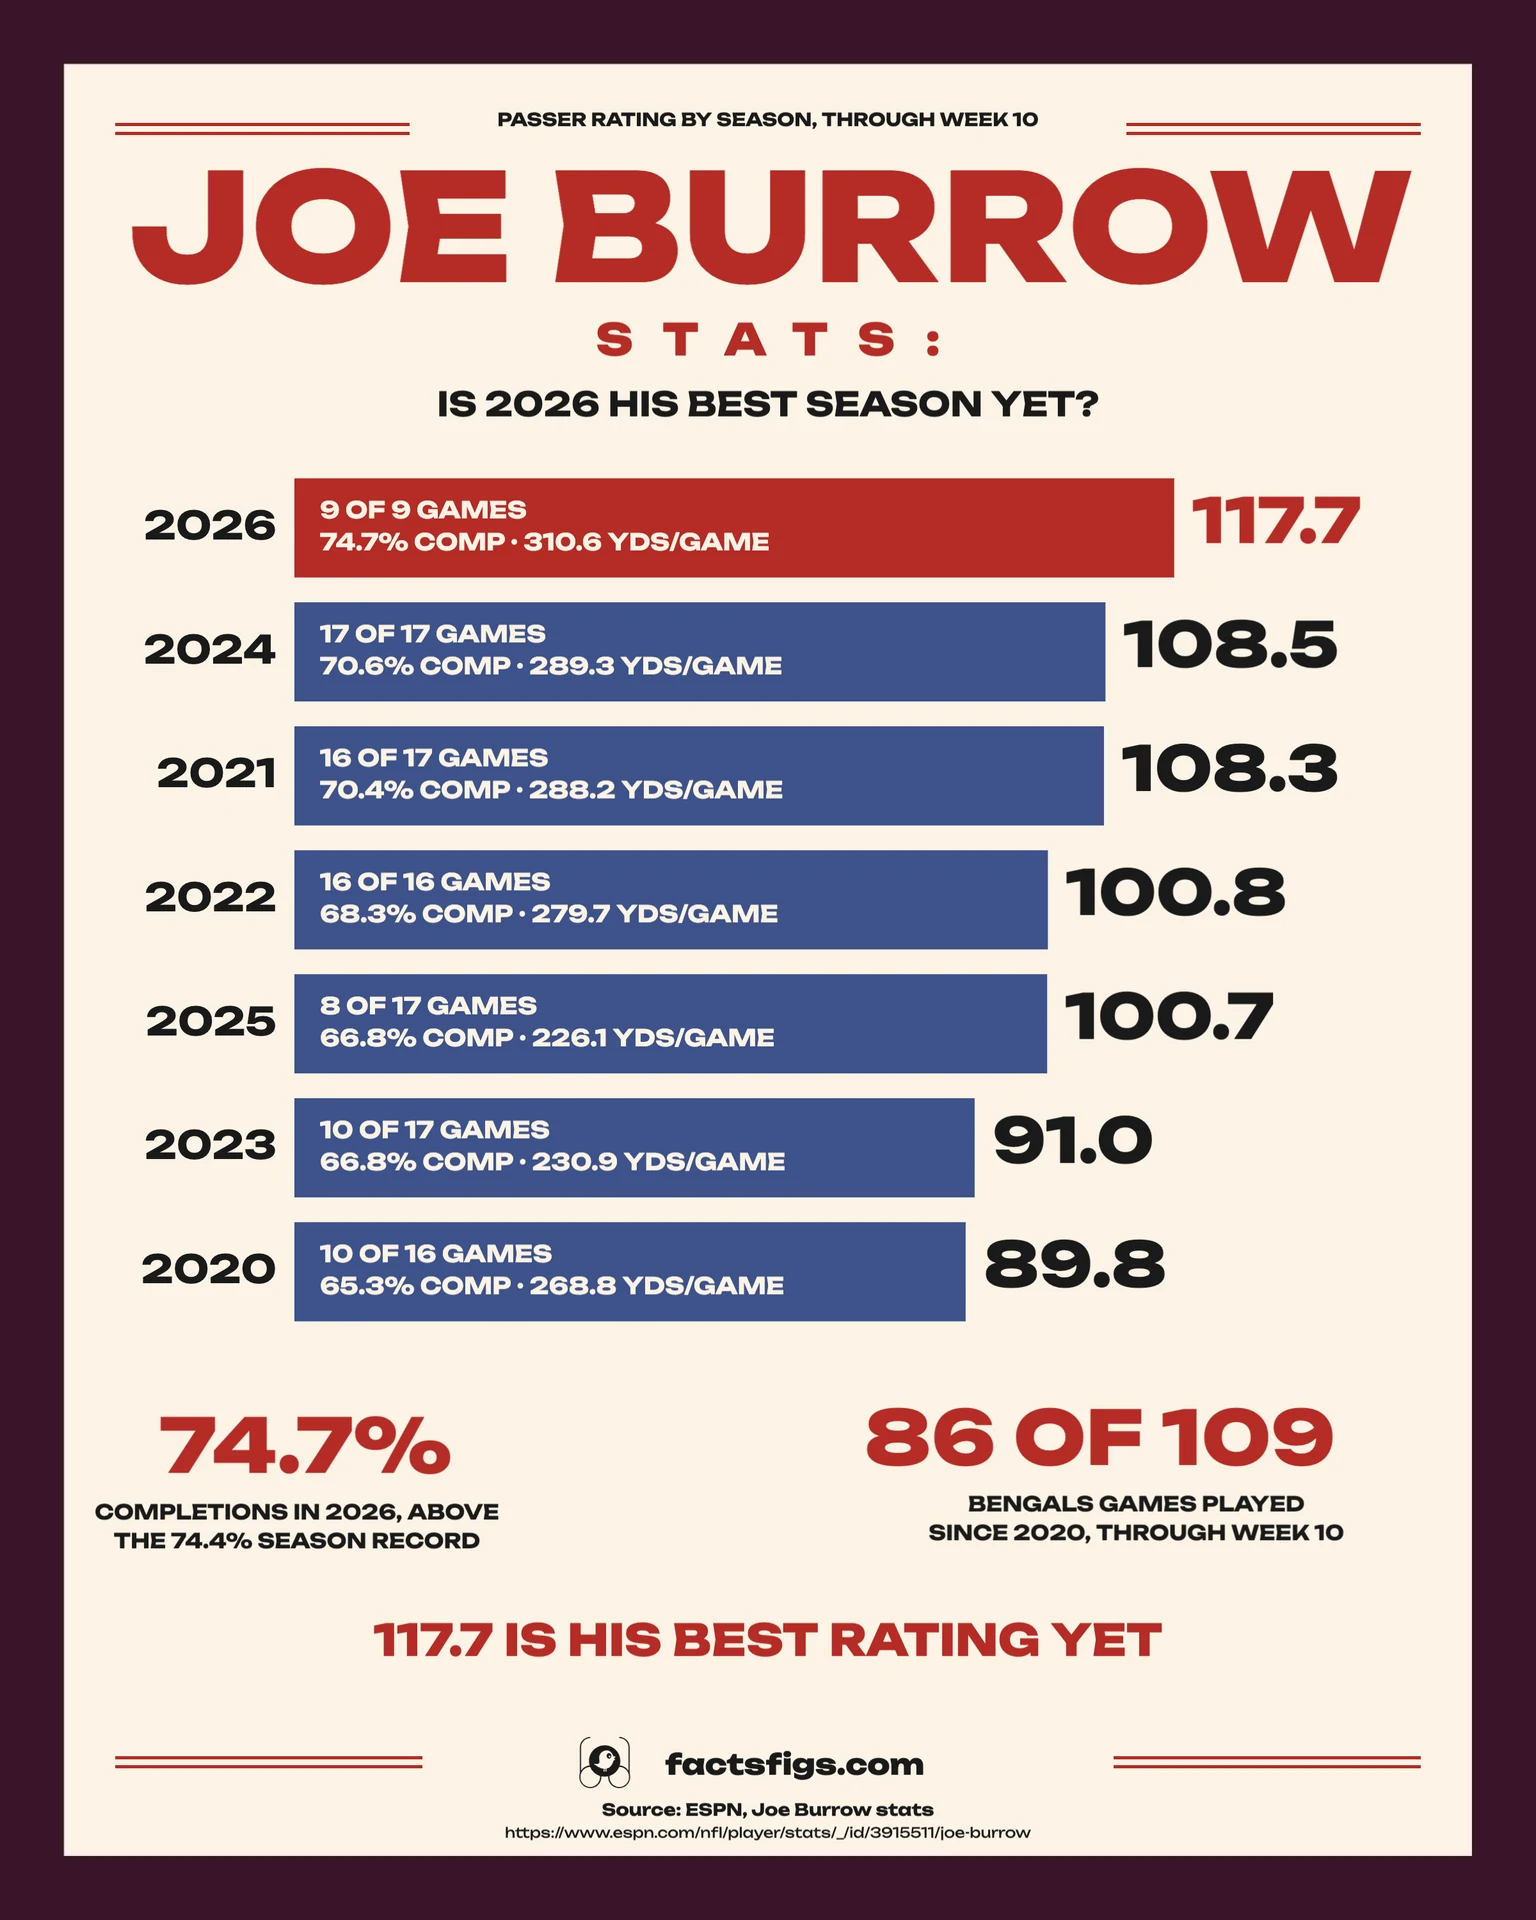
Through Week 10 of 2026, played on 15 November, Joe Burrow has completed 74.7% of his passes for 2,795 yards, 27 touchdowns and 6 interceptions, a 117.7 passer rating. That is the highest rating of his seven seasons, ahead of 108.5 in 2024 and 108.3 in 2021, and it is his best mark on six of the seven rate and per-game measures this post compares.
The catch is the sample. Nine games is not a season, and Burrow has played 86 of the Bengals' 109 games since 2020.
Figures are regular season only, through Week 10 of 2026, and they change every Sunday.
! What the Data Shows:
•
The Best Rating He Has Had:117.7 against a previous best of 108.5.
•
Above the Completion Record:74.7% so far, against the 74.4% season record.
•
Availability Is the Catch:86 of 109 Bengals games played since 2020.
? Key Numbers:
•
2026 Passing Yards Per Game:310.6, up from 289.3 in 2024
•
Career Passer Rating:102.9, second all-time
•
2026 Sack Rate:4.5%, down from 8.9% in 2021
•
Bengals Record:7-2 after Week 10
On most rate stats Burrow has never looked better, and the gap to his old best is wide. What nobody can say yet is whether nine games will hold over seventeen. His own history says availability has been the variable that moved most.
Continue reading below for the full detailed article →
Overview
The Best Rate Stats of His Career, So Far
Joe Burrow stats are usually read as a career table. This post reads them as a question: is the 2026 season, through Week 10, his best? The answer depends on the measure. By passer rating, completion percentage, touchdown rate, sacks taken and yards per game, it is. By yards per attempt it is not, and by games played it cannot be yet. The table at the bottom has all seven seasons, 2020 to 2026, so the ranking can be checked against the figures behind it.
Three Numbers Behind Burrow in 2026
His rating, his completion percentage and the games he has played frame both the case for 2026 and the reason to be careful with it.
117.7: His Best Passer Rating
117.7
Burrow's 117.7 passer rating through Week 10 of 2026 is the highest of his seven seasons, 9.2 points above his previous best of 108.5 in 2024. It comes from 254 completions on 340 attempts for 2,795 yards, 27 touchdowns and 6 interceptions. Since the Week 6 bye his rating over four games is 133.3, against 104.4 in the first five.
74.7%: Completions, Above the Record
74.7%
Burrow has completed 74.7% of his passes in 2026, above Drew Brees' single-season record of 74.4% from 2018 and 4.1 points above his own best of 70.6% in 2024. A record needs a full season, and Burrow has played nine of 17 games, so for now the figure is a pace to watch rather than a record.
86 of 109: Games Played Since 2020
79%
Since 2020 Burrow has played 86 of the Bengals' 109 games, or 79%. A torn knee ligament cost him six games in 2020, a rest game one in 2021, a torn wrist ligament seven in 2023 and toe surgery nine in 2025. His seasons without a missed game, 2022, 2024 and 2026, rank fourth, second and first by rating.
The 2026 Season by the Numbers
2,795 Passing YardsSecond in the NFL, per ESPN, after nine games.
27 Touchdown PassesFirst in the NFL, per ESPN, against 6 interceptions.
7-2 Bengals RecordAfter the 38-18 win over Pittsburgh on 15 November.
The Ranking
His Seven Seasons, Ranked by Passer Rating
Passer rating folds four things into one number on a 0 to 158.3 scale: completion percentage, yards per attempt, touchdown rate and interception rate. It ignores sacks, rushing and the rest of the offense, so it measures passing efficiency and nothing else. By that measure 2026 leads at 117.7, then 2024 at 108.5 and 2021 at 108.3.
The lower half is 2022 at 100.8, 2025 at 100.7, 2023 at 91.0 and his rookie year, 2020, at 89.8. The top three are separated from the next four by about 7.5 points, and 2026 sits 9.2 points clear of 2024, the previous best. Each of those seasons comes with a different number of games, which is why the chart prints the games played inside every bar.
The Comparison
Where 2026 Beats His Own Best Seasons
He completes 74.7% of his passes against a previous best of 70.6% in 2024. Touchdowns are 7.9% of his attempts against 6.6% in 2024 and 2025. He averages 310.6 passing yards a game against 289.3 in 2024, and 3.0 touchdown passes a game against 2.5. His sack rate is 4.5% of dropbacks, below the 6.2% of 2023 and 2025.
Two measures go the other way. His 8.2 yards per attempt is below the 8.9 of 2021, and his interception rate of 1.8% is above the 1.4% of 2024. The season is also back-loaded. Over the first five games his rating was 104.4 on 71.4% completions. Over the four since the Week 6 bye it is 133.3 on 78.8%, with 16 touchdowns and 3 interceptions. That split is cut after the fact, on four games, and explains nothing by itself.
The Context
How 2026 Compares With the Record Books
Drew Brees holds the single-season completion record at 74.4%, set in 2018. Burrow is at 74.7% after nine games, and the record needs a full season of 17. On passer rating the single-season record is Aaron Rodgers' 122.5 from 2011. On the list of league-leading seasons, a 117.7 would rank sixth, behind Rodgers twice, Peyton Manning, Lamar Jackson and Nick Foles, and ahead of Ryan Tannehill's 117.5 from 2019.
The league table on ESPN, which carries no date stamp, has Burrow first in touchdown passes with 27, second in yards with 2,795 and first in ESPN's own QBR metric at 82.0. His career passer rating of 102.9, with at least 1,500 attempts, is second all-time behind Brock Purdy's 105.8 and ahead of Jackson at 102.7, Rodgers at 101.6 and Patrick Mahomes at 101.1.
The Catch
Why Games Played Is the Variable That Moves
The Bengals have played 109 games since 2020 and Burrow has played 86 of them. He missed six in 2020 after a knee injury in Week 11, one in 2021 when he sat out Week 18 to rest before the playoffs, seven in 2023 after a torn ligament in his right wrist and nine in 2025 after turf toe surgery. He was activated from injured reserve on 26 November 2025 and played eight games that year.
Only three of his seasons have no missed game: 2022, in which the Bengals played 16 games because their Week 17 meeting with Buffalo was ruled no contest, then 2024 and 2026. Their ratings rank fourth, second and first. The pattern is consistent with a quarterback who is better when he plays every week, but three seasons cannot prove it, and 2025 shows he can rate 100.7 in a shortened year.
The Protection
Sacks Taken Have Roughly Halved Since 2021
In 2021 Burrow was sacked 51 times, the most in the league, which was 8.9% of his dropbacks, and the 2021 playoffs added a record 19 more. In 2026 he has been sacked 16 times in nine games, 4.5% of his dropbacks and 1.8 a game, against 3.2 a game in 2021. Sack rate here is sacks divided by attempts plus sacks.
The numbers show the fall but not the reason. Pass protection, how quickly he gets the ball out and the plays being called all feed into it, and none of them is in a season stat line. It is also lower than the 7.3% of his rookie year and the 6.9% of 2024, so the 2026 figure is the lowest of his career by about 1.7 points.
The Limits
What Nine Games Cannot Show
Nine games is a small sample, and a hot stretch can make a rate stat look better than the season that follows it. This post did not compare his first nine games in earlier years with 2026, because game-by-game data for those seasons was not read. It also does not project the season. The 2026 figures are through 15 November and will have changed by the time Washington plays the Bengals on 23 November.
Passer rating is one measure. ESPN's QBR, which has Burrow first at 82.0, counts sacks, rushing and the situation of each play, and the two can disagree. Nothing here ranks Burrow against other quarterbacks for an award, and nothing here checks his health after Week 10.
The Verdict
The Best Rate Season So Far, Not Yet a Season
Through Week 10, 2026 is Joe Burrow's best season by passer rating, completion percentage, touchdown rate, sack rate and yards per game, and it is above the single-season completion record. It is also nine games long, and he has missed 23 of the Bengals' 109 games since 2020.
The test is the rest of the schedule. If the rating stays near 117 through January, this becomes the best season of his career by a wide margin. If it drifts toward 108, it will look like his 2024, and the extra gain was a nine-game stretch.
The Full Data Table
Joe Burrow Stats by Season, 2020 to Week 10 of 2026
Regular season passing for each of Burrow's seven seasons and his career. Games is games played of the Bengals' games that season. 2026 runs through Week 10, played 15 November 2026.
2020
10 of 16
2-7-1
65.3
2,688
6.65
13
5
89.8
7.3
268.8
2021
16 of 17
10-6
70.4
4,611
8.87
34
14
108.3
8.9
288.2
2022
16 of 16
12-4
68.3
4,475
7.38
35
12
100.8
6.3
279.7
2023
10 of 17
5-5
66.8
2,309
6.33
15
6
91.0
6.2
230.9
2024
17 of 17
9-8
70.6
4,918
7.54
43
9
108.5
6.9
289.3
2025
8 of 17
5-3
66.8
1,809
6.98
17
5
100.7
6.2
226.1
2026 (Wk 10)
9 of 9
7-2
74.7
2,795
8.22
27
6
117.7
4.5
310.6
Career
86 of 109
50-35-1
69.1
23,605
7.50
184
57
102.9
6.8
274.5
Sack rate is sacks divided by attempts plus sacks. Yards per game and the rates are FactsFigs calculations from ESPN and NFL.com figures, checked against Wikipedia for 2020 to 2025. 2022 has 16 Bengals games because the Week 17 game against Buffalo was ruled no contest.
The data behind this story comes from the player statistics pages of ESPN and NFL.com, read on 16 November 2026 and checked against each other and against Wikipedia's Joe Burrow article for 2020 to 2025. Records and rankings come from Wikipedia's lists of NFL career and annual leaders, and the injury history from Wikipedia's account of his career. The table is shown on the page and is not offered as a download. The rates and per-game figures are FactsFigs calculations.
FactsFigs reviews, cleans, and cross-checks every source dataset before shaping it into a data story. Each visualization is created and designed in FactsFigs Design Studio - an internal tool developed and owned by FactsFigs - and is the original work of a FactsFigs author, not an AI-generated copy of any existing graphic. Individual assets within a visual may or may not be produced with AI tools, but the design of the visual itself is solely FactsFigs' own.
Figures are estimates at the time of publication, provided for information only - nothing here is financial advice or a guarantee of accuracy.
Last verified: 16 Nov 2026
The charts in this article were built with our own publishing system. See what it does →