Best-Selling Final Fantasy Games: Sales by Game

By Saif Ur Rahman Published 12 Oct 2026 Updated 12 Oct 2026
Gaming 1 views
FactsFigs
0 shares

TL;DR: Which Final Fantasy Game Sold the Most?

Five games counted twice, one safe winner and one pair that cannot be ranked

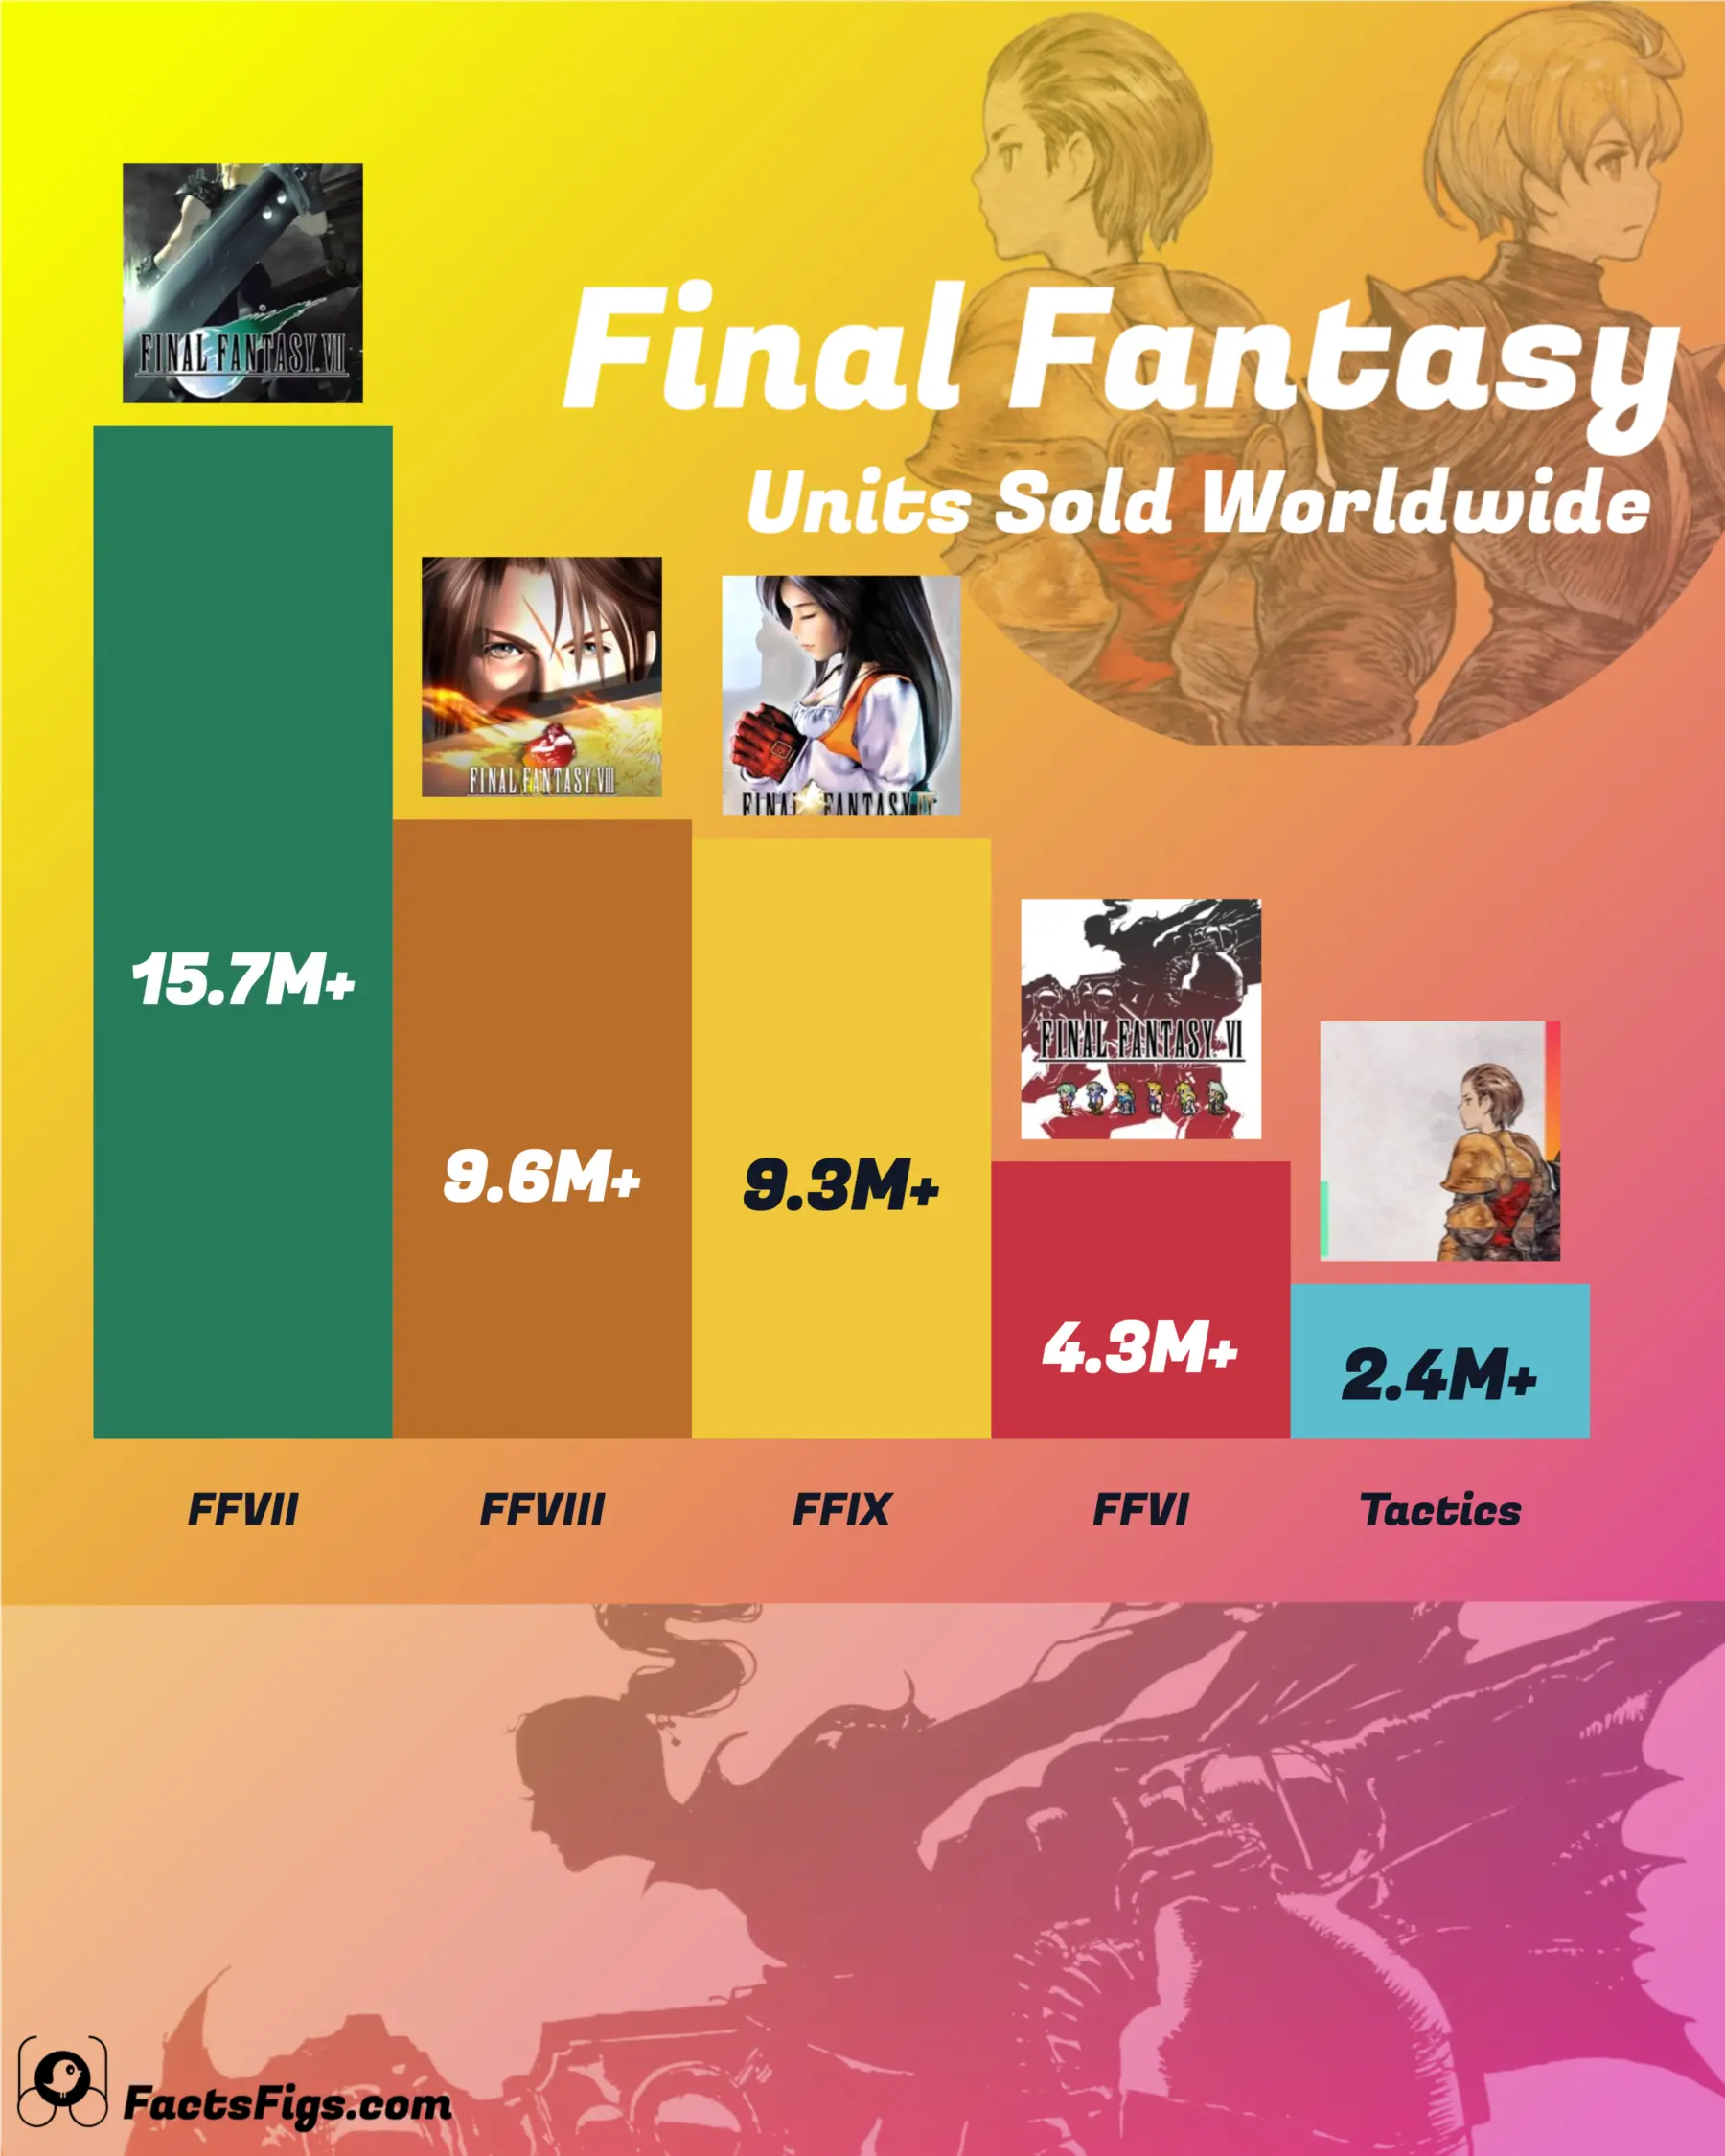
Final Fantasy VII is the best-selling Final Fantasy game with a stand-alone official figure: Square Enix says 15.7 million or more, in a news release of 3 September 2026. Five games have been counted twice, as of 31 March 2003 and again between 2018 and 2026. The later figure is 6.36 million higher for VII and 4.22 million higher for IX, and under 1.5 million higher for the other three. VIII (9.6 million or more, September 2019) sits 0.3 million above IX (9.3 million or more, January 2026), but the official record cannot say which is ahead today. Every later figure is an 'or more' floor on its own date, and Final Fantasy X cannot be ranked because Square Enix states it only together with X-2, at 20 million or more.

! What the Two Counts Reveal:

  • •
    Uneven Growth: IX is up 1.83 times since 2003, VII 1.68 times.
  • •
    Different Ages: Latest figures were published from 2018 to 2026.
  • •
    Totals Stay Out: The series total and XIV accounts are other measures.

? The Numbers Behind the Ranking:

  • •
    Final Fantasy VII: 9.34M shipped (2003) to 15.7M+ (Sep 2026)
  • •
    VIII Against IX: 9.6M+ (Sep 2019) against 9.3M+ (Jan 2026), 0.3M apart
  • •
    The Five in 2003: 28.32M of the 45.66M shipped across 12 Final Fantasy titles

The figures surfaced in announcements and promotional pages, not in a maintained table. The ranking is a set of dated floors, and the one order the record cannot support is VIII against IX.

Continue reading below for the full detailed article →

Overview

Final Fantasy Sales by Game: Why Only Five Games Qualify

Square Enix keeps no table of Final Fantasy sales by game. The only title-level cumulative table we found in its investor record is slide 27 of a February 2004 roadshow deck, which lists 34 titles as of 31 March 2003. Everything since is scattered across press releases and promotional pages. Five games therefore have what the rest do not, a shipment figure from that slide and a later official count: Final Fantasy VII, VIII, IX, VI and Tactics. This story ranks them on the latest figure, dates every bar, treats each number as a floor, and shows the arithmetic wherever a number is ours.

The Three Numbers That Define the Five-Game Ranking

A clear leader, a pair that cannot be ordered and the fastest grower, each measured against Square Enix's own 2003 count.

Best-Selling Game · 15.7M+

15.7M+ Copies

Square Enix's news release of 3 September 2026 says Final Fantasy VII has recorded 15.7 million or more cumulative sales worldwide, counted as package shipments plus download sales. That is 6.36 million above the 9.34 million shipped by 31 March 2003. It is the largest stand-alone figure we found for any Final Fantasy release, and a floor.

The Open Question · 0.3M

0.3M Gap

Final Fantasy VIII is credited with 9.6 million or more, 0.3 million above IX's 9.3 million or more. But VIII's figure was published on 3 September 2019 and IX's was repeated on 27 January 2026, so the gap compares a seven-year-old floor with one under nine months old. The official record cannot say which game leads today.

The Biggest Multiple · 1.83x

1.83x

Final Fantasy IX rose from 5.08 million shipped by 31 March 2003 to 9.3 million or more, 4.22 million higher and 1.83 times, the largest multiple of the five. Square Enix's own figure moved from 8.9 million or more on 26 September 2025 to 9.3 million or more on 11 December 2025, and gave no reason for the rise.

Final Fantasy VII by the Numbers

  • 9.34M Shipped by March 2003 9.34 M Japan 3.90 million and abroad 5.44 million, from the one title-level table in Square Enix's investor record, as of 31 March 2003.
  • 6.36M Higher Since 2003 6.36 M 15.7 minus 9.34, or 1.68 times. Our subtraction, between a 2003 shipment count and a later floor that adds downloads.
  • 27.2M+ With the Compilation 27.2 M+ A separate figure of 4 October 2023 that includes compilation works, with no list of what is inside. Never added to the 15.7M+.

How the Five Were Chosen

Why Only Five Games Have Two Official Counts

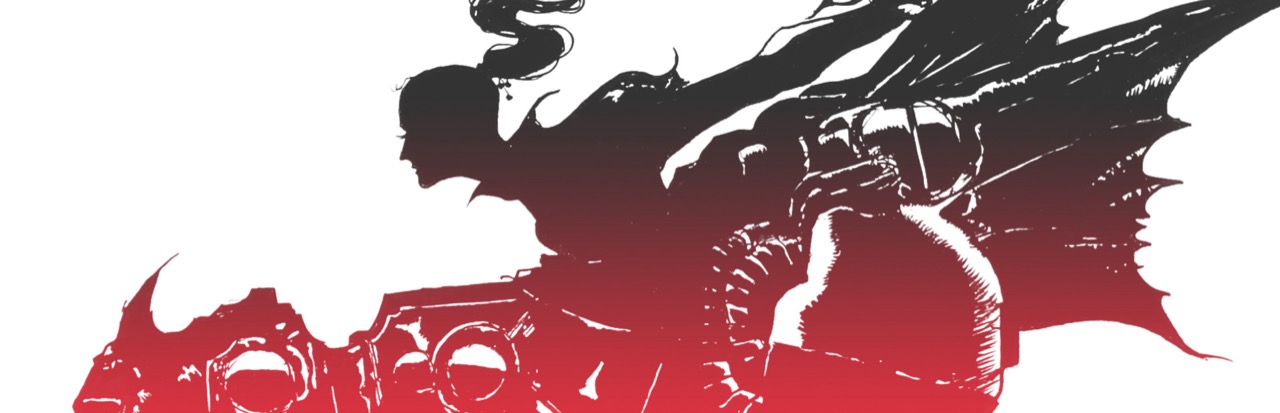
Final Fantasy VI banner art: a stylised black and red silhouette of Terra riding Magitek armour, with wide ribbed wings spreading across a white background.

Of the 62 console, handheld and PC Final Fantasy releases we catalogued, 21 carry a dated worldwide sales figure, and only three of those were published in the twelve months before 11 October 2026. Both counts are ours. The results decks we read give aggregate units by region, never a title split. The exception is slide 27 of a roadshow deck dated 2 to 4 February 2004, which lists 34 titles with worldwide shipments above one million as of 31 March 2003. Twelve are Final Fantasy games, and our sum of the twelve printed rows is 45.66 million. Five of them also have a later official figure, and those five account for 28.32 million of the 45.66 million, or 62.0%. The pairing is the whole reason for the scope. The 2003 figure counts shipments, while the later ones are worded differently: three say shipments plus download sales, VIII says only 'sales' and Tactics says shipments. Each difference is therefore a floor on what happened since, not a clean copies-sold-since measure. Final Fantasy X is the notable absence: third among the Final Fantasy rows on the 2003 slide at 5.89 million, it has had no stand-alone figure since January 2004. The same slide lists Kingdom Hearts at 3.30 million.

Then and Now

What Each Game Added Between the Two Counts

Final Fantasy IX banner art: Garnet in profile with her eyes closed and her red-gloved hands clasped, the spires of Alexandria castle and a pale moon behind her.

Final Fantasy VII went from 9.34 million shipped as of 31 March 2003 (Japan 3.90 million, abroad 5.44 million) to 15.7 million or more in Square Enix's releases of 6 June and 3 September 2026: 6.36 million higher, or 1.68 times. It leaves out REMAKE, REBIRTH and the family figure described below. Final Fantasy IX went from 5.08 million to 9.3 million or more, 4.22 million higher and 1.83 times, the largest multiple of the five. The figure sits on the game's 25th-anniversary news pages: 8.9 million or more on 26 September 2025, 9.3 million or more on 11 December 2025, repeated on 27 January 2026. Square Enix gives no reason. Final Fantasy VIII went from 8.15 million to 9.6 million or more, 1.45 million higher and 1.18 times. The 9.6 million appeared on the launch page of the 2019 Remastered edition and was still repeated in March 2021, so it describes the original game before the remaster had sold anything. Final Fantasy VI went from 3.48 million to 4.3 million or more, 0.82 million higher and 1.24 times. Square Enix published the figure on 18 January 2019 and dated it 'as of September 2018', before the 2022 Pixel Remaster. None of the six-game Pixel Remaster total is credited to VI here. Final Fantasy Tactics barely moved: 2.27 million to 2.4 million or more, 0.13 million higher and 1.06 times. The figure was printed on 20 November 2018 in a sale blurb for the mobile version of The War of the Lions, counts shipments only and carries no as-of date.

The Footnote

Why Final Fantasy VIII and IX Cannot Be Ranked Today

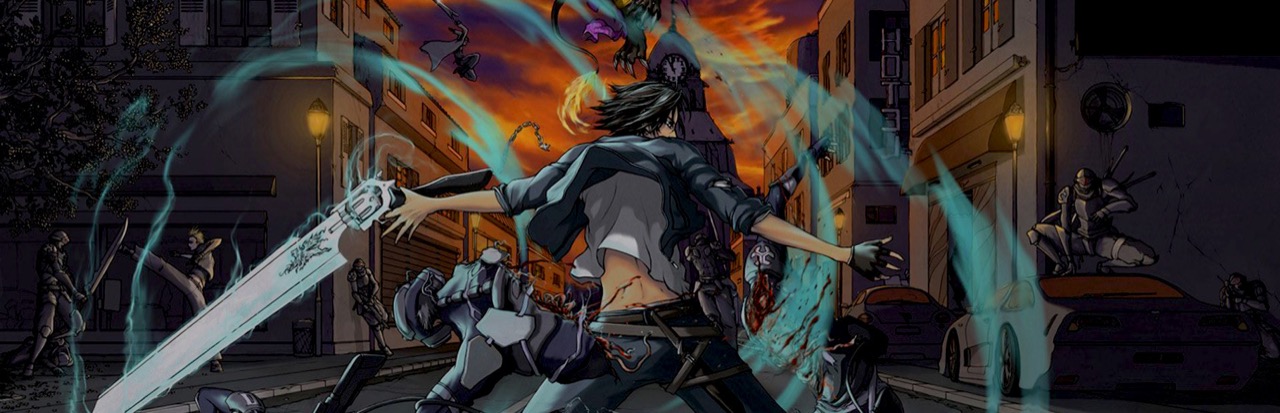
Final Fantasy VIII banner art: Squall seen from behind with his gunblade drawn, trailing teal light through a street fight under an orange sunset and a clock tower.

On the page, VIII leads IX by 0.3 million, 9.6 million or more against 9.3 million or more, and the bars follow that order. It is a reading of two floors with very different ages. VIII's figure was published on 3 September 2019, more than seven years ago. IX's was repeated on 27 January 2026, less than nine months ago. The official record cannot say which game is ahead today. IX is the one that has been moving. Square Enix printed 8.9 million or more for it on 26 September 2025 and 9.3 million or more on 11 December 2025, a rise of 0.4 million in under eleven weeks, larger than the 0.3 million lead VIII is credited with. In 2003 VIII led by 3.07 million on a single date (8.15 million against 5.08 million, our subtraction). Since then IX's figure has risen 4.22 million, while VIII's 1.45 million stops seven years earlier. The wording differs too. VIII's 2019 line gives 9.6 million 'sales' and does not define them, while IX's states shipments plus download sales. Neither is a ceiling: 'or more' means the true totals are unknown.

The Headline Claim

Is Final Fantasy VII the Best-Selling Final Fantasy Game?

Final Fantasy VII banner art: Cloud with the Buster Sword over his shoulder, lit green, standing against the pipes and towers of a Shinra Mako reactor under a smoky sky.

Almost, and the gap in the claim is Final Fantasy X. Square Enix says X and X-2 together have passed 20 million package shipments and downloads (1 July 2026), and it has never published a lifetime figure for X-2 alone. A floor on the pair bounds neither game, so the record cannot say whether X on its own is above or below VII's 15.7 million. X alone was last stated in January 2004, at about 6.5 million. The defensible claim is narrower: Final Fantasy VII is the best-selling Final Fantasy game with a stand-alone official figure. The 15.7 million or more also leaves out VII's relatives. Square Enix separately states 27.2 million or more for Final Fantasy VII 'including compilation works' (4 October 2023), without listing what is inside, and counts REMAKE and REBIRTH as their own games, REBIRTH with no official figure at all. None of them is added to the 1997 game.

Measures That Do Not Compare

Why Series Totals, MMOs and Remaster Bundles Stay Out

Final Fantasy Tactics banner art: two young knights in painted armour standing back to back in profile, on a pale textured ground with blocks of gradient colour.

Square Enix's corporate releases repeat a series total, 212 million or more in the release of 3 September 2026. It has no as-of date and mixes shipments with downloads, while each game's figure has its own date and basis, so no game is shown as a share of it. A share built from a floor over a floor would look precise and mean nothing. Online games measure something else. Square Enix reports Final Fantasy XIV as more than 30 million registered accounts (29 August 2025): accounts, not copies. It reports Final Fantasy XI in players and paying subscribers. Neither belongs next to a units figure. Pixel Remaster is the third trap. The six remastered games are counted together at 6 million or more (18 December 2025), with no split by game. Dividing it would invent six numbers nobody published.

The Full Data Table

Final Fantasy Sales by Game: Five Games, Two Official Counts

Each game's shipments as of 31 March 2003 beside its latest official figure, with the date Square Enix published it and what the wording does and does not count.

FINAL FANTASY VII19979.3415.7 or more3 Sep 2026+6.361.68x
FINAL FANTASY VIII19998.159.6 or more3 Sep 2019+1.451.18x
FINAL FANTASY IX20005.089.3 or more27 Jan 2026+4.221.83x
FINAL FANTASY VI19943.484.3 or more18 Jan 2019+0.821.24x
FINAL FANTASY TACTICS19972.272.4 or more20 Nov 2018+0.131.06x

Latest figures are 'or more' floors, translated from Square Enix's Japanese where needed. Each figure covers the original game only: VII excludes REMAKE and REBIRTH, VIII excludes the 2019 Remastered, VI predates the 2022 Pixel Remaster, and Tactics excludes War of the Lions and The Ivalice Chronicles, so those four understate what the title has sold in all its versions. The basis is not uniform either: VII, IX and VI are shipments plus downloads, VIII says only 'sales', and Tactics says shipments. Difference and multiple are our arithmetic (later minus 2003, later divided by 2003) and mix a 2003 shipment count with a later floor, so they are not copies sold since 2003. Rows follow the latest figure, which is not a ranking at a common date: VIII is above IX by 0.3 million on a figure seven years older, so the official record cannot say which leads today. Final Fantasy X has no later stand-alone figure and is not shown.

What Moves Next

What Would Settle VIII Against IX

Square Enix's next results are listed on its IR calendar for November 2026 and February 2027, but its results decks give aggregate units and no title split, so they will not settle it. Only a per-game announcement can. The figures in this ranking all surfaced in news releases and promotional pages, so a fresh VIII or IX figure is likely to appear alongside promotion of that game, not on a schedule. Either would turn a footnote into a ranking.

Final Fantasy VII is the least likely to change, and not only because it leads. Its 15.7 million or more was identical in the releases of 6 June and 3 September 2026. A REBIRTH milestone would be the likeliest new number from the VII family, and it would be a different game's figure.

Data Source and Attribution

Square Enix

Every figure on this page comes from Square Enix itself: its corporate news releases, its FINAL FANTASY portal announcements, its investor disclosures, and one investor roadshow deck (February 2004, slide 27, as of 31 March 2003, read from an Internet Archive capture). Rather than list a link for each one, the date Square Enix published each figure is printed beside that figure in the table above, which is the part that matters for reading them. No estimate sites or trackers were used, and full credit goes to Square Enix. Several announcements are in Japanese, and FactsFigs translated the wording.

Square Enix's terms of use do not permit copying its site content without written approval, so figures are quoted with source and date and no table download is offered. Our own arithmetic is marked where it appears: the differences and multiples, the 28.32 and 45.66 million sums, the 3.07 million gap and IX's 0.4 million rise. Release years follow Square Enix's announcements, except VIII's 1999, a pointer from Wikipedia.

FactsFigs reviews, cleans, and cross-checks every source dataset before shaping it into a data story. Each visualization is created and designed in FactsFigs Design Studio - an internal tool developed and owned by FactsFigs - and is the original work of a FactsFigs author, not an AI-generated copy of any existing graphic. Individual assets within a visual may or may not be produced with AI tools, but the design of the visual itself is solely FactsFigs' own.

Figures are estimates at the time of publication, provided for information only - nothing here is financial advice or a guarantee of accuracy.

Last verified: 12 Oct 2026

The charts in this article were built with our own publishing system. See what it does →