Did the 48-Team World Cup Produce More Goals Per Match?

By Saif Ur Rahman Published 18 Nov 2026 Updated 18 Nov 2026
Sports World 0 views
FactsFigs
0 shares

TL;DR: Did the 48-Team World Cup Produce More Goals Per Match?

Somewhat, and mostly in the group stage

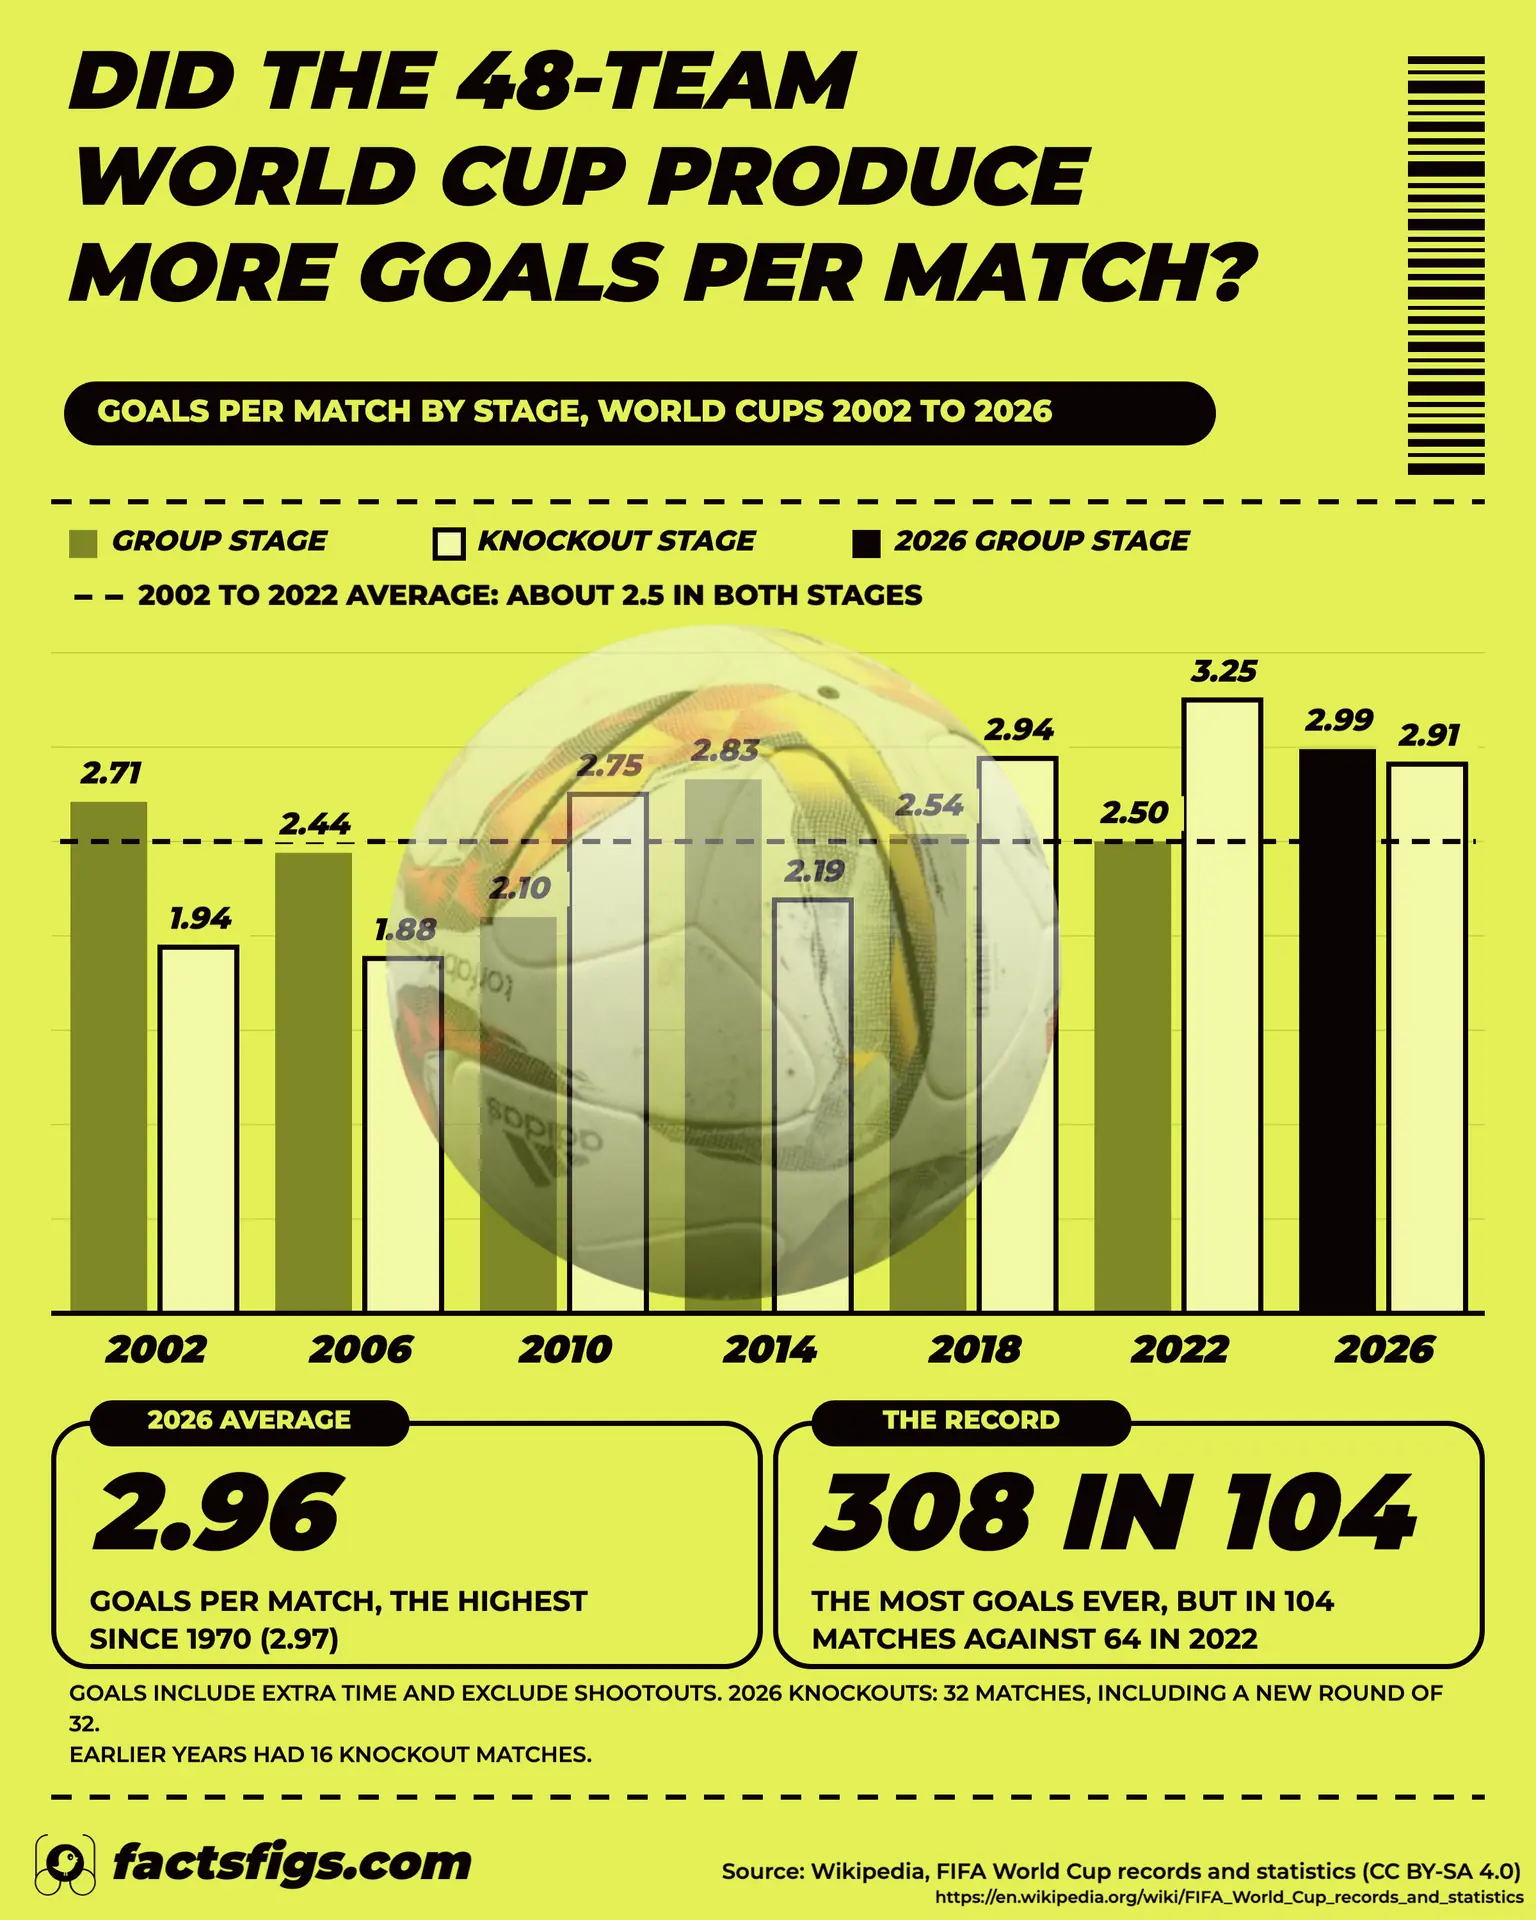
The 2026 World Cup scored 308 goals in 104 matches, 2.96 per match. That is the most goals ever, but only the eighth-highest average of 23 World Cups, and the highest since 1970, when it was 2.97. The rise is in the group stage: 2.99 goals per match across 72 matches, against 2.50 in 2022 and 2.52 across the six World Cups from 2002 to 2022. The knockouts did not jump: 2.91, against 3.25 in 2022. One group match in four, 25.0%, was won by three goals or more, against 14.2% before. Goals include extra time and exclude penalty shootouts.

! What the Data Shows:

  • •
    A Record Total, Not a Record Rate: 308 goals against 172 in 2022, but in 104 matches against 64.
  • •
    The Group Stage Rose: 2.99 goals per match against 2.50 in 2022.
  • •
    The Knockouts Did Not: 2.91 against 3.25 in 2022.

? Key Numbers:

  • •
    Goals Per Match, 2026: 2.96, eighth of 23 World Cups
  • •
    Group Stage, 2026 and 2002 to 2022: 2.99 against 2.52
  • •
    Group Matches Won by 3 or More: 25.0% against 14.2%
  • •
    Third-Place Match: England 6, France 4: 10 goals

The 48-team World Cup scored more goals per match than any since 1970, but the gain sits in the group stage, where 16 more teams played. The knockouts, which are the same kind of football as before, scored at about their usual rate. That pattern fits a bigger field creating lopsided matches, though the data cannot prove it.

Continue reading below for the full detailed article →

Overview

A Record Total Is Not a Record Rate

By total, 2026 is the highest-scoring World Cup ever, and it was always going to be: the 48-team format played 104 matches instead of 64. The fair question is about the rate. Did each match produce more goals? This post counts every goal in all 104 matches, compares the rate with every earlier World Cup, and then splits 2026 by stage against the six tournaments from 2002 to 2022. Spain won the final 1-0 after extra time and conceded one goal in the whole tournament, a quiet end to a loud group stage.

Three Numbers Behind the 2026 Goals

The rate, the group stage and the blowouts show how far scoring rose and where the rise sits.

2.96: Goals Per Match in 2026

2.96

Across 104 matches the 2026 World Cup scored 308 goals, 2.96 per match. That ranks eighth among 23 tournaments and is the highest average since 1970, when it was 2.97. Seven earlier World Cups averaged more, up to 5.38 in 1954. The total is a record only because 104 matches is 40 more than 2022 played.

2.99: Group-Stage Goals Per Match

2.99

The 72 group matches produced 215 goals, 2.99 per match, against 2.50 in 2022, 2.54 in 2018 and 2.83 in 2014. Across the six World Cups from 2002 to 2022 the group average was 2.52. The gap is about two standard errors, which makes it a real but borderline rise, not a settled one.

25%: Group Matches Won by Three or More

25%

Eighteen of the 72 group matches, 25.0%, were won by three goals or more, against 14.2% across the six earlier World Cups. Germany beat Curaçao 7-1 and Canada beat Qatar 6-0. Another 20 matches, 27.8%, were draws, seven of them 0-0, so the group stage had both more lopsided results and more stalemates.

The 2026 Tournament by the Numbers

  • 308 Goals in 104 Matches Against 172 goals in 64 matches in 2022.
  • 22 Teams New Since 2022 Not in the 2022 field; 6 from 2022 were absent.
  • 4 Penalty Shootouts Three in the Round of 32 and one in the Round of 16.

The Record

Most Goals Ever Is Mostly 40 Extra Matches

The 2026 World Cup beat the old goals record of 172, set in 2022, with 308. But 2022 played 64 matches and 2026 played 104, because the new format added a 16-match Round of 32 and 24 more group matches. Per match, 2026 averaged 2.96 goals, which is the eighth-highest of 23 World Cups.

Seven earlier tournaments averaged more: 1954 with 5.38, 1938 with 4.67, 1934 with 4.12, 1950 with 4.00, 1930 with 3.89, 1958 with 3.60 and 1970 with 2.97. The 2026 average is the highest since 1970 and above every one of the 13 World Cups from 1974 to 2022, the best of which was 2.81 in 1982.

The Group Stage

The Group Stage Carried the Rise

The 72 group matches produced 215 goals, an average of 2.99. In 2022 the 48 group matches averaged 2.50, in 2018 2.54, in 2014 2.83, in 2010 2.10, in 2006 2.44 and in 2002 2.71. Pooling those six tournaments gives 2.52, so 2026 sits 0.47 goals a match above them.

That gap is about two standard errors, roughly twice what chance alone would normally produce in a sample of this size. It is evidence, not proof. Measured against 2022 alone, the gap is 1.6 standard errors, which would not count by itself. FIFA's own group-stage page, written on 28 June, called the group average three per match and noted that the group stage alone had passed 2022's total of 172.

The Knockouts

The Knockouts Did Not Jump

The 32 knockout matches produced 93 goals, 2.91 per match. That is below 3.25 in 2022, about level with 2.94 in 2018 and above the 2.49 average for 2002 to 2022, though only by 1.2 standard errors. The new Round of 32 produced 42 goals in 16 matches, 2.63.

One match moves the number. England beat France 6-4 in the third-place match, 10 goals in a single game. Without it the tournament average is 2.89 and the knockout average 2.68. Four matches were settled on penalties after a draw: Germany against Paraguay, Netherlands against Morocco and Australia against Egypt in the Round of 32, and Switzerland against Colombia in the Round of 16.

The Mismatches

One Group Match in Four Was a Blowout

Eighteen of the 72 group matches, 25.0%, were won by three goals or more. Across the 288 group matches from 2002 to 2022 the share was 14.2%, a gap of about 2.2 standard errors. Germany beat Curaçao 7-1, the most lopsided result of the tournament, and Canada beat Qatar 6-0.

Draws rose as well: 20 of 72 group matches, 27.8%, against 23.3%, and seven of them finished 0-0. A bigger field produced more extreme results in both directions, which is what a wider spread of team strength would do. The data counts results, not team strength, so it cannot confirm that cause.

The Newcomers

Do the New Teams Explain the Goals?

Twenty-two of the 48 teams were not in the 2022 field, and six from 2022 were absent. Group matches that included at least one of the 22 newcomers, 54 of the 72, averaged 3.04 goals, and 27.8% of them were blowouts. The 18 group matches between teams that were also in 2022 averaged 2.83.

Both figures are well above 2022's 2.50, so the extra goals are not only a newcomer effect. But 18 matches is a small sample, and it is not a clean test, because being new since 2022 is not the same as being weak. No team-strength rating was used here.

The Limits

What the Goal Counts Cannot Show

A World Cup is one sample every four years, so a difference of two standard errors is suggestive rather than settled. The 2026 knockout stage has 32 matches and each earlier one 16, so its average is steadier but its comparisons are loose. The 1998 group stage is left out because one of its 48 matches could not be read from the source.

The counts include extra time and exclude shootouts, as FIFA's do. They say nothing about tactics, substitutions, climate or the match schedule, and none of those was tested. Averages before 1962 also describe a different game, with far fewer teams and a different style of play.

The Verdict

Somewhat More, and Mostly in the Group Stage

The 48-team World Cup did produce more goals per match than any since 1970, 2.96 against 2.69 in 2022. The rise sits in the group stage, 2.99 against 2.50 in 2022 and 2.52 for 2002 to 2022, and it came with more blowouts and more draws. The knockouts, 2.91 against 3.25 in 2022, did not follow.

The record total is real but says little: 308 goals needed 104 matches. The next World Cup under the same format will show whether 2.99 in the group stage was a feature of the bigger field or a single high tournament.

The Full Data Table

Goals Per Match at Every World Cup, 1930 to 2026

Matches, goals and goals per match for all 23 World Cups, with the group-stage and knockout-stage averages for 2002 to 2026. Group and knockout figures before 2002 were not compiled.

20261043082.962.992.91
2022641722.692.503.25
2018641692.642.542.94
2014641712.672.832.19
2010641452.272.102.75
2006641472.302.441.88
2002641612.522.711.94
1998641712.67n/an/a
1994521412.71n/an/a
1990521152.21n/an/a
1986521322.54n/an/a
1982521462.81n/an/a
1978381022.68n/an/a
197438972.55n/an/a
197032952.97n/an/a
196632892.78n/an/a
196232892.78n/an/a
1958351263.60n/an/a
1954261405.38n/an/a
195022884.00n/an/a

Showing 1-20 of 23

Page 1 of 2

Goals include extra time and exclude shootouts. 2026 group stage is 72 matches and 215 goals; knockouts 32 matches and 93 goals. 1978 is 38 matches in the source table. Stage averages are FactsFigs calculations from match results.

Data Source and Attribution

Wikipedia: FIFA World Cup records and statistics Wikipedia: 2026 FIFA World Cup

The data behind this story comes from Wikipedia's FIFA World Cup records and statistics for tournament totals, and from the match results on Wikipedia's pages for the group stage, knockout stage and final of each World Cup, read on 18 November 2026. The dataset is available under CC BY-SA 4.0, and full credit for collecting and maintaining the underlying records goes to Wikipedia's contributors. FIFA's group-stage report of 28 June 2026 was used as a cross-check. The stage averages, shares and significance figures are FactsFigs calculations.

FactsFigs reviews, cleans, and cross-checks every source dataset before shaping it into a data story. Each visualization is created and designed in FactsFigs Design Studio - an internal tool developed and owned by FactsFigs - and is the original work of a FactsFigs author, not an AI-generated copy of any existing graphic. Individual assets within a visual may or may not be produced with AI tools, but the design of the visual itself is solely FactsFigs' own.

Figures are estimates at the time of publication, provided for information only - nothing here is financial advice or a guarantee of accuracy.

Last verified: 18 Nov 2026

The charts in this article were built with our own publishing system. See what it does →