TL;DR — How Much Identity Theft Involves Credit Cards, State by State?
39.6% nationally, 26.7% to 50.1% by state, and a headline that needs a footnote
Credit cards appear in 449,032 of the 1,135,291 identity theft reports the FTC logged in 2024: 39.6%, nearly 2 in 5. These are complaints people chose to file: a federal survey found only 1.3% of 2021 victims contacted the FTC.
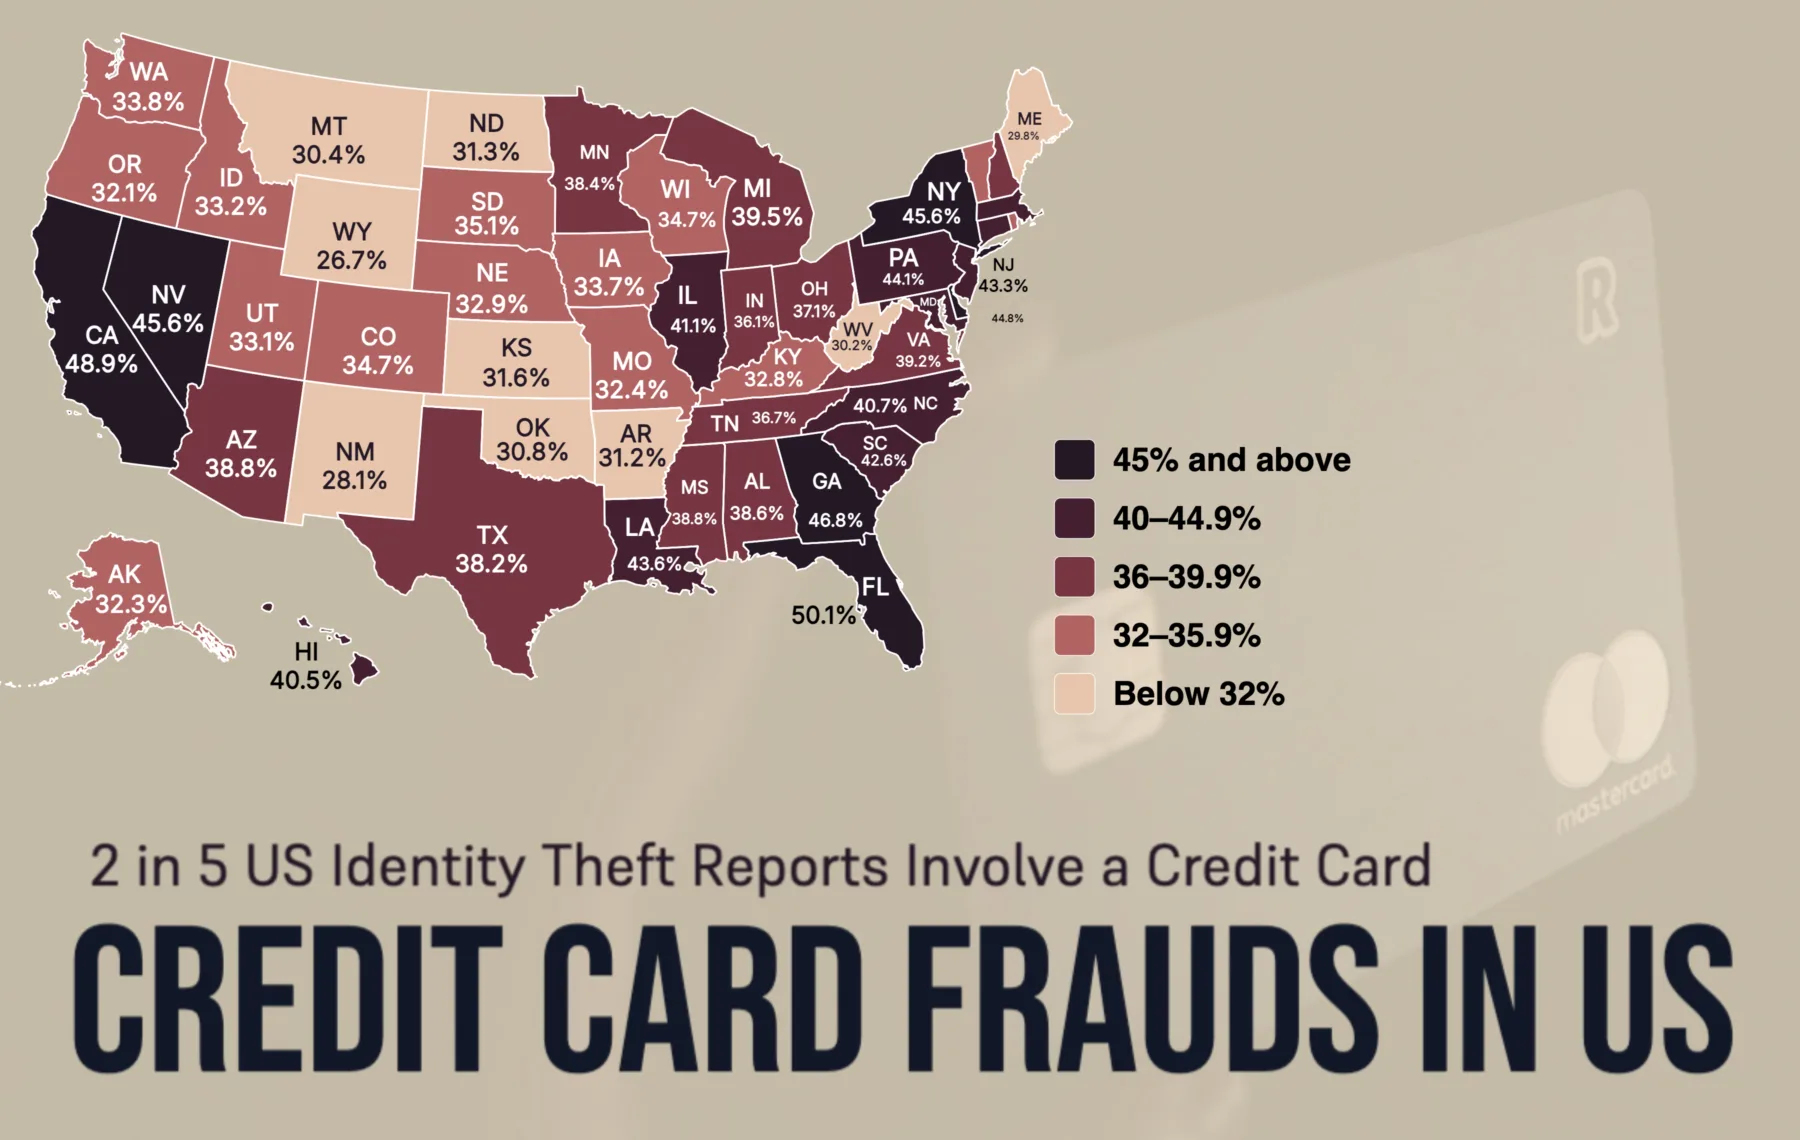
By state the share runs from 26.7% in Wyoming to 50.1% in Florida, with California at 48.9% and DC at 48.7%. Yet only 17 of the 51 mapped regions sit above 39.6%. State tables cover state-located reports, which pool to 42.6%.
The share is far less tied to population than raw counts, but not immune. Nobody has shown why Florida and Georgia lead.
! What to Keep in Mind Before Quoting a State:
•
Two Bases · 39.6% vs 42.6%:The national figure counts every report; the map counts only those the FTC could place in a state. Both are correct, and they answer different questions.
•
Reports, Not Crimes · 1.3% Contact the FTC:A high share can mean more card fraud or more card victims who know to report it. The data cannot separate the two.
•
A Thin Bottom · 5 Regions Under 1,000 Reports:Wyoming's 26.7% rests on 186 of 697 reports. A swing of 25 reports moves it by about 3.6 points.
? The Numbers Behind the Map:
•
National card share, 2024:39.6%: 449,032 of 1,135,291 identity theft reports
•
50 states and DC, state-located only:42.6%: 422,070 of 990,097 reports
•
Regions above the national 39.6%:17 of 51, with 12 above 42.6%
Read the map as a comparison between states, not as a gap to the national headline. Florida and California lead, Wyoming and New Mexico trail, and the ranking in between shifts from year to year.
Continue reading below for the full detailed article →
Overview
Reports, Not Incidents: What This Share Actually Counts
Every figure here comes from the Federal Trade Commission's Consumer Sentinel Network, which rests on unverified reports filed by consumers rather than on a survey. So when 449,032 of 1,135,291 identity theft reports in 2024 involve a credit card, that is 39.6% of the complaints, not of the crimes. The best independent yardstick, a Bureau of Justice Statistics survey, estimated 23.9 million identity theft victims in 2021, a year in which the FTC logged 1.43 million reports. Only 1.3% of those victims contacted the FTC. Sentinel is a slice shaped by who knows to report, and a state's share can reflect that as much as the fraud itself.
The Three Numbers That Frame This Map
The national share, the gap between the highest and lowest states, and how few victims report to the FTC: three figures that set the limits of every state comparison that follows.
39.6% of Identity Theft Reports Involve Credit Cards
39.6%
Credit cards feature in 449,032 of the 1,135,291 identity theft reports in the FTC's 2024 data, nearly 2 in 5. New-account and existing-account card fraud both count, and a report tagged with several theft types is counted once in the total. Across the 2022, 2023 and 2024 Data Books the national share held between 39.6% and 40.2%.
23.4 Points Separate Florida From Wyoming
23.4 points
Florida's 57,997 card reports out of 115,840 give it 50.1%, while Wyoming's 186 out of 697 give it 26.7%. The 51 regions average 37.6%, with a median of 37.1%. Wyoming is one of five regions with fewer than 1,000 reports, and its share was 36.5% in 2023, so the bottom of the ranking is the least stable part.
1.3% of Victims Report to the FTC
1.3%
A Bureau of Justice Statistics survey estimated 23.9 million identity theft victims in 2021, about 9% of US residents aged 16 and older. Only 1.3% contacted the FTC and 7% reported to police, while 67% contacted a card company or bank. Sentinel therefore records a self-selected slice, and card fraud settled with a phone call is likely under-represented.
Florida by the Numbers
50.1% of Florida's Reports Involve Cards 50.1 %57,997 of 115,840 identity theft reports, the highest share of the 51 regions.
13.7% of All State-Located Card Reports 13.7 %57,997 of the 422,070 card reports across the 50 states and DC.
11.7% of All State-Located Identity Theft Reports 11.7 %115,840 of 990,097 reports, so Florida over-indexes on cards.
Two Bases, Both Correct
The 39.6% headline counts every identity theft report. The map counts only the reports the FTC could place in a state, which pool to 42.6%. That is why 34 of the 51 mapped regions sit below 39.6%. No colour scale here is centred on either number.
Reconciling the Numbers
Why Two-Thirds of the Map Sits Below 39.6%
The 51 mapped values come from the FTC's state tables, which include only reports where the consumer's state is known. Pool the 50 states and DC and the result is 422,070 card reports out of 990,097, or 42.6%. The national 39.6% divides 449,032 by 1,135,291. Same Data Book, different denominators, so 17 regions clear 39.6% and only 12 clear 42.6%.
The reports outside the map explain the difference. Of the 1,135,291 identity theft reports, 145,194 fall outside the 51 mapped regions, including 1,649 from Puerto Rico, which the basemap lacks. Only 26,962 of them carry a card tag. That is 18.6% card, against 42.6% inside the map.
Card reports are the likeliest to carry a state. Counting Puerto Rico, 94.1% of card reports are located, against 87.4% of identity theft reports overall; employment or tax-related reports (68.4%) and government documents or benefits reports (76.0%) are the least likely. The Data Book does not say why a report lacks a state, so the cause is unconfirmed even though the arithmetic is not.
The Range
A 23.4-Point Spread From Wyoming to Florida
Florida's 57,997 card reports among 115,840 identity theft reports make 50.1%, the highest share. California follows at 48.9% (68,323 of 139,665), then the District of Columbia at 48.7% on just 3,225 reports, Georgia at 46.8% and Nevada at 45.6%.
Fifth place is a coin flip. New York's 45.55% sits 0.02 points behind Nevada's 45.57%, and the FTC prints both as 46%. Say "among the top six" rather than "fifth".
At the other end, Wyoming's 186 of 697 reports give 26.7%, with New Mexico at 28.1%, Maine at 29.8%, West Virginia at 30.2% and Montana at 30.4%. Oklahoma is just behind at 30.8%. The 51 regions average 37.6% with a median of 37.1%, putting Florida 12.5 points above the average region and Wyoming 10.9 below.
Population and Reporting
Why the Share Is Less Population-Driven, Not Population-Free
Raw card report counts track population almost perfectly, with a correlation of 0.95, so a count map would mostly show where people live. The share cuts that link to 0.49 with the logarithm of population. Large states still tend to sit higher, and the five lowest, Wyoming, New Mexico, Maine, West Virginia and Montana, are all under 3.5 million residents.
The stronger link is reporting intensity. A state's card share correlates 0.84 with its total identity theft reports per 100,000 residents (Spearman 0.80). Card reports per 100,000 run from 32 in Wyoming to 264 in Florida, 8.3 times apart, while all other identity theft types run from 88 to 264, only 3.0 times apart.
That fits either more card fraud or more card-fraud reporting, and the file cannot separate them. Neither the FTC nor the BJS publications reviewed offer state-level evidence on how willing residents are to report identity theft.
The Leaders
Florida and Georgia Lead. The Data Cannot Say Why.
Florida and Georgia rank first and second among ranked states for identity theft reports per 100,000 residents, at 528 and 517, ahead of Nevada's 466. DC, which the FTC leaves unranked, is third at 480. Florida's card and non-card reports are level at 264 per 100,000 each. Georgia files more of everything else, 275 non-card against 242 card, so its 46.8% comes with a high count of all types, not card fraud alone.
Popular explanations exist, tourism and retirees for Florida, military and financial-sector presence for Georgia, but they come from aggregator and listicle pages that cite no data, and none was tested here. The FTC's Data Book ranks states without analysing causes. Any cause remains an open question.
What the history does show is a stable top and a noisier middle. Florida and California held the top two places in 2022, 2023 and 2024. Georgia's share went from 42.0% to 44.0% to 46.8% over the same years.
Reading the Percentage
Why a State's Theft Types Add Up to More Than 100%
One report can carry several theft types, and each type counts it. In 2024, 14% of identity theft reports included more than one type, so the seven type rows in the national table sum to 1,339,461, or 118.0% of the 1,135,291 total. In the 51 mapped regions the row sums run from 112% in Rhode Island to 125% in Indiana.
The denominator for every share here is the state's total identity theft reports, not the sum of its rows. Using the row sum would inflate the base by 12% to 25% and pull card shares down. Never add a state's card share to its loan or benefits share as if they split the total.
Small Numbers
Why the Bottom of the Ranking Is the Least Reliable Part
Five regions logged fewer than 1,000 identity theft reports in 2024: Vermont 651, Wyoming 697, Alaska 780, South Dakota 845 and North Dakota 924. On Wyoming's base, 25 reports are worth about 3.6 points of share, so one cluster of filings can reshuffle the ranking.
Single-year ranks do move. Wyoming's share was 36.5% in 2023 and 26.7% in 2024. Connecticut was 24.7% in 2023, the lowest in the country, and 44.5% in 2024. Between the two years a state's share moved 3.3 points on average, and the mean state share fell 1.1 points. No cause for any of these swings was found.
The Data Book itself warns that 2024 totals will likely change; it already restates 2023 card reports as 416,579 against the 416,582 first printed.
Time Context
Why This Share Cannot Be Trended Before 2022
Nationally the card share was 39.9% in 2022, 40.2% in 2023 and 39.6% in 2024, steady within 0.6 points. In 2020 and 2021 it was 28.3% and 27.2%, but that was not a dip in card fraud. Card reports stayed near 390,000 while total identity theft reports swelled to 1,387,615 and 1,434,676.
The swelling came from government documents or benefits reports: 406,375 in 2020 and 395,948 in 2021, then 57,877 in 2022. One benefits subtype jumped 2,920% in 2020 to 394,324 reports, matching the pandemic unemployment-benefit fraud wave, and fell 88% in 2022. The denominator collapsed, so the card share rose.
State figures show the same break: Kansas's card share was 3.2% in 2020, on 43,211 reports, and 40.2% in 2023. This post therefore maps 2024 alone and trends only 2022 to 2024.
Types
The Two Types of Credit Card Fraud This Data Counts
Sentinel splits credit card identity theft into exactly two types. New-account fraud means a card was opened in someone's name: 406,110 reports in 2024. Existing-account fraud means a card the victim already held was misused: 52,428 reports. New accounts are 88.6% of the two, so the data is overwhelmingly about cards that should never have existed rather than cards being run up.
The two do not add to the published credit card total. They sum to 458,538 against the FTC's 449,032, a gap of 9,506 reports, or 2.1%. A single report can carry both tags, so adding the subtypes counts those reports twice. The Data Book does not state this at subtype level; it is what the arithmetic requires.
What is absent is the taxonomy most people mean by types of credit card fraud. Sentinel records no method, so there is nothing here on skimming, card-not-present fraud, counterfeit cards, or cards lost and stolen. Those splits exist in payments-industry reporting, not in consumer complaint data, and no figure in this post can be read as describing them.
The split also understates what cardholders actually experience. Existing-account misuse is 11.4% of card reports here, yet the Bureau of Justice Statistics found 30.5% of identity theft victims said their most recent incident was the misuse of a single existing card. That kind of fraud is usually settled with one call to the bank and never reaches the FTC, so the data over-represents the cases serious enough to be worth reporting.
National Trend
Why Existing-Account Card Reports Are Growing 2.6 Times Faster
Card reports split into new-account fraud, where a card is opened in a victim's name, and existing-account fraud, where a card the victim already holds is misused. In 2024 new-account reports rose 7% to 406,110, while existing-account reports rose 17% to 52,428, so existing grew about 2.6 times as fast.
Over a longer view the gap widens. Since 2020 existing-account reports are up 55% and new-account reports up 11%; since 2022 existing is up 32% while new is down 1%. Existing accounts are still only 11.4% of subtype tags, with new accounts at 88.6%.
That mix probably reflects who files with the FTC. In the 2021 BJS survey the most common single incident was misuse of an existing credit card, 30.5% of victims' most recent incidents, and 67% of victims contacted a card company or bank, not the FTC.
Two cautions. These are report counts, so more reporting could explain the rise as well as more fraud. And the state files carry no subtype split, so this cannot be mapped. The subtype rows also overlap, summing to 458,538 against 449,032 distinct card reports, so never add them.
The Full Data Table
All 51 Regions Ranked by Credit Card Share of Identity Theft
Credit card reports as a share of each state's identity theft reports, with the underlying counts and the FTC's reports per 100,000 residents for all identity theft types. Ranks use the unrounded ratio, so no two regions tie.
Share is credit card reports divided by the state's total identity theft reports. Reports per 100,000 covers all identity theft types on a 2023 Census population base. Puerto Rico, with 545 card reports of 1,649 (33.1%), is excluded because the basemap has no polygon for it. 2024 counts are provisional.
What This Settles
What This Map Can and Cannot Settle
It settles where card-related reports are most and least common among FTC filings in 2024: Florida, California and DC at the top, Wyoming, New Mexico and Maine at the bottom. It also settles that 39.6% is the national figure and 42.6% the state-located one, and that neither is a reason to doubt the other.
It does not settle where card fraud is most common. Reports are a small, self-selected slice of victims, the share follows reporting intensity at 0.84, and nobody has shown why Florida and Georgia lead. It says nothing about dollars, either: the Data Book carries no loss figures for identity theft.
Check the FTC's data page before quoting. The newest Data Book listed there as of 6 October 2026 is calendar 2024, and its counts may be revised.
The data behind this story comes from the Federal Trade Commission's Consumer Sentinel Network Data Book for calendar year 2024, published in March 2025, via its public CSV archive. The dataset is a work of the US federal government, in the public domain under 17 U.S.C. § 105, and full credit for collecting and maintaining it goes to the FTC and Sentinel's data contributors. Victim estimates come from the Bureau of Justice Statistics' Victims of Identity Theft, 2021.
FactsFigs reviews, cleans, and cross-checks every source dataset before shaping it into a data story. Each visualization is created and designed in FactsFigs Design Studio — an internal tool developed and owned by FactsFigs — and is the original work of a FactsFigs author, not an AI-generated copy of any existing graphic. Individual assets within a visual may or may not be produced with AI tools, but the design of the visual itself is solely FactsFigs' own.
Figures are estimates at the time of publication, provided for information only — nothing here is financial advice or a guarantee of accuracy.
Last verified: 6 Oct 2026
The charts in this article were built with our own publishing system. See what it does →