TL;DR — Which State Has the Most Data Centers on OpenStreetMap?
1,378 mapped buildings, five empty states and a lead that flips
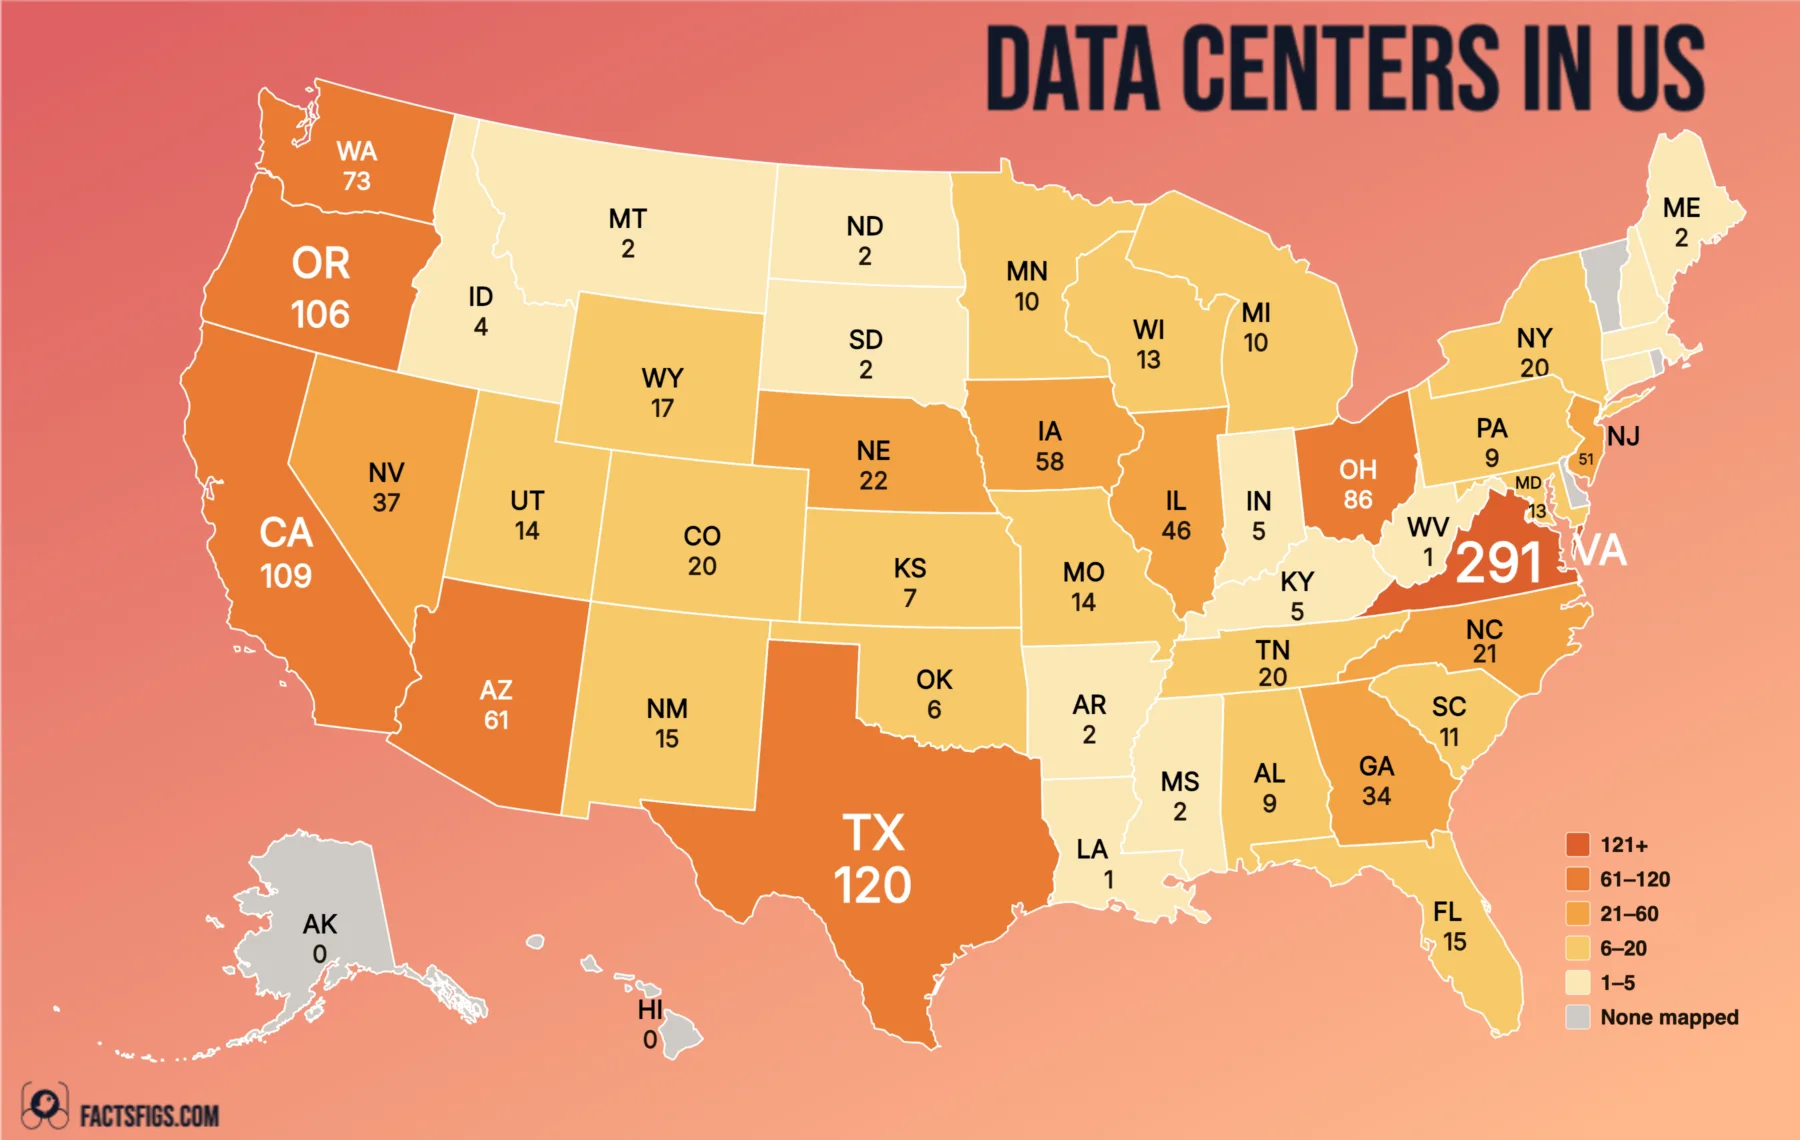
This map counts only what volunteers have drawn into OpenStreetMap: 1,378 data center buildings across the 50 states and DC, in a 9 February 2026 snapshot from Pacific Northwest National Laboratory. A commercial tracker lists more than 3,300 facilities nationally, so treat the map as a sample, not a census.
Virginia leads with 291 mapped buildings, 21% of the total, ahead of Texas at 120 and California at 109. Merge buildings within 1 km into campuses and Texas leads with 53 sites, with Virginia third at 40.
Five states show zero: Alaska, Delaware, Hawaii, Rhode Island and Vermont. That means none mapped, not none built, and coverage is uneven: among the states compared, from 83% of a commercial tracker's count in Ohio to 9% in Florida.
! What the Map Shows, and What It Doesn't:
•
Virginia Leads · 291 of 1,378 Buildings:More than twice Texas's 120. The top ten states hold 73% of the map, and the top three match Pew's operating counts.
•
Texas Wins on Campuses · 53 Sites to 40:Merging buildings within 1 km cuts the national figure to 563 and puts Texas first. Neither count is wrong.
•
Zero Means Unmapped · 5 States at 0:Census data show data processing and hosting businesses in all five, so zero reflects mapping gaps, not absence.
? The Numbers Behind the Map:
•
Mapped buildings, 50 states and DC:1,378, from 1,472 raw OpenStreetMap objects
•
Sites after merging within 1 km:563, led by Texas with 53
•
Share held by the top ten states:73%, with Virginia alone at 21%
Use the map for where mapped data centers cluster, not for how many a state has. The top three match commercial trackers; the middle and the tail depend on who has been mapping.
Continue reading below for the full detailed article →
Overview
Why a Map of Data Centers by State Is Not a Census
A map of data centers by state looks like a census, and this one is not. Every building on it comes from OpenStreetMap, the volunteer-edited world map, where a contributor tags a structure as a data center when they notice one. Pacific Northwest National Laboratory extracted those objects in February 2026, assigned each to a state and published them as the IM3 Open Source Data Center Atlas: 1,378 mapped buildings in the 50 states and DC. Many enterprise server rooms are unlikely to be tagged at all, and anything nobody has noticed is absent. The map shows where mapped data centers cluster; it cannot say how many a state really has.
The Three Numbers That Frame This Map
How much of the industry the map holds, how concentrated it is and how fragile the ranking is: three figures from the 9 February 2026 snapshot, all counting mapped objects, not every data center.
1,378 Mapped Buildings in 50 States and DC
1,378 buildings
One per mapped building, plus a campus or lone point only where no building is drawn inside it, gives 1,378 data centers in the 50 states and DC, from 1,472 raw OpenStreetMap objects. Electric Choice, a commercial tracker, lists more than 3,300 facilities as of 29 September 2026. The units differ, but the gap is why this is a sample.
291 Mapped Buildings in Virginia
291 buildings
Virginia holds 21% of all mapped buildings, more than twice Texas's 120 and California's 109. The top ten states hold 73% of the map, while the median state has just 10. Loudoun County alone has 189 mapped building outlines, so much of Virginia's lead sits in one county that happens to be mapped unusually completely.
53 Sites in Texas, the Campus Leader
53 sites
Merging buildings within 1 km of each other into single sites cuts the national count from 1,378 to 563 and reorders the top. Texas leads with 53 sites, California has 42, and Virginia, down from 291 buildings, falls to third with 40. Which state comes first depends on whether you count buildings or places, and both are legitimate.
Virginia by the Numbers
21% of Every Mapped Building 21 %291 of 1,378 is 21.1%, about one in five. Only eight other states reach 50 or more.
81% of Loudoun's Buildings Are Mapped 81 %Loudoun County reports about 233 existing buildings as of 1 March 2026; the Atlas has 189 outlines there.
60% of Electric Choice's Virginia Count 60 %Electric Choice lists 488 for Virginia as of 29 September 2026. Ohio and Arizona sit higher, at 83% and 73%.
How to Read a Zero
Alaska, Delaware, Hawaii, Rhode Island and Vermont show 0. On this map that means no data center has been mapped in OpenStreetMap there, not that none exist. Read every low number as a floor set by volunteers.
The Ranking
Why the Top Ten States Hold 73% of the Map
Virginia's 291 buildings are followed by Texas at 120, California at 109, Oregon at 106 and Ohio at 86. Washington (73), Arizona (61), Iowa (58), New Jersey (51) and Illinois (46) complete the top ten, which together hold 1,001 of the 1,378 mapped buildings, or 73%. Virginia on its own accounts for 21%.
Below that the map thins quickly: the median state has 10 mapped data centers, 33 of 51 areas have 15 or fewer and only nine states reach 50. Oregon in fourth is the surprise. It sits ahead of Ohio and Washington and is outside the top ten of the tracker Electric Choice, though Pew's chart, drawn from Data Center Map listings, has it ninth.
Buildings vs. Campuses
How Counting Campuses Hands the Lead to Texas
The Atlas stores some data centers as points, some as building outlines and some as campus boundaries, and a volunteer can draw a hyperscale campus as one polygon or a dozen buildings. This map counts one per mapped building, adding a campus or point only where no building sits inside it: 1,378, from 1,472 raw objects.
Change the rule and the leader changes. Merge everything within 1 km into one site and the national count drops to 563: Texas 53, California 42, Virginia 40, Arizona 38, Ohio 29. Virginia's buildings shrink 7.3-fold because Loudoun County alone has 189 outlines packed together; Texas's shrink only 2.3-fold, which points to more separate locations.
Iowa shows the gap: 58 buildings but 14 sites. Wyoming has 17 and 4, South Carolina 11 and 3. The Atlas does not say why, but hyperscale campuses mapped building by building would produce that pattern.
Northern Virginia
Why Northern Virginia Became the Exception
Loudoun County's economic development director, Buddy Rizer, traces the cluster to the late 1990s, when AOL moved its headquarters there and "everybody started running their fiber out to AOL." An internet exchange point, MAE-East, followed. Equinix's Jon Lin put the next step simply: "Once all the connectivity was there, all the content providers seemed to be there."
The county lists proximity to Washington and a major airport, an established workforce, a reliable power grid and a business-friendly permitting process. As of 1 March 2026 Loudoun had about 233 existing data center buildings and about 56.5 million square feet, and data centers produced $1.2 billion in property tax revenue in fiscal 2026, 39% of the county budget.
State policy helped. Virginia's sales tax exemption, dating from 2010, lets qualifying data centers buy equipment tax-free if they create 50 jobs, pay 150% of the local prevailing wage and invest $150 million. Legislative auditors at JLARC found it saved $928.6 million in fiscal 2023, the state's largest economic development incentive, used by 90% of the industry by megawatts. Industry says it is a key factor in where it builds, which is a claim, not proof Virginia would lack the cluster without it.
At the top, yes. Pew Research's April 2026 chart, built on Data Center Map listings, puts Virginia, Texas and California first, second and third among operating facilities, at 398, 296 and 277. Electric Choice, as of 29 September 2026, has 488, 389 and 230, with Georgia level with California.
Beyond that the sources split. Aterio's March 2026 pipeline count, which adds projects under construction and announced, has Texas ahead of Virginia 962 to 954 and Georgia third, with California outside its top five. Pew counts listings, Electric Choice tracked facilities, Aterio pipeline sites and this map mapped buildings, so none of their numbers is offered here as a state total.
Coverage Gaps
Where the Map Is Thin: New York, Florida and Pennsylvania
Against Electric Choice, coverage swings from near-complete to almost empty. Ohio's 86 is 83% of its 104, Arizona's 61 is 73% of 83 and Virginia's 291 is 60% of 488. California sits at 47%, New Jersey 40% and Texas 31%. Then Illinois 21%, Georgia 15%, New York 11% (20 of 189) and Florida 9% (15 of 171).
Pew's operating counts agree on the weakest cases: New York 20 against 148, Florida 15 against 120, Pennsylvania 9 against 78. Census data rank Pennsylvania fifth for data processing and hosting establishments in 2023, with 937. These are large markets, so thin mapping is likelier than thin supply.
The map can also run close to commercial counts: Oregon's 106 against 115 operating in Pew's data, Iowa's 58 against 64. The units differ, buildings against facilities, so that does not prove the same sites are counted. The Atlas's authors call validation of the OpenStreetMap data "an ongoing development".
Zeros and Ones
Why Zero on This Map Means "None Mapped"
Five states have no mapped data centers, and DC, Louisiana and West Virginia have one each. In OpenStreetMap that more likely means no volunteer has tagged one than that none exist. The Census Bureau's 2023 County Business Patterns counted 206 data processing and hosting establishments in Delaware, 59 in Hawaii, 46 in Rhode Island, 41 in Vermont and 33 in Alaska.
Those are business locations, not buildings, and a hosting firm need not run a data center, so this is an inference, not a verified undercount. But the same file counts 119 such establishments in DC, 130 in Louisiana and 45 in West Virginia, which makes one mapped building each look like a gap.
The snapshot matters too: PNNL warns later Atlas versions may not contain every location in earlier ones, so an empty state may fill in without a single new building.
The Full Data Table
All 51 Areas Ranked by Mapped Data Center Buildings
Mapped data center buildings in the 50 states and DC, the raw count of OpenStreetMap objects and the sites left after merging buildings within 1 km. Ties share the lowest rank.
Existing facilities only. Mapped data centers counts one per building, plus a campus outline or point only where no mapped building sits inside it. Puerto Rico, with two mapped objects, is excluded because the basemap has no polygon for it.
What This Settles
What This Map Can and Cannot Settle
It settles where mapped data centers cluster: Virginia, Texas and California lead this map, Pew's operating counts and Electric Choice, and the top ten states hold 73% of mapped buildings. It also settles that buildings and campuses are different questions, with Virginia first on 291 buildings and Texas first on 53 sites.
It does not settle how many data centers any state has. The 1,378 figure counts the map, not the industry, and the gap to Electric Choice's 3,300+ is widest in New York, Florida and Georgia. For a number to quote, use a tracker's own figure with its own definition.
The map will move as volunteers add buildings. If a later Atlas version shows New York or Florida jumping, that will mostly measure new mapping, not new construction.
FactsFigs reviews, cleans, and cross-checks every source dataset before shaping it into a data story. Each visualization is created and designed in FactsFigs Design Studio — an internal tool developed and owned by FactsFigs — and is the original work of a FactsFigs author, not an AI-generated copy of any existing graphic. Individual assets within a visual may or may not be produced with AI tools, but the design of the visual itself is solely FactsFigs' own.
Figures are estimates at the time of publication, provided for information only — nothing here is financial advice or a guarantee of accuracy.
Last verified: 6 Oct 2026
The charts in this article were built with our own publishing system. See what it does →