

5 tests
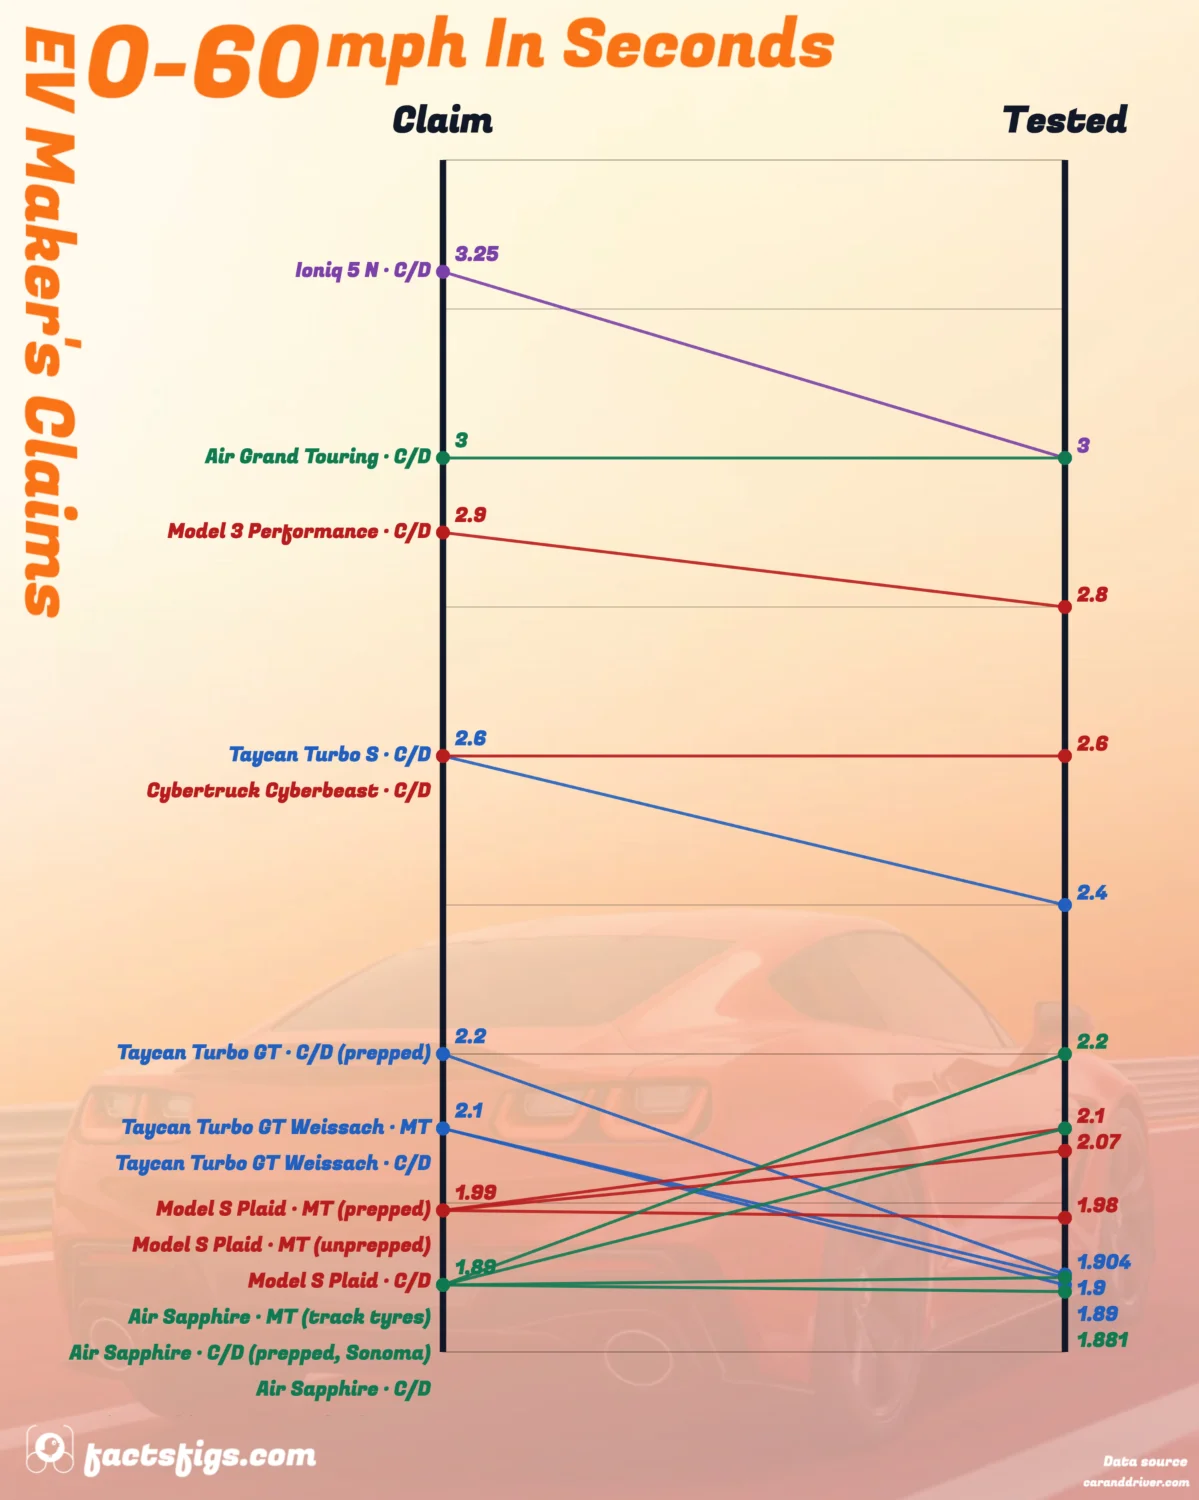
Four Porsches and the Hyundai Ioniq 5 N came in 0.2 seconds or more under the published figure.

Facts & Figures
Visual Intelligence
Mostly yes. The conditions attached to them are what nobody prints.
Across fifteen instrumented tests, five beat the maker’s claim by 0.15 seconds or more, two missed it by that much, and eight landed within rounding. Claims are beaten more often than they are missed. The interesting part is why. Four of the five beats are Porsches, and they stop being beats once you put both numbers on the same basis. Tesla’s 1.99 second Plaid claim is real, but it needs a prepared drag strip. On ordinary tarmac the same car runs 2.07 to 2.1.
Continue reading below for the full detailed article →
The sourcing, stated first
Only two outlets instrument this class of car often enough to compare: Car and Driver and MotorTrend. Every tested figure here is theirs. Every claimed figure is the manufacturer’s own. Three traps sit in this data and all three were handled rather than averaged away. The first is the one-foot ROLLOUT, worth about 0.2 seconds, which both magazines apply and most makers do not discuss. The second is units: 100 km/h is 62.1 mph, so a European 0 to 100 figure is not comparable with a US 0 to 60 figure, and no number here was converted between them. The third is that the obvious story, makers exaggerating, is not what the data shows. What this page cannot do is read the original tests. Car and Driver and MotorTrend both block automated access. The Car and Driver figures were read in full through licensed republications; the MotorTrend figures are reported secondhand through Electrek, Carscoops and Jalopnik, and are marked as such in the table.
Counted at a 0.15 second threshold, because Car and Driver publishes most times to a tenth.
5 tests
Four Porsches and the Hyundai Ioniq 5 N came in 0.2 seconds or more under the published figure.
8 tests
Including every Tesla tested. The gap is smaller than the precision the figures are published to.
2 tests
Both are the Lucid Air Sapphire on its standard tyres, at 2.1 and about 2.2 against a 1.89 claim.
The fifth of a second nobody mentions
American drag racing starts the clock not when the car begins to move but once it has travelled one foot. The convention came from staged drag strips, and both Car and Driver and MotorTrend apply it to their acceleration times. It is not cheating, it is a stated method, and it makes every number it touches look quicker.
How much quicker is checkable. Car and Driver’s own comparison table lists 0.2 seconds for the 2020 Taycan Turbo S and Model S. MotorTrend published the Taycan Turbo GT Weissach at 1.89 seconds with rollout and 2.10 without, a difference of 0.21. Edmunds lists the Model S Plaid at 2.1 with and 2.3 without.
The physics agrees. Covering one foot from rest at the average acceleration a 1.9 second car sustains takes about 0.21 seconds, and for a 3.25 second car it is closer to 0.27. So the allowance is worth slightly more to a slower car, and roughly a fifth of a second across this group.
Where it gets slippery is the claim side. Of every maker here, only Rimac states on its own pages whether its figure includes rollout. Tesla is reported to use it for the Plaid, but that comes from Electrek and Torque Cafe rather than from a Tesla page that could be read directly. Porsche, Lucid, Hyundai and Aspark say nothing at all.
The headline answer
Fifteen instrumented runs can be compared directly with a claim in the same units. Eight came in quicker than the maker said, two matched exactly, and five were slower. Allowing a 0.15 second threshold, because Car and Driver reports most times to a tenth, five beat the claim, eight sit inside the noise and two miss.
That is not the story anyone expects from a spec sheet. A maker publishing a number a customer can repeat has every reason to be conservative, and most of these are. The exaggeration story, the one where the fastest EVs cannot do what the brochure says, is not what fifteen stopwatches found.
The gaps are also small in absolute terms. Excluding the two misses, the largest distance between claim and measurement in this set is 0.296 seconds, on a car that covers 60 mph in under two. Most of the spread comes from how the run was staged rather than from how fast the car is.
Where the beats come from
Four of the five clear beats are Porsches, which is suspicious on its face. A single maker being systematically more honest than the rest is a weaker explanation than a measurement convention, and the arithmetic points at the convention.
Add Car and Driver’s published 0.2 second rollout back onto its Taycan Turbo S result of 2.4 seconds and you get 2.6 exactly, which is Porsche’s claim. Do the same with the Turbo GT Weissach at 1.9 and you get 2.1, which is again the claim. MotorTrend’s own no-rollout figure for that car is 2.10 against a 2.1 claim.
Two exact landings and a third within a tenth is consistent with Porsche quoting times measured without a rollout allowance. If that is right, Porsche is not beating its claims at all. It is publishing a stricter number than its rivals and then being measured on the looser American convention.
This has to stay an observation rather than a finding, because Porsche does not say. Its own measuring-method page would settle it and could not be read. What can be said is that the pattern follows the maker rather than the car, which is what a convention looks like and not what conservatism looks like.
The one that misses
Both clear misses in the set are the same car. Lucid claims 1.89 seconds for the Air Sapphire. Car and Driver measured 2.1 at its own test track, and MotorTrend about 2.2 on the standard Michelins, both with the rollout allowance already applied.
The claim is reachable. Car and Driver’s technical editor recorded 1.9 seconds on a prepared surface at Sonoma Raceway. MotorTrend recorded 1.881 with Lucid’s optional Track Tire package, a dealer-installed set of Pirellis costing $8,250.
So the figure is not invented, it is conditional, and the conditions are not printed next to it. A buyer taking delivery of a standard Sapphire and finding 2.1 seconds on an ordinary road has not been misled about the car so much as about the circumstances. That distinction is the whole subject of this page.
The claim that started this
The Model S Plaid is the reason most people search for this comparison, and it comes out well. MotorTrend measured 1.98 seconds against the 1.99 claim, which is as close as this kind of testing gets.
That run was on a VHT-prepped drag strip in Drag Strip mode. VHT is the sticky compound sprayed onto a strip to stop wheels spinning, and it is not a condition any road provides. On an unprepared surface MotorTrend recorded 2.07 and Car and Driver 2.1, both still with rollout applied.
The honest summary is that all three numbers are true and they describe different events. Tesla’s claim is the best case, correctly measured and correctly reported. The 0.08 to 0.11 second shortfall on ordinary tarmac is smaller than the precision most of these figures are quoted to, which is why it sits inside the rounding band rather than among the misses.
Every run in the set
Sorted by how far the measurement fell from the claim. Negative means the test was quicker than the maker said. All tested times include the one-foot rollout allowance.
| Porsche Taycan Turbo GT | 2.2 | 1.904 | -0.30 | Beat | Car and Driver | read in full | Standard concrete surface, 'not an ultra-sticky prepped drag strip'; Spo... |
| Hyundai Ioniq 5 N | 3.25 | 3.0 | -0.25 | Beat | Car and Driver | read in full | Surface not stated; quarter mile 11.1 s at 123 mph. Car and Driver also ... |
| Porsche Taycan Turbo GT Weissach | 2.1 | 1.89 | -0.21 | Beat | MotorTrend | secondhand | Surface, temperature and tires not stated by Carscoops. Quarter mile 9.2... |
| Porsche Taycan Turbo GT Weissach | 2.1 | 1.9 | -0.20 | Beat | Car and Driver | read in full | Article is a drive at the 2.4-mile Monteblanco circuit near Seville, Spa... |
| Porsche Taycan Turbo S | 2.6 | 2.4 | -0.20 | Beat | Car and Driver | secondhand | Prototype Taycan ('still a prototype model' per Jalopnik); Turbo S; head... |
| Tesla Model 3 Performance | 2.9 | 2.8 | -0.10 | Within rounding | Car and Driver | read in full | Magazine test track; 4,046 lb test car; drive mode not stated; quarter m... |
| Tesla Model S Plaid | 1.99 | 1.98 | -0.01 | Within rounding | MotorTrend | secondhand | VHT-prepped drag strip (Famoso Raceway, Bakersfield CA); Drag Strip laun... |
| Lucid Air Sapphire | 1.89 | 1.881 | -0.01 | Within rounding | MotorTrend | secondhand | Unprepped surface; Lucid Track Tire package (Pirelli P Zero Trofeo RS El... |
| Lucid Air Grand Touring | 3.0 | 3.0 | +0.00 | Within rounding | Car and Driver | read in full | Magazine test track; 819 hp car on 19-inch all-season tires. |
| Tesla Cybertruck Cyberbeast | 2.6 | 2.6 | +0.00 | Within rounding | Car and Driver | read in full | 834 hp tri-motor, 6,901 lb; Goodyear Wrangler Territory RT LT285/65R-20;... |
| Lucid Air Sapphire | 1.89 | 1.9 | +0.01 | Within rounding | Car and Driver | read in full | PREPPED surface at Sonoma Raceway. |
| Tesla Model S Plaid | 1.99 | 2.07 | +0.08 | Within rounding | MotorTrend | secondhand | Unprepared surface (venue differs between secondhand sources; one names ... |
| Tesla Model S Plaid | 1.99 | 2.1 | +0.11 | Within rounding | Car and Driver | read in full | VBOX equipment; Drag Strip mode used (without the launch wait the car wa... |
| Lucid Air Sapphire | 1.89 | 2.1 | +0.21 | Missed | Car and Driver | read in full | Magazine test track; 5,345 lb; Michelin Pilot Sport 4S developed for thi... |
| Lucid Air Sapphire | 1.89 | 2.2 | +0.31 | Missed | MotorTrend | secondhand | Standard Michelin Pilot Sport 4S LM1 tires; unprepped. Figure derived fr... |
Verdict uses a 0.15 second threshold, ours, because Car and Driver publishes most times to a tenth of a second. "Source read" says whether we read the test in full or are relying on another outlet reporting it.
The numbers nobody has checked
The quickest figures in the EV world do not appear in the chart above, because no magazine has measured them. The Rimac Nevera R claims 1.66 seconds, the Aspark Owl 1.72 and the Pininfarina Battista 1.79. Every one of those runs was conducted by the company that makes the car.
Rimac describes its Nevera figures as independently verified, and that wording deserves care. What was independent was the data logging equipment, from Racelogic and Dewesoft, not the test. A manufacturer timing its own car with a good stopwatch is still a manufacturer timing its own car.
The Aspark Owl is the weakest of the three. Its headline figure carries an asterisk whose footnote we could not find, the Misano run was conducted with Michelin staff present, and the only outside-looking attempt is a 1.921 second prototype run on racing slicks. Of every claim on this page, it is the one with the least behind it.
This is not an accusation that any of them is false. It is the observation that the three quickest acceleration claims in production cars rest entirely on the word of the people selling them, while the slower claims from Tesla, Porsche and Lucid have all been checked by somebody else.
A trap worth knowing
One hundred km/h is 62.1 mph, so a European 0 to 100 figure describes a longer run than an American 0 to 60 one. Comparing them directly flatters whichever car was measured to the lower speed, and the difference is not trivial at these accelerations.
Porsche publishes both for the same car: 2.2 seconds to 60 mph in the United States and 2.3 seconds to 100 km/h in Germany. The Hyundai Ioniq 5 N is 3.25 seconds to 60 mph and 3.4 to 62. Where Rimac and Pininfarina publish both, the gap runs 0.06 to 0.07 seconds.
No figure on this page has been converted between the two. Where a maker publishes only a metric time, it is absent from the comparison rather than translated into one.
Car and Driver instrumented tests MotorTrend instrumented tests
Tested times are Car and Driver and MotorTrend instrumented results. Claimed times are from manufacturers’ own published specifications. Each row in the table states which tester produced the figure and whether we read that test in full.
Both publications block automated access. Car and Driver results were read in full through licensed republications of the original articles. MotorTrend results are reported secondhand through Electrek, Carscoops and Jalopnik, and the figures of 1.98, 2.07, about 2.2, 1.881 and 1.89 seconds all come to us that way. Tesla’s own pages returned errors, so Tesla’s rollout wording is reported rather than verified.
Where sources disagree, this page records the disagreement instead of averaging. Tesla’s Plaid claim is 1.99 seconds per Tesla and 1.98 on Wikipedia, which is MotorTrend’s measurement rather than a claim. One summary of a MotorTrend no-rollout Plaid time could not be matched to the right car, so no such figure appears here. A 1.97 second Nevera figure appears only on a fan wiki and is excluded.
The 0.15 second verdict threshold is ours, chosen because Car and Driver publishes most times to a tenth. The rollout arithmetic in the article is also ours, derived from the distance and the average acceleration each time implies. Test dates, ambient temperature, state of charge and press-car status are not stated by the sources and are recorded as unknown rather than estimated.
Related Publications
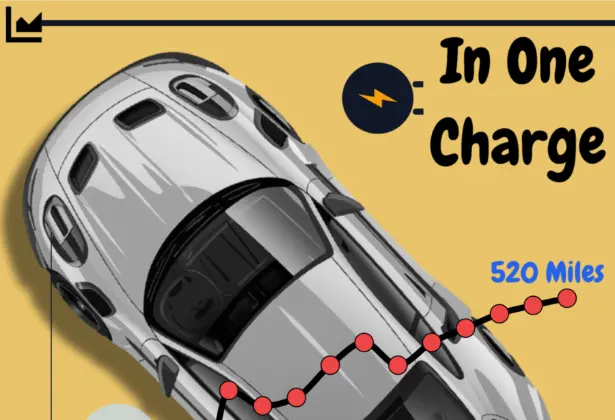
The highest EPA-rated range peaked at 520 miles in 2022 and has slipped to 512. Meanwhile the median electric car went from 82 miles to 295.
19 Oct 2026
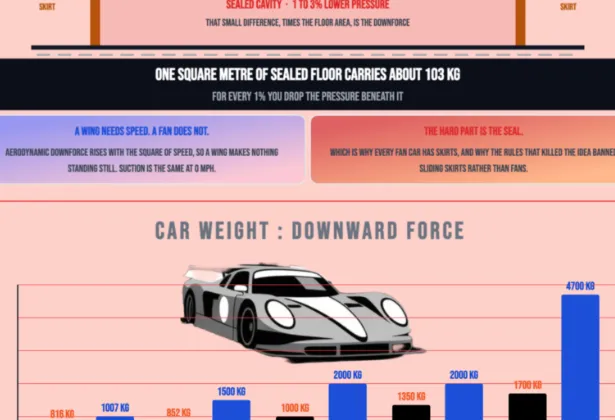
Suction, not a wing. Every fan car since the 1970 Chaparral presses down harder than it weighs, and only one has ever been shown driving upside down.
19 Oct 2026
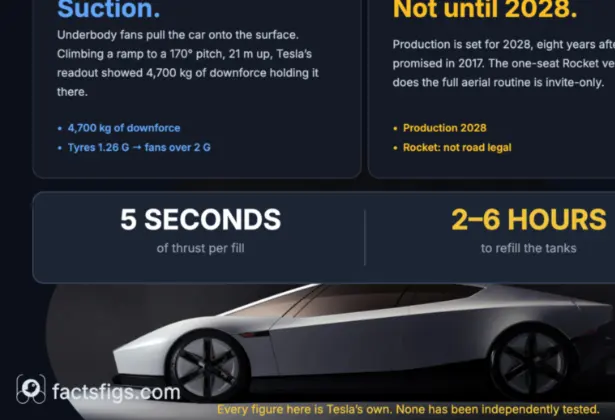
Tesla’s Roadster climbed a ramp upside down and flipped over a row of cars. The footage is real, but it is not flight: here is how the suction and thrusters actually work.
18 Oct 2026
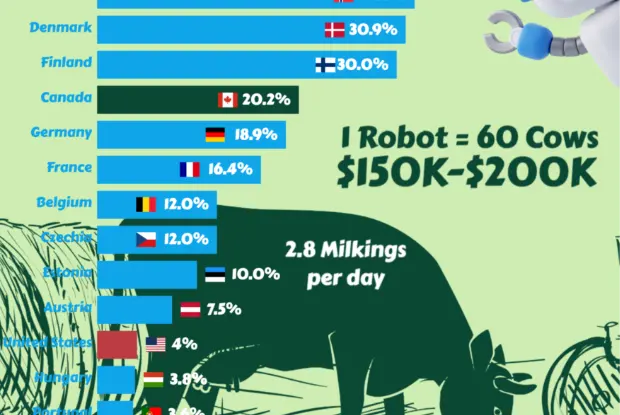
Nearly half of Swedish dairy farms milk with robots; the US manages about 4%. Eighteen countries ranked, with the herd-size and budget arithmetic.
07 Oct 2026