

8.5 times
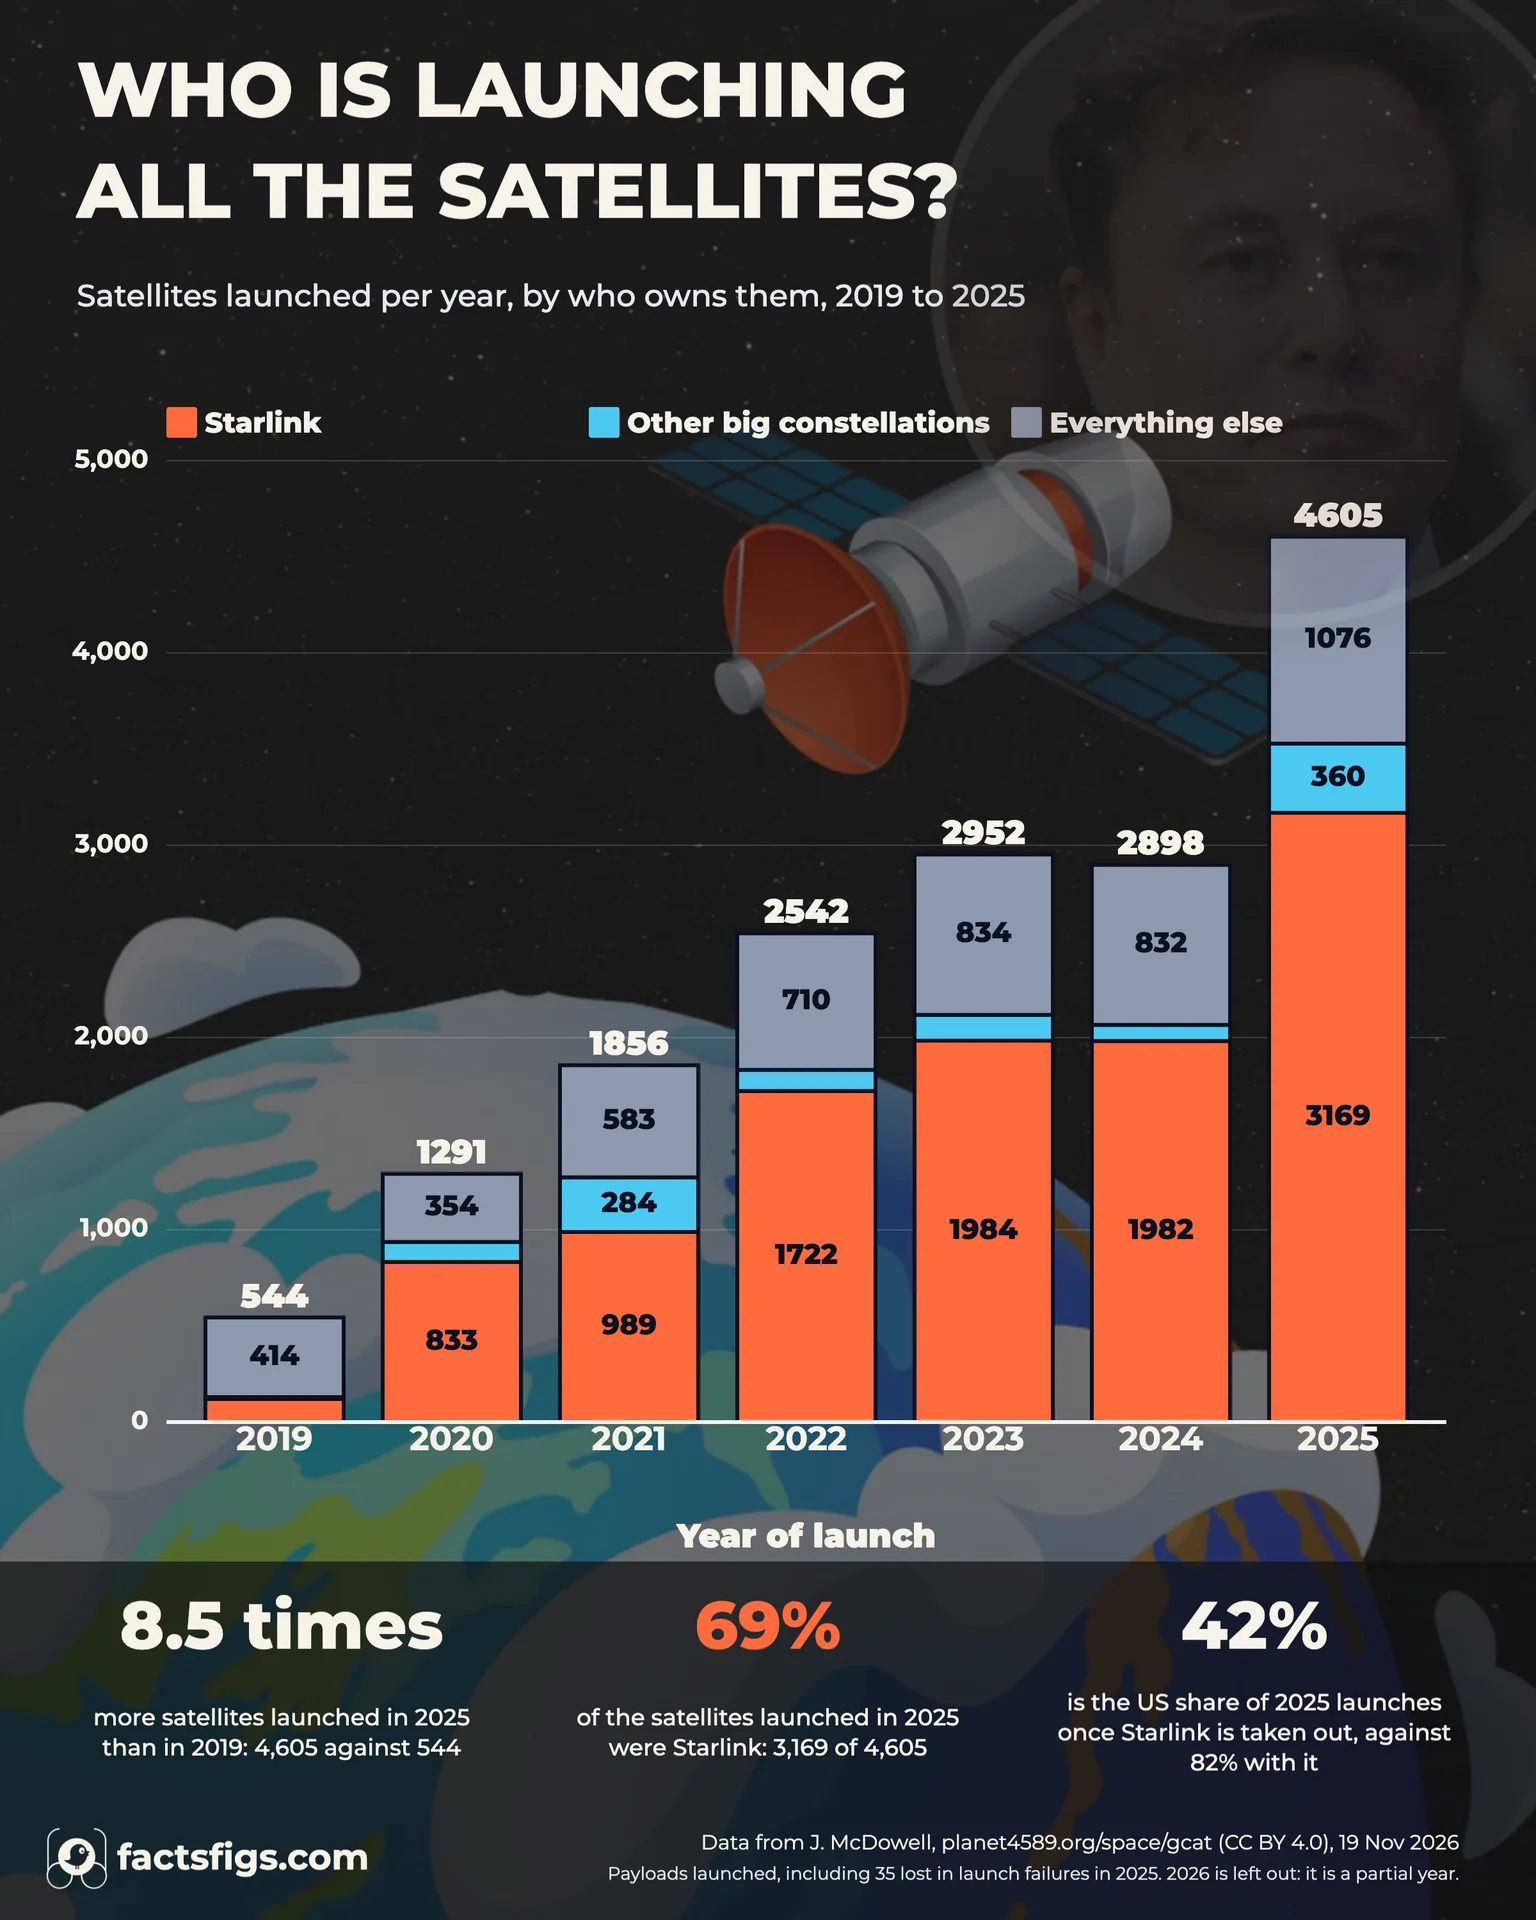
The world launched 544 satellites in 2019 and 4,605 in 2025, about 12.6 a day. Without Starlink the rise is 3.4 times, from 424 to 1,436.

Facts & Figures
Visual Intelligence
About 4,600 in 2025, 8.5 times the 2019 figure, and Starlink was 69% of them.
Counting every payload launched, the world sent up 544 satellites in 2019 and 4,605 in 2025, according to Jonathan McDowell's catalogue. Starlink grew from 120 to 3,169 and was 69% of the 2025 total. Four other big constellations added 360 more, so five named networks made up 77% of what was launched. The United States owned 82% of 2025's launches. Take Starlink out and its share falls to 42%, and launches since 2019 rose 3.4 times instead of 8.5. The count overstates the growth in capacity: launched mass rose 5.9 times from 2010 to 2025 while the count rose 34 times.
The satellite boom is mostly one company's network. It pushed launches to about 12 a day, but the growth is much smaller measured in mass, and the United States looks far less dominant without it.
Continue reading below for the full detailed article →
Overview
There is no single official count of satellites launched. The United Nations keeps an index of objects that countries have registered with it, and a registration can arrive months after the launch. Independent catalogues, kept by tracking networks and researchers, count what actually went up. We use Jonathan McDowell's General Catalog of Artificial Space Objects, because it counts the same way in every year, is updated daily and is free to reuse with credit. It lists every payload on an orbital or deep-space launch, including those lost when a launch failed, by launch date. We start in 2019, when it agrees with the other series, because earlier years include cubesats carried on cargo ships. The owner of a satellite is not always the country whose rocket carried it. We attribute each one to its owner's country, and we say where the answer changes with the rule. Everything here is a count of satellites, not of what they can do, and we come back to that at the end.
How fast launches grew, how much of it is Starlink, and how that changes the picture for the US.
8.5 times
The world launched 544 satellites in 2019 and 4,605 in 2025, about 12.6 a day. Without Starlink the rise is 3.4 times, from 424 to 1,436.
69% of 2025 launches
Starlink was 3,169 of the 4,605 satellites launched in 2025. Adding OneWeb, Kuiper, Guowang and Qianfan, five named networks are 77%.
42% of the rest
The United States owned 82% of 2025's satellites, or 3,774 of 4,605. Without Starlink it owns 605 of the other 1,436, which is 42%.
The count
The world launched 544 satellites in 2019 and 4,605 in 2025, which is 8.5 times as many. The yearly totals in between are 1,291, 1,856, 2,542, 2,952 and 2,898. In 2025 that is about 12.6 satellites a day, or one roughly every 1.9 hours.
Two other counts agree. CelesTrak, which catalogues what the US tracking network sees, has 4,495 payloads for 2025. Our World in Data, using the United Nations index, shows 4,510. Both sit within 2.5% of McDowell's count every year from 2020 to 2025. Before 2019 the catalogues disagree, so we do not rely on them.
Launches were far lower a decade earlier. Counts for 2010 range from 121 to 135 depending on the source, so the rise to 2025 is about 34 to 37 times.
The one dip in the chart, from 2,952 in 2023 to 2,898 in 2024, is small and has a cause. Starlink launched 1,984 satellites in 2023 and 1,982 in 2024, so it was flat. The fall is OneWeb finishing its first batch, from 132 satellites to 20.
The count
Each row counts payloads launched in that year. Every other satellite, including smaller constellations such as Planet and Spire, is in the Everything else column.
| 2019 | 120 | 10 | 0 | 0 | 0 | 414 | 544 | 22.1% |
| 2020 | 833 | 104 | 0 | 0 | 0 | 354 | 1,291 | 64.5% |
| 2021 | 989 | 284 | 0 | 0 | 0 | 583 | 1,856 | 53.3% |
| 2022 | 1,722 | 110 | 0 | 0 | 0 | 710 | 2,542 | 67.7% |
| 2023 | 1,984 | 132 | 2 | 0 | 0 | 834 | 2,952 | 67.2% |
| 2024 | 1,982 | 20 | 0 | 10 | 54 | 832 | 2,898 | 68.4% |
| 2025 | 3,169 | 0 | 180 | 126 | 54 | 1,076 | 4,605 | 68.8% |
| 2026 (to 19 Nov) | 2,323 | 0 | 256 | 104 | 167 | 1,101 | 3,951 | 58.8% |
Source: McDowell's catalogue, data update of 19 November 2026. Totals include payloads lost in launch failures (35 in 2025). Starlink excludes 38 Starship test objects named Starlink Simulator in 2025. Amazon's programme is now called Leo, and the catalogue still names its satellites Kuiper. 2026 is partial.
Starlink
Starlink grew from 120 satellites in 2019 to 833 in 2020 and 3,169 in 2025. That is 69% of everything launched in 2025, and it was between 53% and 68% of each year from 2020 to 2024. Add OneWeb, Amazon's Kuiper, China's Guowang and China's Qianfan and the five named networks were 3,529 of 4,605, or 77%, up from 24% in 2019.
Without Starlink the rise is much smaller. The other 1,436 satellites launched in 2025 compare with 424 in 2019, a rise of 3.4 times instead of 8.5.
In total McDowell's catalogue has 10,799 Starlink satellites launched by the end of 2025 and 13,122 by 19 November 2026. Starlink said it passed 10,000 launched on 19 October 2025, as Via Satellite reported on 20 October, and the catalogue puts the 10,000th on the same day. On 19 November 2026 the catalogue lists 11,193 Starlink satellites as active, out of 17,286 active satellites of any kind, which is 65%.
SpaceX's own 2025 progress report, dated 27 January 2026, says more than 9,000 were active then. The two figures are ten months apart, not in conflict.
2026 so far
The 2026 numbers are partial but already informative. To 19 November the catalogue lists 3,951 payloads launched, with Starlink at 2,323, or 58.8%, down from 68.8% in 2025.
New networks are filling the gap. Amazon's Kuiper has launched 256 so far this year, against 180 in all of 2025, China's Qianfan 167 against 54, and Guowang 104 against 126. Together the three are 527, or 13.3% of the year so far, against 7.8% in 2025.
A partial year is not a forecast, and shares move with launch schedules, so we show 2026 in the table and leave it out of the chart. What the numbers do show is that the next stage of the boom has more than one builder.
The owners
The United States, but how much depends on the rule. Counting satellites by their owner's country, the US owned 3,774 of the 4,605 launched in 2025, or 82%. Counting by the country whose rocket launched them it is 4,026, or 87.4%, because American rockets carry other countries' satellites. Take Starlink out and US owners have 605 of the other 1,436, which is 42%.
China owned 380, or 8.3%, and 47% of those were Guowang and Qianfan satellites. Russia owned 88, from many small owners, and none holds more than 11. Grouping owners in Europe, the UK, the EU and its agencies gives 163, or 3.5%.
Country totals can mislead because a constellation belongs to a company. The 289 satellites the United Kingdom shows for 2021 in the United Nations index are almost all OneWeb, whose satellites the UK registers but which flew on Russian, American and Indian rockets. In McDowell's count OneWeb launched 284 in 2021.
The owners
The same launches give three different answers, depending on whether you count the owner, the rocket or the satellites other than Starlink.
| 2019 | 57.4% | 49.4% | 45.3% |
| 2020 | 76.1% | 69.0% | 32.8% |
| 2022 | 76.9% | 83.4% | 28.3% |
| 2024 | 78.6% | 83.9% | 32.3% |
| 2025 | 82.0% | 87.4% | 42.1% |
Source: McDowell's catalogue, derived by FactsFigs. The last column counts US owners among the satellites that are not Starlink.
The weight
Not in the way the count suggests. From 2010 to 2025 the number of satellites launched rose about 34 times, but the mass launched rose only 5.9 times, from 568 to 3,372 tonnes. Launch mass is the satellite's weight at liftoff, and about 15% of the 2025 total is an estimate.
A Starlink satellite is not tiny either. The 2025 batch averages 622 kg, and Starlink was 69% of the count but 58% of the mass. The median satellite fell from 1,450 kg in 2010 to a few dozen kilograms in the cubesat years and was back to 575 kg in 2025, because Starlink satellites dominate the middle.
So the boom is real in numbers and smaller in capacity. A count of satellites says how many things went up, not how much was built.
The weight
Mass is the weight of the payloads at launch, in tonnes. The median is the weight of the middle satellite in kilograms.
| 2010 | 135 | 568 | 1,450 | 0% |
| 2015 | 270 | 323 | 22 | 0% |
| 2019 | 544 | 337 | 72 | 9% |
| 2022 | 2,542 | 972 | 297 | 53% |
| 2023 | 2,952 | 1,645 | 305 | 61% |
| 2024 | 2,898 | 2,532 | 730 | 61% |
| 2025 | 4,605 | 3,372 | 575 | 58% |
Source: McDowell's catalogue, derived by FactsFigs. Counts before 2019 include cubesats carried on cargo ships and payloads lost in launch failures, which is why 2010 shows 135 against 121 elsewhere.
The United Nations count
Our World in Data's chart of objects launched into space, built from the United Nations index in February 2026, shows 4,510 for 2025 and 374 of them from China. The UN's own index today lists 3,863 for 2025 and none from China.
The difference is registration. The live UN index holds only objects a state or organisation has formally registered, and China registered none of its 2025 launches. The registration lag is a median of 70 to 85 days for launches in 2020 to 2024, and 92% to 96% of them are registered within a year.
So the UN index is not a launch counter. Our World in Data's 2025 figure matches the independent catalogues, which is why we can quote it, but we cite the UN figures as a registry and not as a total.
The limits
A launched satellite is not an active one. Of the 4,605 launched in 2025, 4,393 are active on 19 November 2026. Of the 544 launched in 2019, only 134 are, because early Starlink batches were brought down on purpose.
The counts include 35 payloads lost in launch failures in 2025 and exclude rocket stages and debris. The Everything else group contains more batch-launched constellations, such as those of Planet and Spire, that we did not separate, so Starlink's share is the best-measured one and the five-network share is a floor. 2026 is a partial year, with 3,951 to 19 November.
Counts also say nothing about capability. A Starlink satellite and a 2010 communications satellite are different machines, and launched mass rose far less than the count.
J. McDowell: General Catalog of Artificial Space Objects Our World in Data: Annual number of objects launched into space
The launch, owner, mass and activity counts are from Jonathan McDowell's General Catalog of Artificial Space Objects, release 1.8.9, data update of 19 November 2026, which is released under a Creative Commons CC BY licence. Data from J. McDowell, planet4589.org/space/gcat. The groupings, shares, ratios and per-day figures are FactsFigs' own arithmetic on its launch log, and constellations are named by the catalogue's owner codes and names. CelesTrak's count and the United Nations registry figures were read for comparison, and the UN index was read on 20 November 2026. Our World in Data's chart is built from the UN's Online Index of Objects Launched into Outer Space and is cited for context only. Starlink statements are from SpaceX's 2025 progress report and from Via Satellite's report of 20 October 2025. The data was manually collected by FactsFigs. Full credit for the catalogue goes to Jonathan McDowell.
The portrait of Elon Musk in the chart is a crop of a photograph by Gage Skidmore, licensed under CC BY-SA 4.0 (creativecommons.org/licenses/by-sa/4.0), from Wikimedia Commons. It was cropped to a circle and resized. It marks the founder of SpaceX, which builds Starlink, and is not data.
FactsFigs reviews, cleans and cross-checks every source dataset before shaping it into a data story. Each visualization is created and designed in FactsFigs Design Studio, an internal tool developed and owned by FactsFigs, and is the original work of a FactsFigs author, not an AI-generated copy of any existing graphic. Individual assets within a visual may or may not be produced with AI tools, but the design of the visual itself is solely FactsFigs' own.
Figures are estimates at the time of publication, provided for information only. Nothing here is financial advice or a guarantee of accuracy.
Last verified: 21 Nov 2026
Related Publications
NASA's archive lists 6,470 exoplanets from every telescope. Kepler, TESS and K2 found 67% of them, and two Kepler papers added almost a third.
19 Nov 2026
FAA price estimates for 32 rockets show no trend by launch year. Falcon 9 is $3,604 per kg against a $12,719 median, and its list price is down 7% since 2018.
18 Nov 2026
Transistor counts for 63 chips from 1971 to 2025 still follow a doubling every two years for the biggest packages, while single dies slowed to 2.8 years.
17 Nov 2026
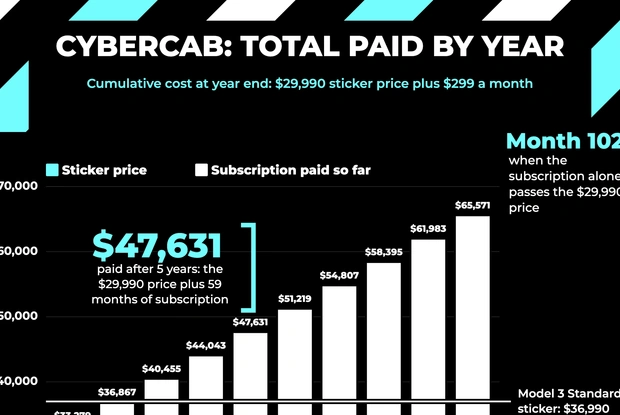
Tesla's Cybercab costs $29,990, under the $30,000 Musk promised, but needs a $299-a-month subscription to run. Total paid after 5 years: $47,631.
15 Nov 2026