Which Countries Make the World's Most-Used AI Models?

By Saif Ur Rahman Published 12 Nov 2026 Updated 12 Nov 2026
FactsFigs
0 shares

TL;DR: Which Countries Make the World's Most-Used AI Models?

The origin of the 50 most-used models on OpenRouter, January 2025 to May 2026

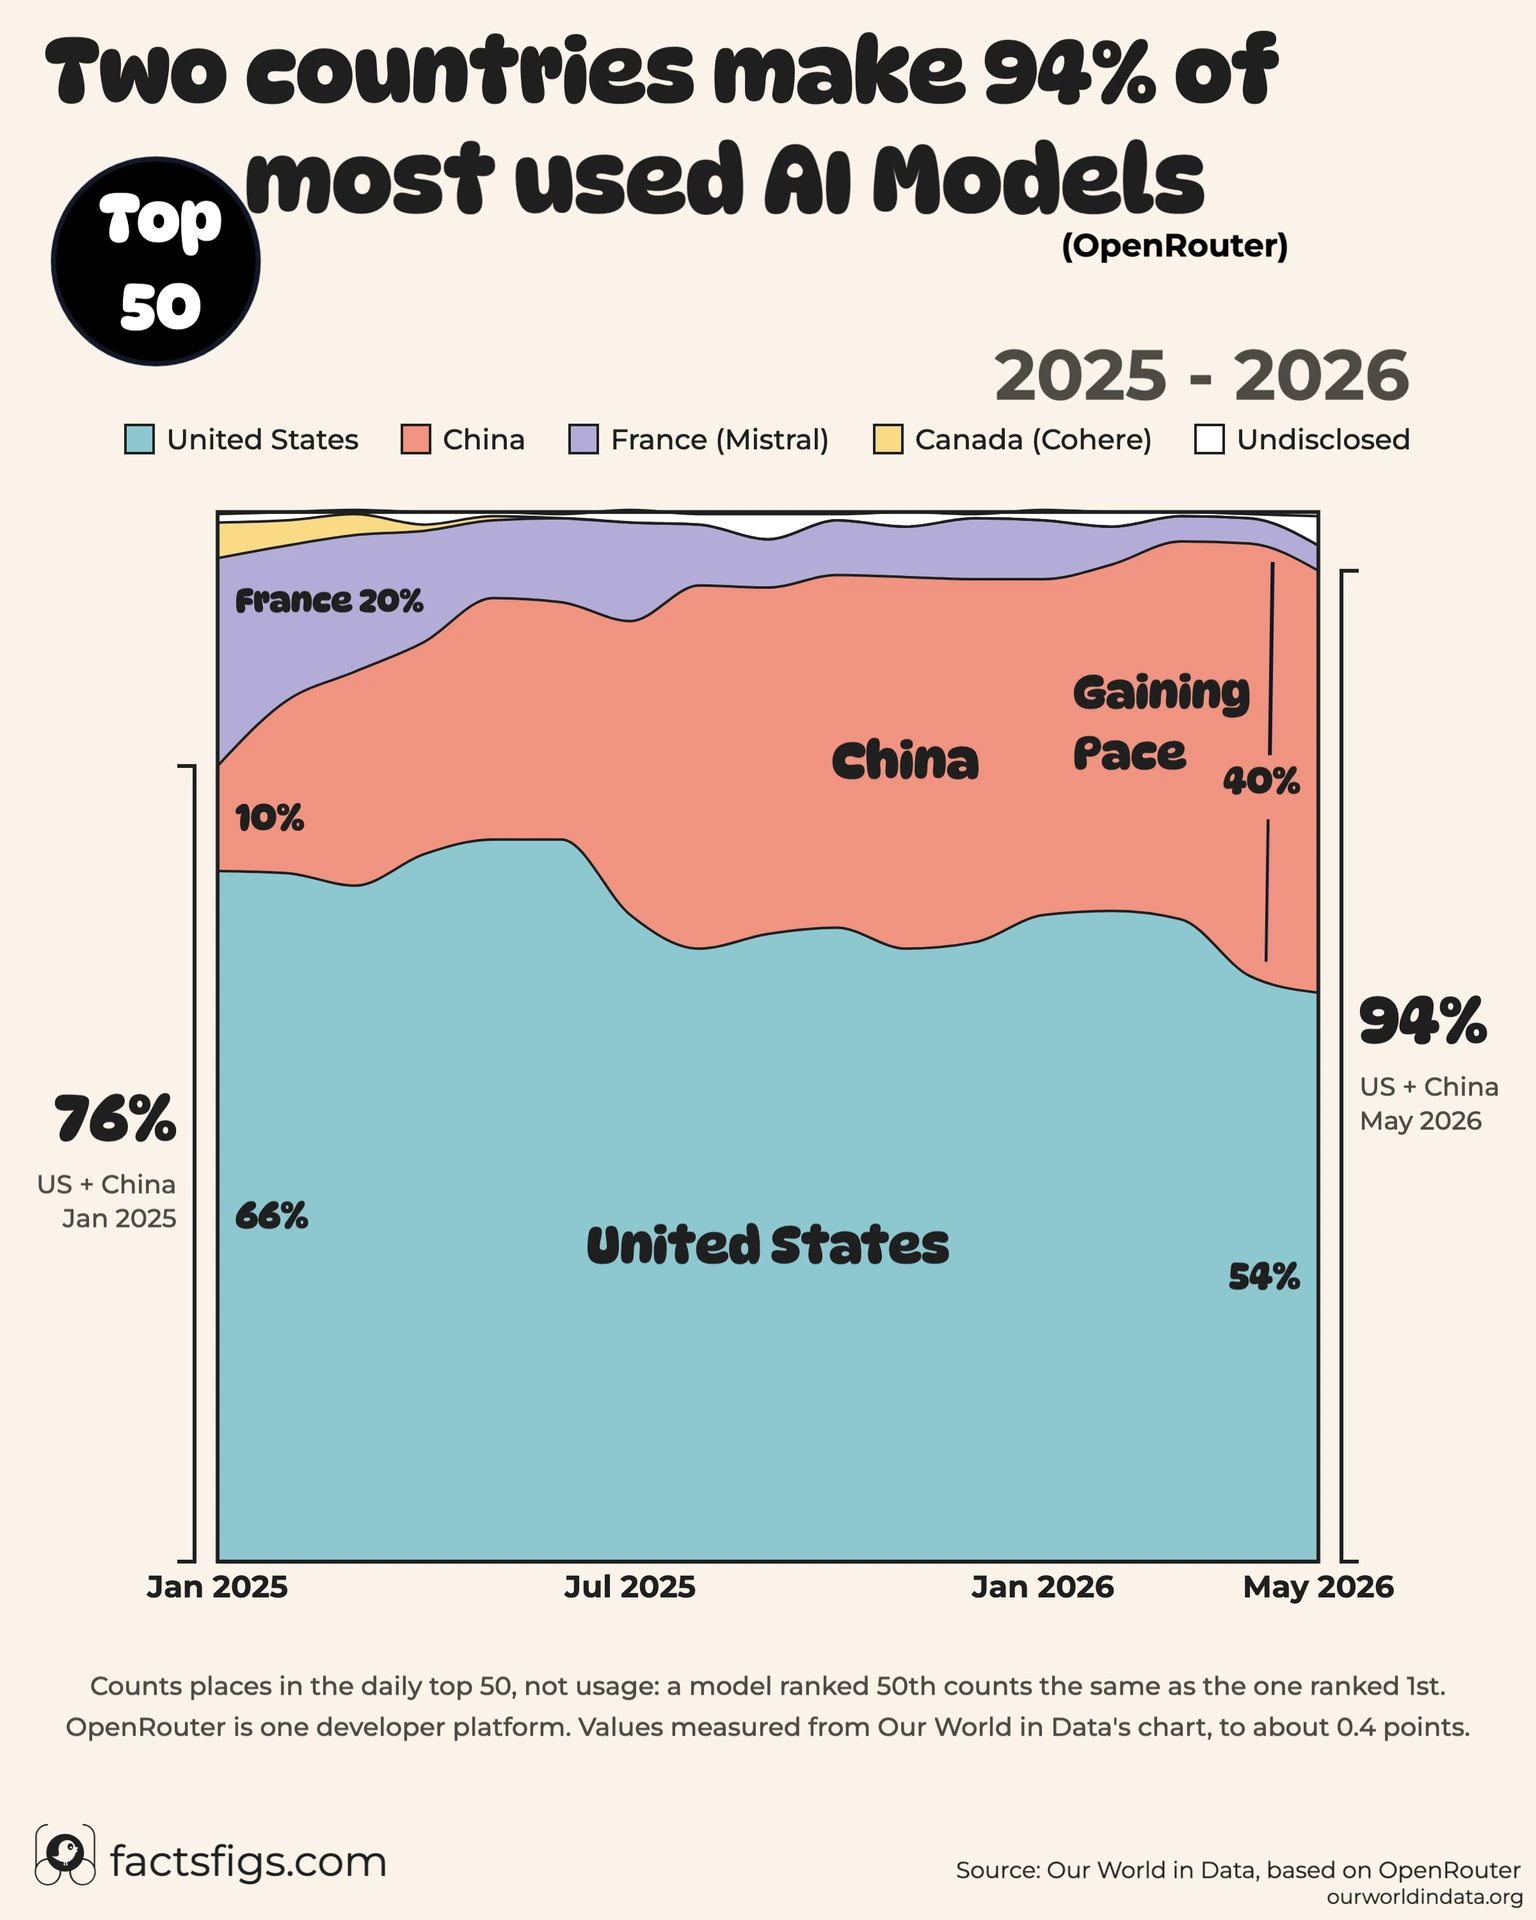
Almost all of them come from two countries. In May 2026, companies based in the United States trained 54% of the 50 most-used AI models on OpenRouter and companies based in China trained 40%, according to an analysis by Our World in Data. Together that is 94% of the places, up from 76% in January 2025. The two countries did not grow together. China's share quadrupled while the US share fell, and the models squeezed out came mostly from France and Canada.

! What Changed in 17 Months:

  • •
    China Quadrupled: From 10% of the top 50 places in January 2025 to 40% in May 2026, or about 5 models to about 20.
  • •
    The US Still Leads: Its share fell from a peak of 69% in mid-2025 to 54%, but that is still a majority of the places.
  • •
    Europe All but Left: France's share fell from 20% to 2%. In January 2025 it held twice China's share.
  • •
    Canada Dropped Out: Cohere's models held 3% of the places in January 2025 and none from June 2025.

? The Numbers Behind the Story:

  • •
    US and China combined, May 2026: 94%
  • •
    US and China combined, January 2025: 76%
  • •
    China, May 2026: 40% (10% in Jan 2025)
  • •
    United States, May 2026: 54% (66% in Jan 2025)

The US lead over China shrank from 56 points to 14 in 17 months. Over the same months the share held by everyone else, undisclosed developers included, fell from 24% to 5%.

Continue reading below for the full detailed article →

Overview

What the Top 50 on OpenRouter Measures

OpenRouter is a platform that lets developers reach hundreds of AI models through a single interface, from large companies such as Google, OpenAI, Anthropic, Meta, DeepSeek and Alibaba as well as many smaller ones. It publishes a daily list of its 50 most-used models. Edouard Mathieu of Our World in Data took every daily list from January 2025, gave each model the country of the company that trained its base weights and averaged how many of the 50 places each country held in each month. The shares in this post are those averages divided by 50. A model ranked 50th counts the same as the model ranked first, so a share here is a share of places on the list, not a share of the tokens that flow through it.

Three Numbers That Explain the Shift

Two countries took a larger share of the list each quarter, one of them grew fast and the third-largest source of models nearly vanished.

US and China Held 94% of the Places

94%

In May 2026, models trained by US and Chinese companies filled an average of 47 of the 50 daily places on OpenRouter. In January 2025 they filled about 38. The combined share passed 90% in May 2025 and has stayed above 93% since October 2025.

China's Share Rose From 10% to 40%

40%

Chinese companies trained about 5 of the 50 most-used models in January 2025 and about 20 in May 2026. The share peaked at 41% in April 2026 and has never passed the US share.

France's Share Fell From 20% to 2%

2%

French models held about 10 of the 50 places in January 2025, twice China's count at the time. By March 2026 France held about one. Our World in Data notes that Mistral AI's NeMo model is what keeps France on the list.

The Top 50 Places in May 2026

  • United States 54% About 27 of the 50 daily places, down from about 33 in January 2025.
  • China 40% About 20 of the 50 daily places, up from about 5 in January 2025.
  • Everyone else 5% France at 2% and models from undisclosed developers at 3%; Canada at zero.

The Concentration

Which Countries Make the Most-Used AI Models?

The United States and China, and almost nobody else. In May 2026, US companies trained an average of 27 of the 50 most-used models on OpenRouter each day and Chinese companies trained 20. That is 54% and 40% of the places, 94% between them. The remaining places went to France, with about one model, and to anonymous preview models whose developers had not been disclosed.

Seventeen months earlier the list looked more varied. In January 2025 the two countries held 76% of the places, France held 20% and Canada 3%. The combined US and Chinese share climbed past 90% in May 2025, reached 94% in October 2025 and has stayed above 93% in every month since. Its highest point was 97% in March 2026.

The 94% in May 2026 is therefore the latest figure, not a record. It dipped from 97% in April mainly because anonymous preview models held more places that month, about 1.4 on average against 0.2 in April, not because any third country came back.

The Fastest Riser

How Fast Did China's Share of the Top 50 Grow?

Chinese companies trained about 5 of the 50 most-used models in January 2025, 10% of the places. By February 2025 they had already passed France, and by May 2026 they held about 20 places, or 40%. China's share quadrupled in 17 months.

The rise came in two clear steps rather than a steady climb. Between June and August 2025 China's average count went from about 11 to about 17, the largest rise in the series, taking its share from 23% to 35%. It then stayed between 32% and 36% from August 2025 to March 2026. A second step came between March and April 2026, from 36% to 41%, the highest share China has reached.

Neither OpenRouter's rankings nor Our World in Data's analysis say why. The data records where the most-used models come from, not why developers chose them, so the timing of the two steps is a pattern in the list rather than an explanation of it.

The Leader

Is the US Still Ahead of China in AI Models?

Yes, on this list, though by much less than before. US companies held 66% of the top 50 places in January 2025 and reached their highest share, 69%, in May and June 2025. After that their share fell to 58% by August 2025 and to 54% by May 2026, about 27 models a day.

The gap between the two countries narrowed from 56 percentage points to 14. Counted in models, the US went from about 28 more than China in the daily top 50 to about 7 more. China has not overtaken the US in any month of the series.

The US decline and the Chinese rise mirror each other closely. Between June and August 2025, the US lost about 10 points while China gained about 12, and between March and April 2026 the US lost about 5 while China gained about 5. Most of what China gained on the list in those months, the US lost.

Everyone Else

What Happened to Europe and Canada?

France was the third country on the list, and in January 2025 it was a strong third. French models took about 10 of the 50 daily places, 20% of the list and twice China's share at the time. France's share then slid, to below 10% from May 2025 and to 2% from March 2026, about one model a day. Our World in Data credits France's place on the list to Mistral AI, whose NeMo model is the one that remains.

Canada left the list entirely. Our World in Data notes that Cohere's Command R models represented Canada early in 2025. They held 3% of the places in January 2025, fell below 1% by April and were gone from June 2025.

Put together, every country other than the US and China held 23% of the places in January 2025 and 2% in May 2026. No other country appears in the series at all. The models whose developers were not disclosed, mostly anonymous previews, never held more than 3%.

Month by Month

Share of the Top 50 by Country, Every Month

Each country's average share of the 50 daily places on OpenRouter, by month. Sort any column to reorder the rows.

Jan 202565.81019.83.40.875.8
Feb 202565.616.414.82.40.882
Mar 202564.420.41320.484.8
Apr 202567.420.210.60.61.287.6
May 202568.8237.40.40.491.8
Jun 202568.822.6800.491.4
Jul 202561.6289.401.289.6
Aug 202558.434.65.80193
Sep 202559.8334.602.492.8
Oct 202560.433.65.200.694
Nov 202558.435.44.801.493.8
Dec 20255934.65.800.493.6
Jan 202661.6325.60193.6
Feb 202662333.601.495
Mar 202661.2362.400.497.2
Apr 202655.841.22.400.497
May 202654.240.22.402.894.4

Source: Our World in Data, based on OpenRouter. Our World in Data publishes this series as a chart; FactsFigs measured each value from it to within about 0.4 percentage points and divided the average daily count by 50. Rows may not sum to exactly 100 for that reason.

Reading It Carefully

What This Data Can and Cannot Tell Us

This is one platform. OpenRouter serves developers who build on AI models through its interface. People chatting in the ChatGPT, Claude or Gemini apps, and companies calling a lab's own API directly, are not in these figures, so the list shows what is used on OpenRouter, not what the world uses.

It counts places, not usage. A model in 50th place counts as much as the model in first, so a country with many mid-ranked models can hold a larger share than a country with one dominant model. Our World in Data assigns each model to the country of the company that trained its base weights, so a model adapted elsewhere still counts for the country where it was first trained.

The figures are measured, and they end in May 2026. Our World in Data published the series as a chart, so each value here was read from it and is accurate to about 0.4 points. The analysis was published on 30 June 2026 and does not cover the months since.

Data Source and Attribution

Our World in Data, based on OpenRouter

The data behind this story comes from Our World in Data's analysis "US and Chinese companies train almost all of the world's most-used AI models" by Edouard Mathieu, based on OpenRouter's daily rankings of its 50 most-used models. Our World in Data's work is published under a CC BY 4.0 licence. FactsFigs measured the monthly values from the published chart and redrew them; the measurements are approximate, so no data download is offered.

FactsFigs reviews, cleans, and cross-checks every source dataset before shaping it into a data story. Each visualization is created and designed in FactsFigs Design Studio, an internal tool developed and owned by FactsFigs, and is the original work of a FactsFigs author, not an AI-generated copy of any existing graphic. Individual assets within a visual may or may not be produced with AI tools, but the design of the visual itself is solely FactsFigs' own.

Figures are estimates at the time of publication, provided for information only; nothing here is financial advice or a guarantee of accuracy.

Last verified: 12 Nov 2026

The charts in this article were built with our own publishing system. See what it does →