TL;DR — Which Countries Actually Have AI Capacity?
Two countries, then a cliff, then a hundred-odd countries nobody measured
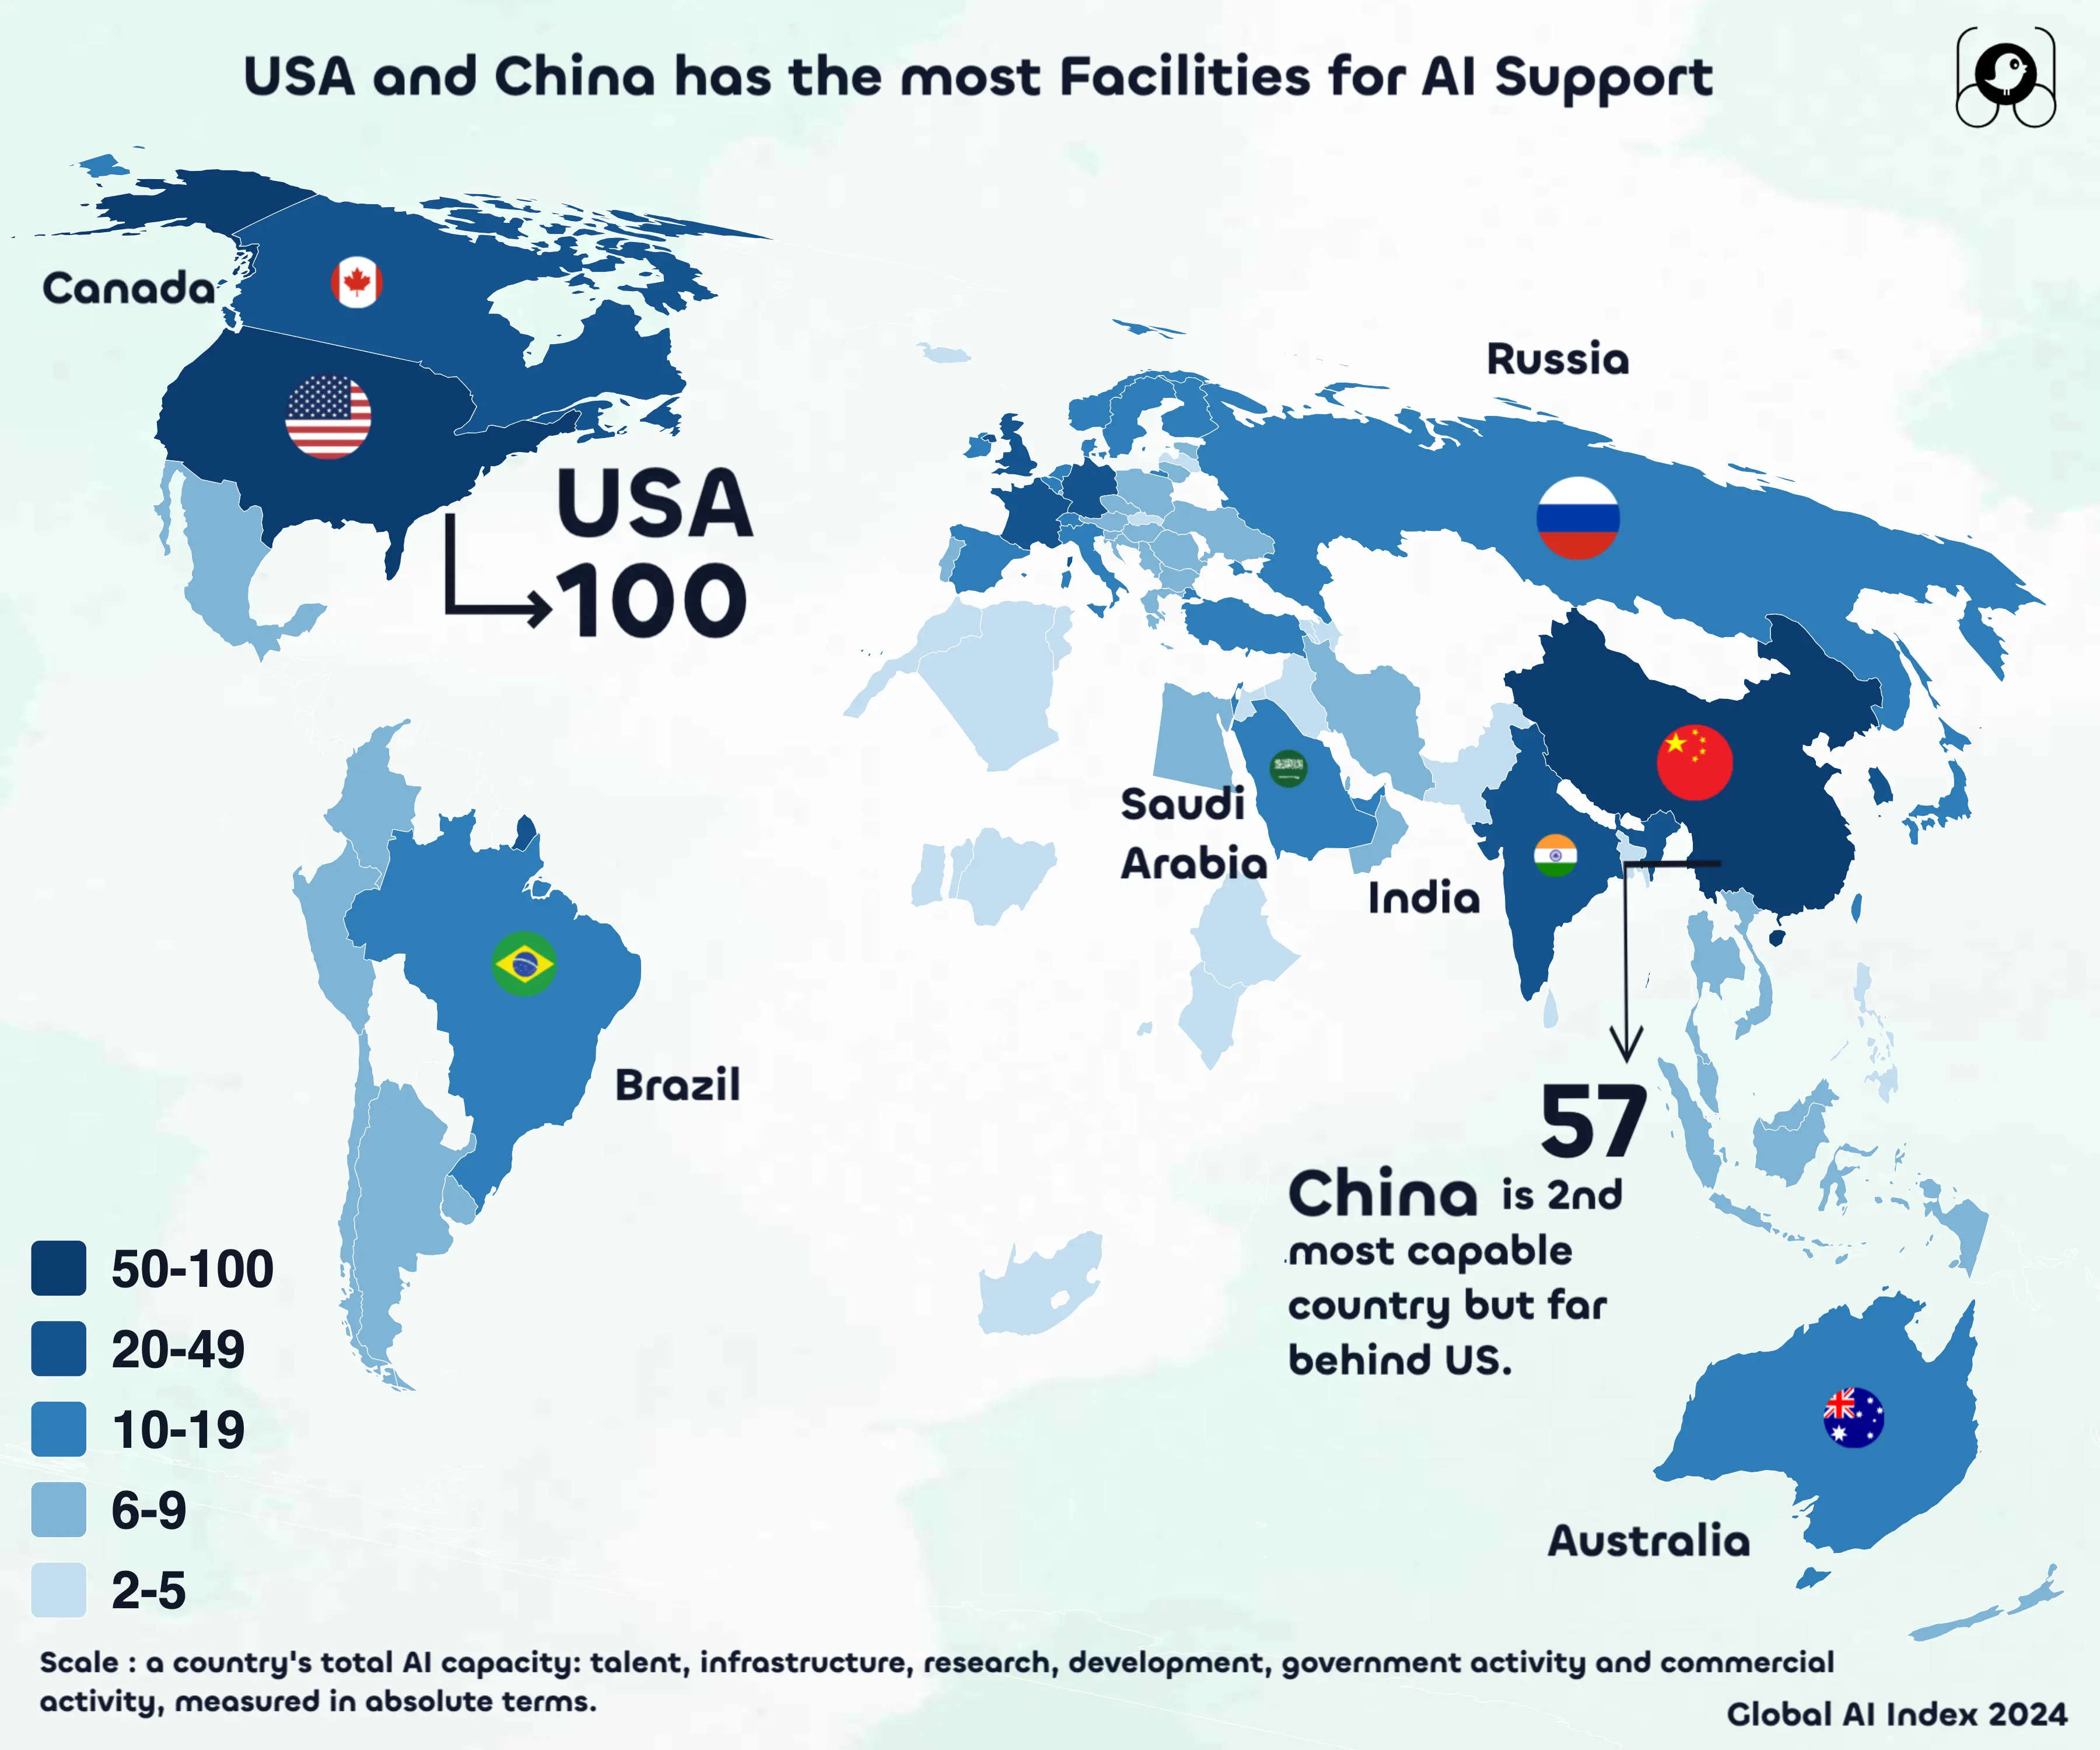
Tortoise Media's Global AI Index scores 83 economies on Scale, a composite of absolute AI output: chips, servers, models, papers, companies, capital and people, counted in totals rather than per head. The United States sits at 100, China at 57, and the next countries — the United Kingdom and India — at 24.
The distribution underneath is not a gradient. Only eight economies reach 20. Sixty of the 83 score 10 or below, twenty-three score 5 or below, and the median country scores 8 against the leader's 100.
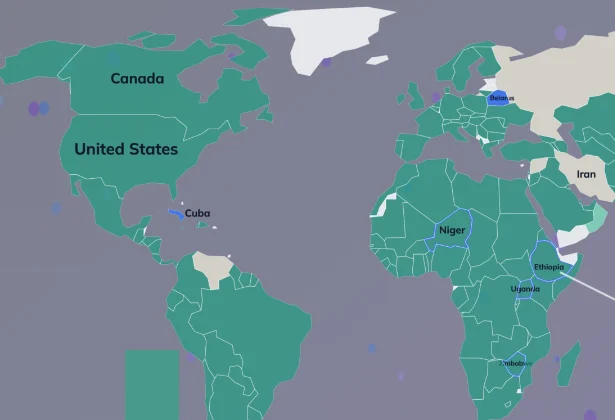
The blank space is the other finding. Of the UN's 193 member states, 112 have no Scale score at all — including every country in Central Asia, every country in Central America and the Caribbean, and 42 of Africa's 54. Grey on this map means unmeasured, not zero.
! What the Scale Column Actually Says:
•
The Gap Is at the Top, Not the Bottom:China trails the United States by 43 points and leads third place by 33. That second-to-third gap is larger than the entire distance from third place to last — 24 down to Ethiopia's 2, a span of 22 points across 81 countries.
•
Scale and Intensity Rank Almost Opposite Things:Singapore is 11th on Scale at 16 and 1st on intensity at 100. India is joint 3rd on Scale at 24 and 36th on intensity at 19. The same index, the same year, two nearly inverted leaderboards.
•
Most of the Index Has No Development Score:Thirty-three of the 83 economies score zero on the development sub-pillar, which covers open-source AI models and AI patents. Twelve score zero on research. The floor is real, and it is wide.
? The Figures Behind the Five Bands:
•
Top band:2 countries at 50 or above — the United States and China
•
Second band:6 countries between 20 and 49, from the UK down to Canada
•
The bulk:54 of 83 economies score below 10 on Scale
•
Not on the map:112 UN member states have no score in the index
Scale is deliberately an absolute measure, so it tracks the size of a country's economy almost as closely as the quality of its AI policy — which is exactly why the World Bank pairs it with intensity rather than reading it alone. Taken on its own it answers one narrow question well: where does the physical and commercial bulk of AI actually sit? The answer in September 2024 was two countries, six runners-up, and a very long tail.
Continue reading below for the full detailed article →
Overview
Why This Map Is Two Countries and a Very Long Tail
There is a common way of talking about AI as a race with a crowded field — a dozen serious national contenders, each with a strategy document and a supercomputer. The Scale column of the Global AI Index does not describe that world. It describes one country at 100, one at 57, and eighty-one economies sharing the space between 24 and 2. Six countries clear 20. Sixty do not clear 10. And the map's largest single feature is not any country's colour but the grey, because the index scores 83 economies and leaves the other 112 UN member states out entirely. Read carefully, that blank is the most honest thing on the chart.
The Three Numbers That Define the AI Capacity Map
One number sets the ceiling, one describes the floor, and one describes the part of the world the index never reaches. Between them they say more about the shape of global AI capacity than any ranking of the top ten does.
100 — the Score Every Other Country Is Measured Against
100
The United States holds the top Scale score, and the index is normalised so the leader sits at 100 rather than earning a mark out of a hundred. Its position is not marginal: it also leads talent, infrastructure, research, development and the commercial sub-pillar, taking the maximum score on all five of them.
60 of 83 Scored Economies Sit at 10 or Below
60
Sixty of the 83 economies in the index score 10 or lower on Scale and twenty-three score 5 or lower, which puts the median country at 8. Those are not near-misses on the leaders. A country at the median has roughly one-twelfth the measured AI capacity of the United States, on an index built to reward absolute size.
112 UN Member States Are Not in the Index at All
112
The index covers 83 economies, two of which — Taiwan and Hong Kong — are not UN member states, so 81 of the UN's 193 members are scored and 112 are not. That absence is geographically clustered rather than scattered, and on a world map it reads as a single continuous blank across the middle of the globe.
The United States by the Numbers
Scale 100 Absolute AI capacity; the top of the index.
Intensity 73 Third worldwide, behind Singapore and Israel.
Government strategy 83 Its weakest sub-pillar; Saudi Arabia scores 100.
What Scale Measures, and What It Deliberately Ignores
Tortoise builds the Global AI Index from 122 indicators across three pillars — implementation, innovation and investment — split into seven sub-pillars: talent, infrastructure, operating environment, research, development, commercial ecosystem and government strategy. For most of those indicators the index takes two readings. One counts total output, and that feeds Scale. One counts the same output relative to population or economy size, and that feeds intensity.
The two are weighted differently on purpose. Tortoise weights each relative indicator at one-third of its absolute twin, which makes the overall index roughly 75 per cent Scale and 25 per cent intensity — a change from the 67:33 split used in the fourth edition, made because access to computing power and capital increasingly decides AI outcomes.
So Scale is an answer to a specific question: how much AI is physically and commercially present in this country in total? It is not a measure of how well a country uses AI, how ready its institutions are, or how much of its economy the technology touches. Those are intensity questions, and they produce a different ranking. The World Bank, which plots both axes together, describes the pair as measuring a country's "AI readiness"; Tortoise's own word for what it measures is capacity, and the distinction is worth keeping.
One more thing about the numbers themselves. Tortoise's methodology states that the overall score and each sub-pillar score are normalised between 100 and the lowest original score, rather than stretching the floor down to zero, on the stated grounds that giving a country zero would wrongly imply no AI activity is happening there at all. That is why Ethiopia, last on all three of scale, intensity and the overall index, scores 2 and not 0. It is also why none of these figures is a mark out of a hundred: they are positions relative to whoever leads. The World Bank's own plot of the same data makes the point by accident, drawing its intensity axis out to 110 with Singapore's leading score of 100 sitting well short of the end.
The Distribution
The Drop From Second to Third Is the Whole Story
The United States scores 100. China scores 57. The United Kingdom and India tie for third at 24. That means the gap between second and third place — 33 points — is larger than the gap between third place and last, which runs from 24 down to Ethiopia's 2 across eighty-one countries. Every familiar phrase about a global AI field applies to a range of 22 points; the top of the table needs its own scale.
Below the leaders the field compresses fast. France and Germany sit at 23, South Korea at 22, Canada at 20, and that is the entire 20-plus group: eight economies out of 83. Japan is 19, Saudi Arabia 18, Singapore 16, Spain 15. By the time you reach the twentieth-ranked country you are in single digits of difference between neighbours, and rank ordering stops carrying much meaning.
The tail is where most of the index lives. Sixty of the 83 economies score 10 or below, twenty-three score 5 or below, and the median score is 8. Thirty-one countries sit in the 6-to-9 band alone, which on a map means a third of the coloured world is a single shade apart from another third.
It is worth being blunt about what that shape rules out. There is no smooth global gradient here, no continuum from leaders through a middle tier to laggards. There is a peak of two, a shelf of six, and a floor that 70 per cent of the scored world stands on.
The Shape of the Field
Eight of the 83 scored economies reach 20 on Scale. Sixty are at 10 or below. The median country scores 8, against the leader's 100.
The Other Axis
Singapore Is 11th Here and 1st on the Other Measure
Singapore scores 16 on Scale, which puts it eleventh — behind Japan and Saudi Arabia, level with nobody in particular. On intensity it scores 100 and leads the world outright. Its overall index position, which blends the two at 75:25, is third. Three defensible rankings for one country in one edition of one index, and each of them answers a different question.
The inversion runs both ways. Israel is thirteenth on Scale at 14 and second on intensity at 74. Switzerland is joint twenty-fourth on Scale at 10 and fourth on intensity at 63. Luxembourg scores 9 on Scale and 53 on intensity; Estonia scores 6 and 39. These are small, rich, densely capitalised economies that look modest in totals and formidable per head.
Going the other way, India ties for third on Scale at 24 and ranks thirty-sixth on intensity at 19. China is second on Scale at 57 and twenty-first on intensity at 33. Brazil is 11 and 16. Indonesia is 8 and 11. Large populations divide large totals into unremarkable per-head numbers, which is the arithmetic the intensity measure exists to expose.
This is why the wording matters. A country high on Scale has a lot of AI in it. Whether that AI has reached its firms, its schools and its public services is a separate finding on a separate axis, and the two are not interchangeable in either direction.
The index scores 83 economies. Two of them, Taiwan and Hong Kong, are not UN member states, so 81 of the UN's 193 members are covered and 112 are not. On a world map that is not a scattering of small gaps — it is a continuous blank running from the Sahel across Central Africa, up through Central Asia, and down through Central America and the Caribbean.
Africa contributes twelve countries to the index: Algeria, Benin, Egypt, Ethiopia, Ghana, Kenya, Mauritius, Morocco, Nigeria, Rwanda, South Africa and Tunisia. The continent has 54. Central Asia contributes none — no Kazakhstan, no Uzbekistan, no Kyrgyzstan, Tajikistan or Turkmenistan. Central America and the Caribbean contribute none either, so the whole region between Mexico and Colombia is unshaded.
The reason is coverage, not judgement. Tortoise says it built the country list in consultation with experts and through literature review, starting from countries that had published national AI strategies because those offered enough data to rank. The fifth edition added 21 new countries on exactly that basis, so the blank is shrinking — slowly, and from a list that grew because governments published documents, not because capacity appeared.
The practical consequence is that grey cannot be read as low. A country with no score might have a functioning AI sector and no comparable statistics, or no sector at all; this map cannot tell you which. Anyone using it to argue about where AI is absent is reading the index's coverage decisions, not the world.
The Mechanism
Why Scale Compounds and Small Markets Lose Ground
The World Bank's Digital Progress and Trends Report 2025, which is where this index reaches most policy readers, makes the argument for why a chart like this gets more lopsided rather than less. Digital technologies carry heavy economies of scale: once a platform or a model exists it can be served at close to zero marginal cost, and its value grows with the number of users. That produces winner-takes-most dynamics in which the largest markets breed the most competitive firms, which then attract more users, more data, more talent and more investment.
A large domestic market also lets firms test across millions of users and sectors without hitting regulatory or linguistic borders, and it justifies the two most expensive commitments in AI — frontier research and compute infrastructure. The report's own phrase for the result is that early advantages "can rapidly snowball into global dominance, as seen in China and the United States", while smaller and fragmented economies risk becoming "consumers of AI, not creators or shapers".
The compute figures underneath that argument are stark. In 2024 the United States hosted 50 per cent of the world's secure internet servers, other high-income countries a further 41 per cent, and everywhere else 9 per cent. On a per-capita basis the United States has roughly 200 times as many servers as a typical middle-income country and 20,000 times as many as a low-income one. As of June 2025 high-income countries hosted 86 per cent of the world's top 500 high-performance computing systems and 97 per cent of their capacity.
None of that is a law of nature, but it does explain why the Scale column is so top-heavy and why the top has been stable. Capacity of this kind is accumulated, not declared, and the countries accumulating it fastest are the two already at the top of the map.
What You Actually Do About It
The 4Cs — What Each Readiness Level Is Told to Buy First
The World Bank's Table 6.1 sorts AI investment priorities into four foundations and three readiness levels. The levels are the Bank's own groupings, not Tortoise's: the index publishes scores and ranks, and the thresholds separating high from medium from low are not published anywhere. Read the columns as advice that changes with capacity, not as a classification anyone can look a country up in.
Connectivity
The indispensable baseline, and the one that still means electricity rather than bandwidth at the bottom of the distribution. Each level inherits the previous level's work rather than replacing it.
Reliable infrastructure, energy and device access
Low readiness: Provide universal access to electricity; improve broadband coverage, quality and affordability; support device ownership and access
Medium readiness: Upgrade broadband infrastructure; provide internet exchange points; promote digital goods and services exports
High readiness: Upgrade broadband infrastructure; support and develop the local digital sector and digital ecosystem
Compute
The report calls compute the "new electricity" of the AI era. Note that the advice at the bottom is explicitly to rent rather than build — the opposite of the sovereign-data-centre instinct many national strategies start from.
AI chips, servers, data centres and cloud services
Low readiness: Rely mostly on cloud computing and foreign data centres
Medium readiness: Invest in domestic data centres; provide data embassies and regional data centres for small countries; partner strategically with foreign cloud and AI chip providers
High readiness: Develop and purchase cutting-edge AI chips; build high-performance computing systems; build AI data centres
Context
Without locally relevant data and content, the report argues, AI tools stay irrelevant or untrusted. This is the column where the ladder from consumer to shaper is clearest: translate, then collect, then own.
Local training data, models and applications
Low readiness: Rely largely on translation and existing AI models
Medium readiness: Collaborate with global companies to collect local data; improve government statistical capacity; combine translation with investment in local data sets; develop synthetic data; customise open-source models; build local applications in niche markets
High readiness: Invest in local training data across major domains; customise open-source models and create cutting-edge domestic ones; enhance data governance
Competency
The only foundation where the same instruction appears at two different levels — attracting and retaining talent is advice for medium and high readiness alike, and it is the one input a country can lose overnight to another country's salaries.
Digital skills, from literacy to frontier research
Low readiness: Improve digital literacy and basic-to-intermediate digital skills
Medium readiness: Focus on intermediate and advanced digital skills; attract and retain talent
High readiness: Develop advanced digital and AI skills; develop and support top-notch AI researchers; attract and retain talent
Under the Headline
One Score Can Hide Nine Others Pulling Apart
A single Scale number flattens seven sub-pillars, and some of the countries in the middle of this map are made of contradictions. Saudi Arabia scores 100 on government strategy — the highest in the world, ahead of the United States at 83 — and 4 on talent. It has the most comprehensive published AI plan in the index and almost none of the people to run it, which is exactly the combination a strategy document cannot fix on its own.
Italy scores 100 on operating environment, the top score anywhere, covering trust in AI, practitioner diversity and AI in legislative proceedings. On development, the sub-pillar that counts open-source models and AI patents, it scores 2. India is the mirror image in a different direction: 90 on operating environment and 42 on talent — second in the world behind the United States on that measure — against 15 on infrastructure.
Further down, Rwanda scores 68 on operating environment and 2 on infrastructure. Kenya scores 68 and 5. Iceland scores 36 on infrastructure and 2 on government strategy. These are not rounding artefacts; they are countries doing one part of this well and having no realistic route to the others.
The floor is broader than the headline suggests, too. Thirty-three of the 83 economies score zero on development, twelve score zero on research and seven score zero on the commercial sub-pillar. For more than a third of the countries the index bothers to measure, the entire innovation half of the framework registers nothing at all.
The Full Data Table
All 83 Economies, Ranked by AI Capacity Scale
Every economy in the fifth edition of the Global AI Index, ordered by Scale. The intensity column is the same capacity measured against population and economy size, and the overall column is the published index score that blends the two at roughly 75:25. Ties are ordered as published.
1
🇺🇸 United States of America
100
50-100
73
100
2
🇨🇳 China
57
50-100
33
54
3
🇬🇧 United Kingdom
24
20-49
49
30
4
🇮🇳 India
24
20-49
19
24
5
🇫🇷 France
23
20-49
47
28
6
🇩🇪 Germany
23
20-49
39
27
7
🇰🇷 South Korea
22
20-49
46
27
8
🇨🇦 Canada
20
20-49
49
26
9
🇯🇵 Japan
19
10-19
24
20
10
🇸🇦 Saudi Arabia
18
10-19
30
20
11
🇸🇬 Singapore
16
10-19
100
32
12
🇪🇸 Spain
15
10-19
29
18
13
🇮🇱 Israel
14
10-19
74
26
14
The Netherlands
14
10-19
43
20
15
🇦🇺 Australia
14
10-19
38
18
16
🇹🇼 Taiwan
13
10-19
28
16
17
🇮🇹 Italy
13
10-19
24
16
18
🇫🇮 Finland
12
10-19
51
19
19
Hong Kong
11
10-19
49
19
20
🇦🇪 United Arab Emirates
11
10-19
42
17
Showing 1-20 of 83
Page 1 of 5
The five map bands are a presentation choice made for readability, not an official classification — the index publishes scores and ranks only, and the World Bank's own high/medium/low readiness groupings use thresholds that are not published. Scores are index positions relative to the leader, not marks out of 100.
The Vintage
Nothing Here Has Been Updated Since September 2024
The fifth edition of the Global AI Index was published on 19 September 2024, and it measures output from 2019 to 2024, discarding anything earlier. As of 21 September 2026 it is still the edition Tortoise serves from its own data page, and no sixth edition has appeared. The right way to describe these numbers is as a two-year-old snapshot, not as the current state of anything.
Two years is a long time in this particular field. The index was compiled before the 2025 and 2026 waves of national compute programmes, sovereign data-centre deals and frontier-model releases, and before several of the countries in the middle of this table announced capacity that would move them. It predates most of what the phrase "AI infrastructure build-out" now refers to.
What almost certainly has not changed is the shape. A 43-point lead at the top and a 33-point step down to third place is not the kind of gap that two years of announcements close, and the mechanism the World Bank describes — scale attracting the inputs that create more scale — points the other way. The precise scores here are stale. The structure they describe is the safer part to rely on.
The Verdict
What a Map This Concentrated Actually Settles
Read as a ranking, this map says the United States and China have most of the world's absolute AI capacity and everyone else is arguing over the remainder. Read as a distribution, it says something sharper: that 60 of the 83 economies anyone has measured sit at 10 or below, and that the difference between ranks 20 and 60 is a handful of index points.
Read as a map, though, the finding is the grey. A hundred and twelve UN member states are not in this dataset, which means the most common condition for a country on Earth in this index is not low capacity but no measurement. That is a fixable problem, and a cheaper one than any of the four foundations the World Bank lists.
The thing the data cannot settle is the one people most want from it. Scale says where AI is; it does not say where AI is working. Singapore at 16 and India at 24 are close together on this map and nowhere near each other on the measure of how deeply the technology has penetrated either economy. Any sentence that treats a high Scale score as evidence of readiness has quietly swapped one axis for the other — and on this index those two axes very nearly disagree.
The data behind this story comes from Tortoise Media's Global AI Index, fifth edition, published on 19 September 2024, and was encountered through the World Bank's Digital Progress and Trends Report 2025: Strengthening AI Foundations, whose figure 6.1 on page 95 plots the index's scale and intensity measures against each other. The index itself is Tortoise Media's own work, built from 122 indicators and 24 data sources, and full credit for compiling and maintaining it goes to Tortoise Media; the World Bank report is available under a Creative Commons Attribution 3.0 IGO licence.
FactsFigs reviews, cleans, and cross-checks every source dataset before shaping it into a data story. Each visualization is created and designed in FactsFigs Design Studio — an internal tool developed and owned by FactsFigs — and is the original work of a FactsFigs author, not an AI-generated copy of any existing graphic. Individual assets within a visual may or may not be produced with AI tools, but the design of the visual itself is solely FactsFigs' own.
Figures are estimates at the time of publication, provided for information only — nothing here is financial advice or a guarantee of accuracy.
Last verified: 21 Sept 2026
The charts in this article were built with our own publishing system. See what it does →