TL;DR: How Much Crude Oil Does the US Export, and Is It Still Growing?
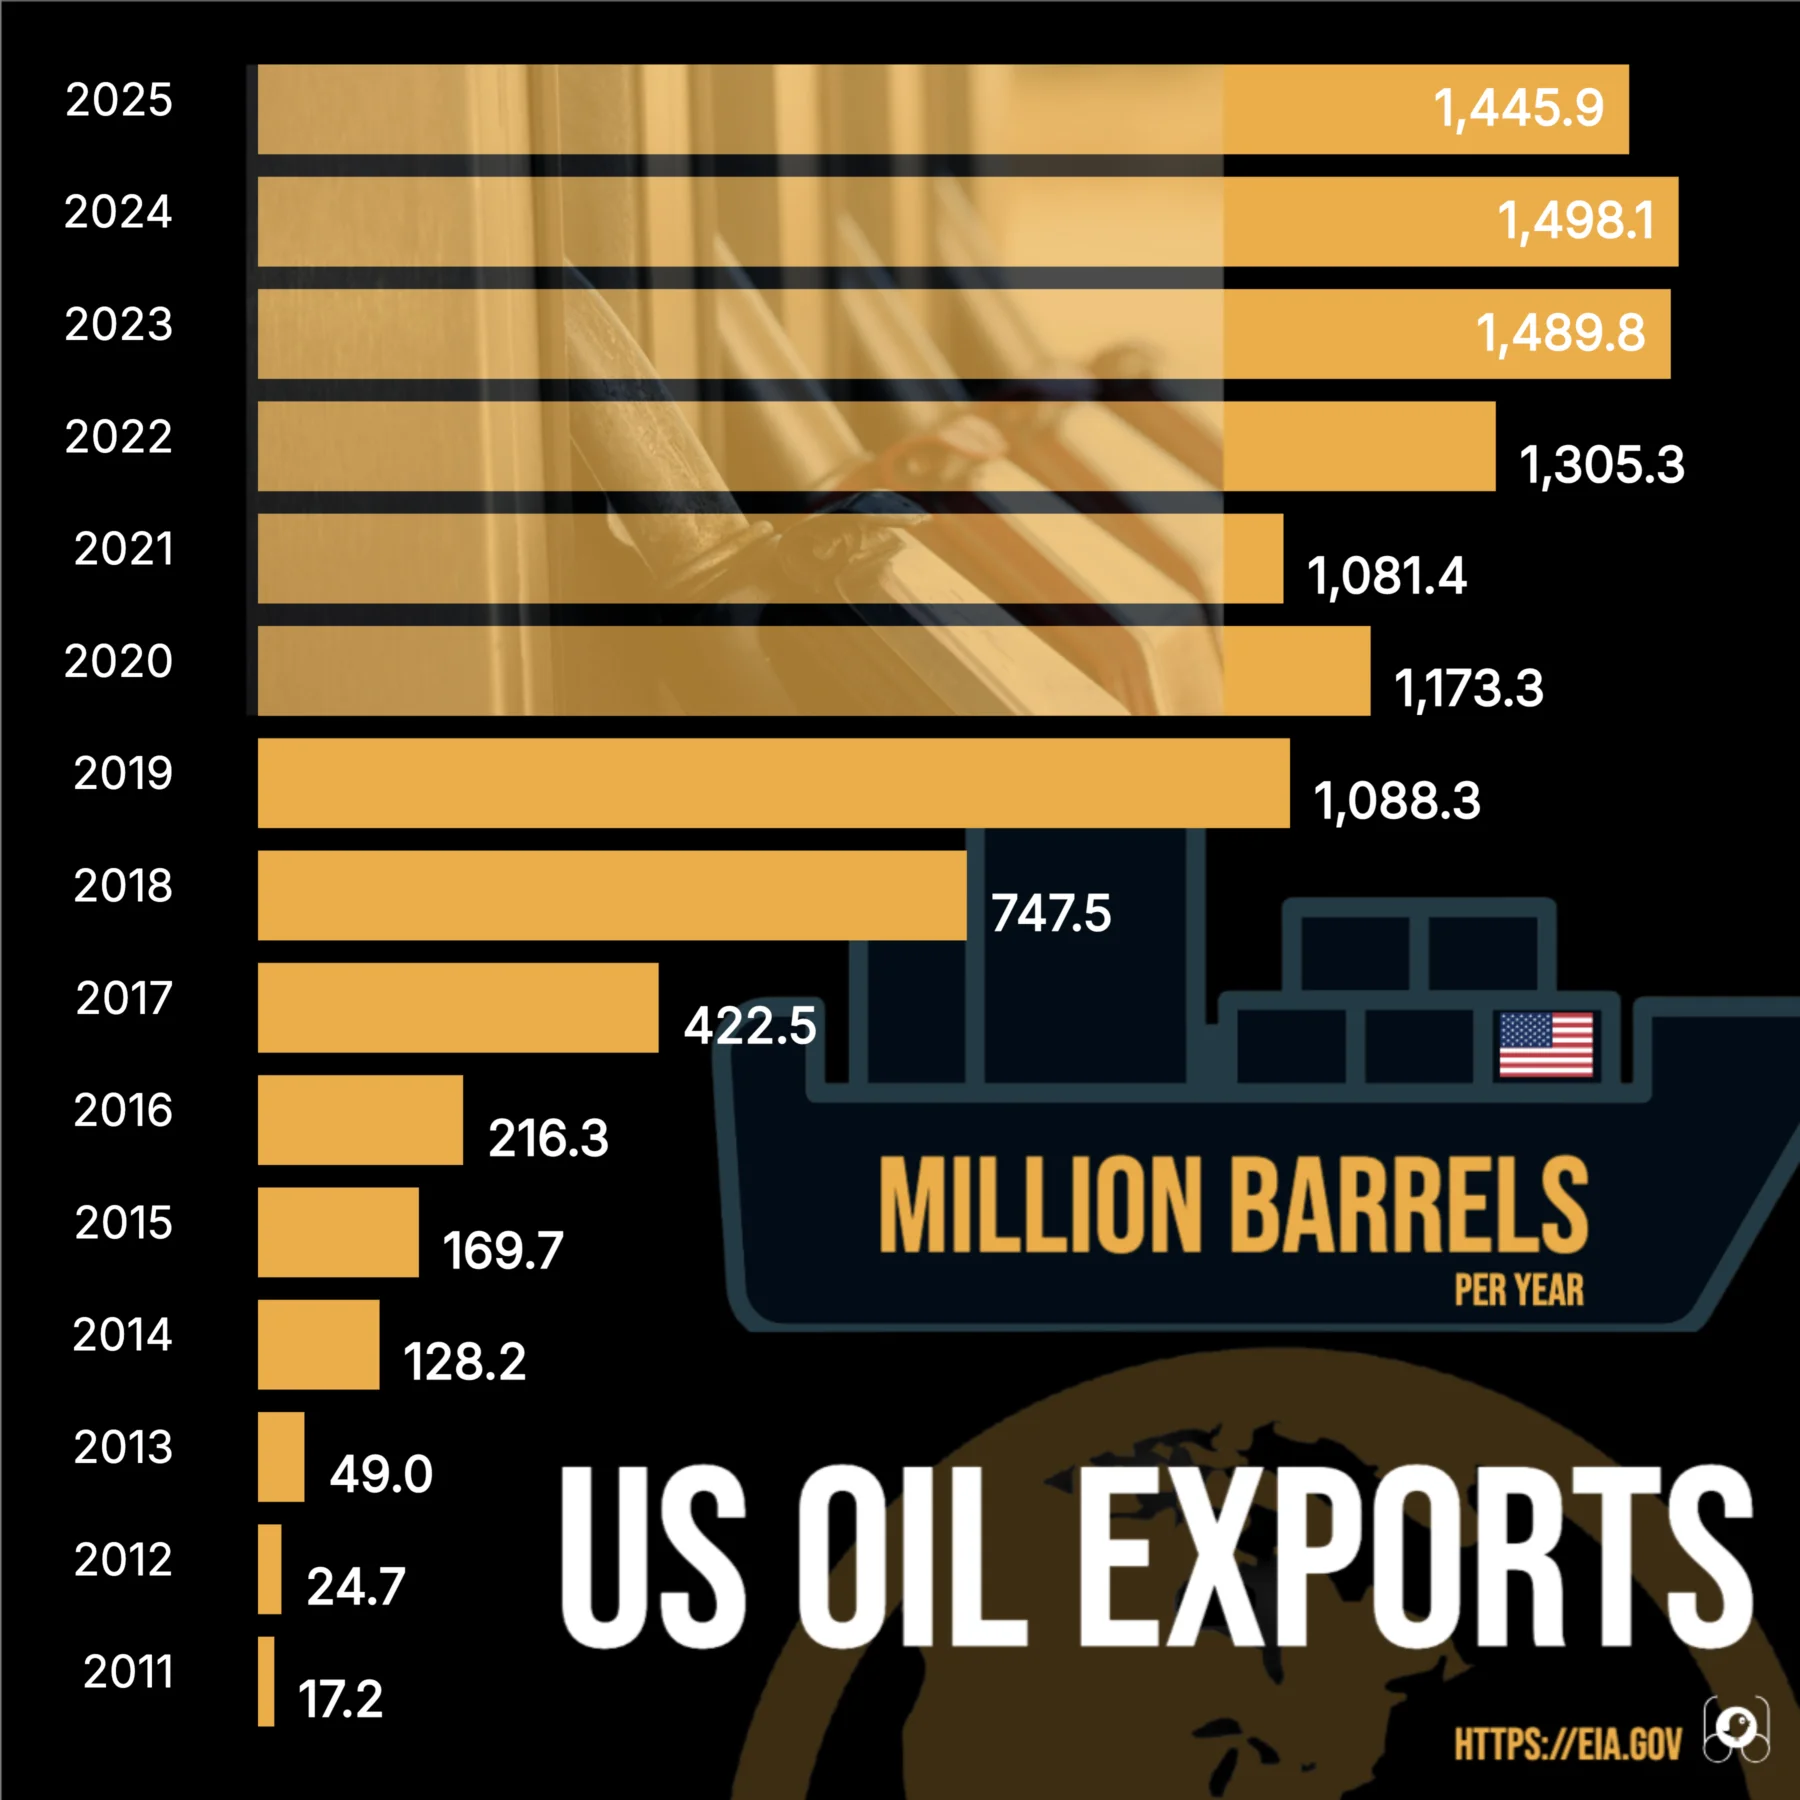
US crude exports rose from 17.2 million barrels in 2011 to 1,445.9 million in 2025, but the line has gone sideways since 2023.
The United States exported 1,445.9 million barrels of crude oil in 2025, about 3.96 million barrels a day. In 2011 the figure was 17.2 million. That is an 84-fold rise in 14 years, and about 89% of the gain arrived after 2015, the year the restrictions on crude exports were lifted in December.
The climb did not end in a record. Exports peaked in 2024 at 1,498.1 million barrels and fell 3.5% in 2025. EIA says more domestic crude went into stockpiles, particularly the Strategic Petroleum Reserve, and into US refineries. An 8% dip in 2021 was followed by a 21% rebound, so one soft year is not yet a verdict.
Exports now equal 29.0% of US crude production, up from 0.8% in 2011. Even so, the US remains a net importer of crude: it bought 2,251.4 million barrels in 2025, 805.5 million more than it sold. Counting refined fuels and gas liquids as well, it has been a net exporter since 2020.
! What the Series Shows:
•
Exports Were Never Zero:Crude exports were 17.2 million barrels in 2011, not nothing. Canada was exempt from the restrictions, and EIA says 92% of 2015's exports went there.
•
The Surge Followed 2015:Between 2016 and 2019 exports rose from 216.3 to 1,088.3 million barrels, the steepest climb in the series by volume.
•
The Latest Year Is Not a Record:2025 came in 3.5% below 2024's 1,498.1 million barrels, which remains the high.
? The Figures Behind the Story:
•
Peak year:2024, 1,498.1 million barrels (4,093 thousand barrels a day)
•
Latest year:2025, 1,445.9 million barrels, down 3.5% on 2024
•
Share of US crude output exported:29.0% in 2025, against a peak of 31.5% in 2023
•
Crude plus products:3,936.4 million barrels in 2025, a record, of which crude was 36.7%
A policy change met a production boom, and exports went from under 1% of US crude output to roughly three barrels in every ten. Then the line stopped rising. Whether that is a pause or a ceiling is the open question.
Continue reading below for the full detailed article →
Overview
Why This Count Covers Crude Oil Only
Ask how much oil the United States exports and two answers are defensible. EIA publishes one series for crude oil alone and another for crude plus petroleum products. This story uses the first. It measures what comes out of the ground, it matches the crude-only count in our companion story on US oil imports by country, and it carries the sharper change: 84-fold growth, against 3.6 times for the combined series, which rose from 1,089.8 to 3,936.4 million barrels. The combined figure is real and it appears below, because 3,936.4 million barrels in 2025 was a record and crude was 36.7% of it. Everything here is in million barrels per year to one decimal, taken from EIA's annual totals. At that scale 2011's 17.2 stays visible. In billions it would round to zero.
The Three Numbers That Define Crude Export Growth
Scale, share and timing carry this story: how many times larger exports are now, how much of US output they take, and how much of the gain came after the restrictions ended. None of them depends on 2025 being a record, because it was not.
84-Fold Growth in 14 Years
84x
US crude oil exports were 17.2 million barrels in 2011 and 1,445.9 million in 2025, a multiple of 84. In daily terms that was about 47 thousand barrels in 2011 and 3,961 thousand in 2025. The combined crude and products series grew only 3.6 times, because the US already exported fuels and gas liquids before the boom.
29.0% of US Crude Output Is Exported
29%
In 2011 exports were 0.8% of US crude field production, 17.2 of 2,071.1 million barrels. By 2025 they were 29.0% of 4,986.6, after peaking at 31.5% in 2023. Production grew 2.4 times while exports grew 84 times, which is why the export line rose so much faster than the output behind it and why the share is the better yardstick.
89% of the Gain Came After 2015
89%
Exports added 1,428.7 million barrels between 2011 and 2025, and roughly 1,276 million of that came after 2015, when they stood at 169.7 million. The restrictions were lifted that December. Timing is the evidence here, not proof of cause: US crude production rose 2.4 times across the same years, and both forces were at work.
US Crude Exports in 2025 by the Numbers
Share of US crude output exported 29 %1,445.9 of 4,986.6 million barrels produced in 2025.
Crude's share of all oil exports 36.7 %1,445.9 of 3,936.4 million barrels, crude plus products.
2025 as a share of the 2024 peak 96.5 %1,445.9 against 1,498.1 million barrels.
2011 to 2015: Before the Lift
Why Exports Were Small, Not Zero, Before 2016
Calling the early years a ban gets the data wrong. The US shipped 17.2 million barrels of crude abroad in 2011 and 169.7 million in 2015, nearly a tenfold rise before the restrictions came off. EIA reports that 92% of the 2015 total went to Canada, which was exempt from the rules, so they shaped where US crude could go far more than whether it could leave at all.
Even so, the volumes were small. In 2011 exports were 47 thousand barrels a day, 0.8% of US crude production, and in 2015 they were still only 4.9%. EIA dates the removal of the restrictions to December 2015 and gives the month but no day. That makes 2015 the last year recorded under the old rules and 2016, at 216.3 million barrels and up 27%, the first full year without them. The first step was modest. The surge came a year later.
2016 to 2019: The Surge
What Happened to Exports After the Restrictions Ended
Exports reached 422.5 million barrels in 2017, up 95%, then 747.5 million in 2018 and 1,088.3 million in 2019. The two largest annual gains in volume sit back to back: 325.0 million barrels from 2017 to 2018 and 340.8 million from 2018 to 2019. Between 2016 and 2019 the total rose more than fivefold, and by 2019 exports equaled 24.2% of US crude production.
Percentages from the early years mislead. The 162% jump in 2014 and the 98% jump in 2013 sound dramatic, but they amount to 79.2 and 24.3 million barrels, each less than the 206.2 million added in 2017 alone. Volume is the fairer measure when the starting base is 17 to 50 million barrels.
Timing alone does not show that lifting the restrictions caused the surge. US crude field production was expanding too, from 2,071.1 million barrels in 2011 to 4,986.6 million in 2025, 2.4 times as much, and exporters needed both permission and barrels. The data establishes the order of events, not the weight of each cause.
2020 to 2025: The Plateau
Why Crude Exports Slipped in 2025 After a 2024 Peak
Exports passed 1,000 million barrels for the first time in 2019 and reached 1,173.3 million in 2020. They dipped 8% to 1,081.4 million in 2021, rebounded 21% to 1,305.3 million in 2022, and climbed to 1,489.8 million in 2023 and a peak of 1,498.1 million in 2024, up just 1%. Then 2025 came in at 1,445.9 million, down 3.5% and 52.2 million barrels short of the high. In daily terms that is 3,961 thousand barrels against 4,093 thousand the year before.
EIA's review of 2025 says exports have generally risen with domestic production in recent years, but in 2025 more crude went into stock builds, particularly the Strategic Petroleum Reserve, and to domestic refineries. Destinations shifted too. Compared with 2024, exports fell 75% to Singapore and 89% to China, while India took about 90,000 barrels a day more and Japan about 80,000 more.
The three years from 2023 to 2025 sit within 52.2 million barrels of one another, so plateau describes the data better than peak or decline. The one earlier dip, in 2021, was reversed the next year, but a single precedent does not say what follows 2025. The series ends at the latest complete year, and nothing in it settles whether the climb resumes.
Scale: Exports Against Output
How Much of US Crude Production Is Now Exported?
The cleaner way to read 1,445.9 million barrels is against what the US pumps. Exports were 0.8% of crude field production in 2011 and 4.9% in 2015. The share reached 12.3% in 2017, 24.2% in 2019 and 28.2% in 2020, then peaked at 31.5% in 2023. In 2025 it was 29.0%, so a little under three of every ten barrels produced in the US left the country as crude.
Output set the stage. Production grew by 2,915.5 million barrels between 2011 and 2025, and exports grew by 1,428.7 million, about 49% of that increase. Crude imports also fell, from 3,261.4 million barrels to 2,251.4 million, a drop of 1,010.0 million equal to roughly 35% of the extra output. On that simple balance of production, imports and exports, the remaining 16% or so was a net addition to supply for US refiners and stocks.
Net Trade: Check the Basis
Is the US a Net Exporter of Oil? It Depends on the Basis
On crude oil alone the answer is no, and it has been no in every year of the series. The US bought 2,251.4 million barrels of crude in 2025 and sold 1,445.9 million, leaving net imports of 805.5 million. Exports equal 64% of imports. The gap has narrowed sharply, though: net crude imports were 3,244.3 million barrels in 2011, so the shortfall is now about a quarter of its size then.
Add refined fuels and gas liquids and the picture reverses. On the combined basis the US ran a deficit of 244.5 million barrels in 2019 and became a net exporter in 2020, at 232.4 million. In 2025 combined exports of 3,936.4 million barrels exceeded imports of 2,896.8 million by 1,039.6 million. Both statements are true, and a sentence about net exports that does not name its basis is wrong either way.
Why would a country that imports 2,251.4 million barrels of crude also export 1,445.9 million? EIA's answer is the refinery. US refineries are built to process heavier, more sour crude, which generally costs less, while much of the newer domestic output is lighter and sweeter. In the first half of 2022, EIA found, 69% of US crude imports were heavy grades, against 10% of production in the Lower 48 states.
EIA's broader series, crude oil plus petroleum products, reached 3,936.4 million barrels in 2025, about 10.8 million barrels a day and a record. It grew 3.6 times from 1,089.8 million in 2011, far less than crude's 84 times, because the US was already exporting fuels in 2011. Crude's share of the combined total rose from 1.6% in 2011 to a high of 39.9% in 2023 and stood at 36.7% in 2025.
The 2,490.5 million barrels that are not crude should not be called refined products. Hydrocarbon gas liquids, such as ethane, propane and butanes, account for 1,123.8 million of them, about 45%, slightly more than the 1,113.3 million of finished fuels like gasoline, distillate and jet fuel. The rest is unfinished oils at 149.2 million, other hydrocarbons and oxygenates at 69.9 million and gasoline blending components at 34.3 million.
The Full Series
US Crude Oil Exports by Year, 2011 to 2025
Year-by-year crude oil exports in million barrels and thousand barrels per day, set beside EIA's combined crude-and-products total and the share of US crude production that was exported.
Crude oil only unless a column says otherwise. Annual totals are million barrels per year, not daily rates. The change for 2011 is measured against 2010, which is not shown. Crude plus products includes finished fuels, hydrocarbon gas liquids and other non-crude barrels. Source: EIA annual series; production share uses EIA's field production of crude oil.
The Verdict
What 84-Fold Growth and a Flat Line Add Up To
The first half of the story is solid. A country that sold 17.2 million barrels of crude in 2011 sold 1,445.9 million in 2025, and most of that growth followed the December 2015 end of the restrictions, alongside a 2.4-fold rise in US output. By 2025 crude was 29.0% of what the country pumped and 36.7% of what it exported as oil.
The second half is unfinished. Three years near 1,500 million barrels, a 3.5% dip in 2025 and an EIA explanation that points to stockpiling and domestic refining make plateau the fair word, not peak and not record. Fifteen annual points cannot say whether this is a pause or a ceiling.
Anyone quoting these numbers should name the oil and the balance. Crude alone: 1,445.9 million barrels exported and net imports of 805.5 million. Crude plus products: 3,936.4 million barrels exported and net exports of 1,039.6 million. Both come from EIA, and both are true.
The data behind this story comes from the US Energy Information Administration's annual U.S. Exports of Crude Oil and Petroleum Products tables, covering crude oil alone (series MCREXUS1) and crude plus products (series MTTEXUS1), in thousand barrels converted to million barrels. EIA's matching annual import and field production series supply the net-trade and production-share figures. The data is a US government work in the public domain, and full credit for collecting and maintaining it goes to the EIA.
FactsFigs reviews, cleans, and cross-checks every source dataset before shaping it into a data story. Each visualization is created and designed in FactsFigs Design Studio, an internal tool developed and owned by FactsFigs, and is the original work of a FactsFigs author, not an AI-generated copy of any existing graphic. Individual assets within a visual may or may not be produced with AI tools, but the design of the visual itself is solely FactsFigs' own.
Figures are estimates at the time of publication, provided for information only, nothing here is financial advice or a guarantee of accuracy.
Last verified: 2 Oct 2026
The charts in this article were built with our own publishing system. See what it does →