TL;DR: Which Asian Cities Have the Best Quality of Life?
Singapore, 3rd of the world's 1,000 largest cities, leads a top 15 with no Chinese or Indian city and none of the ten megacities we tracked.
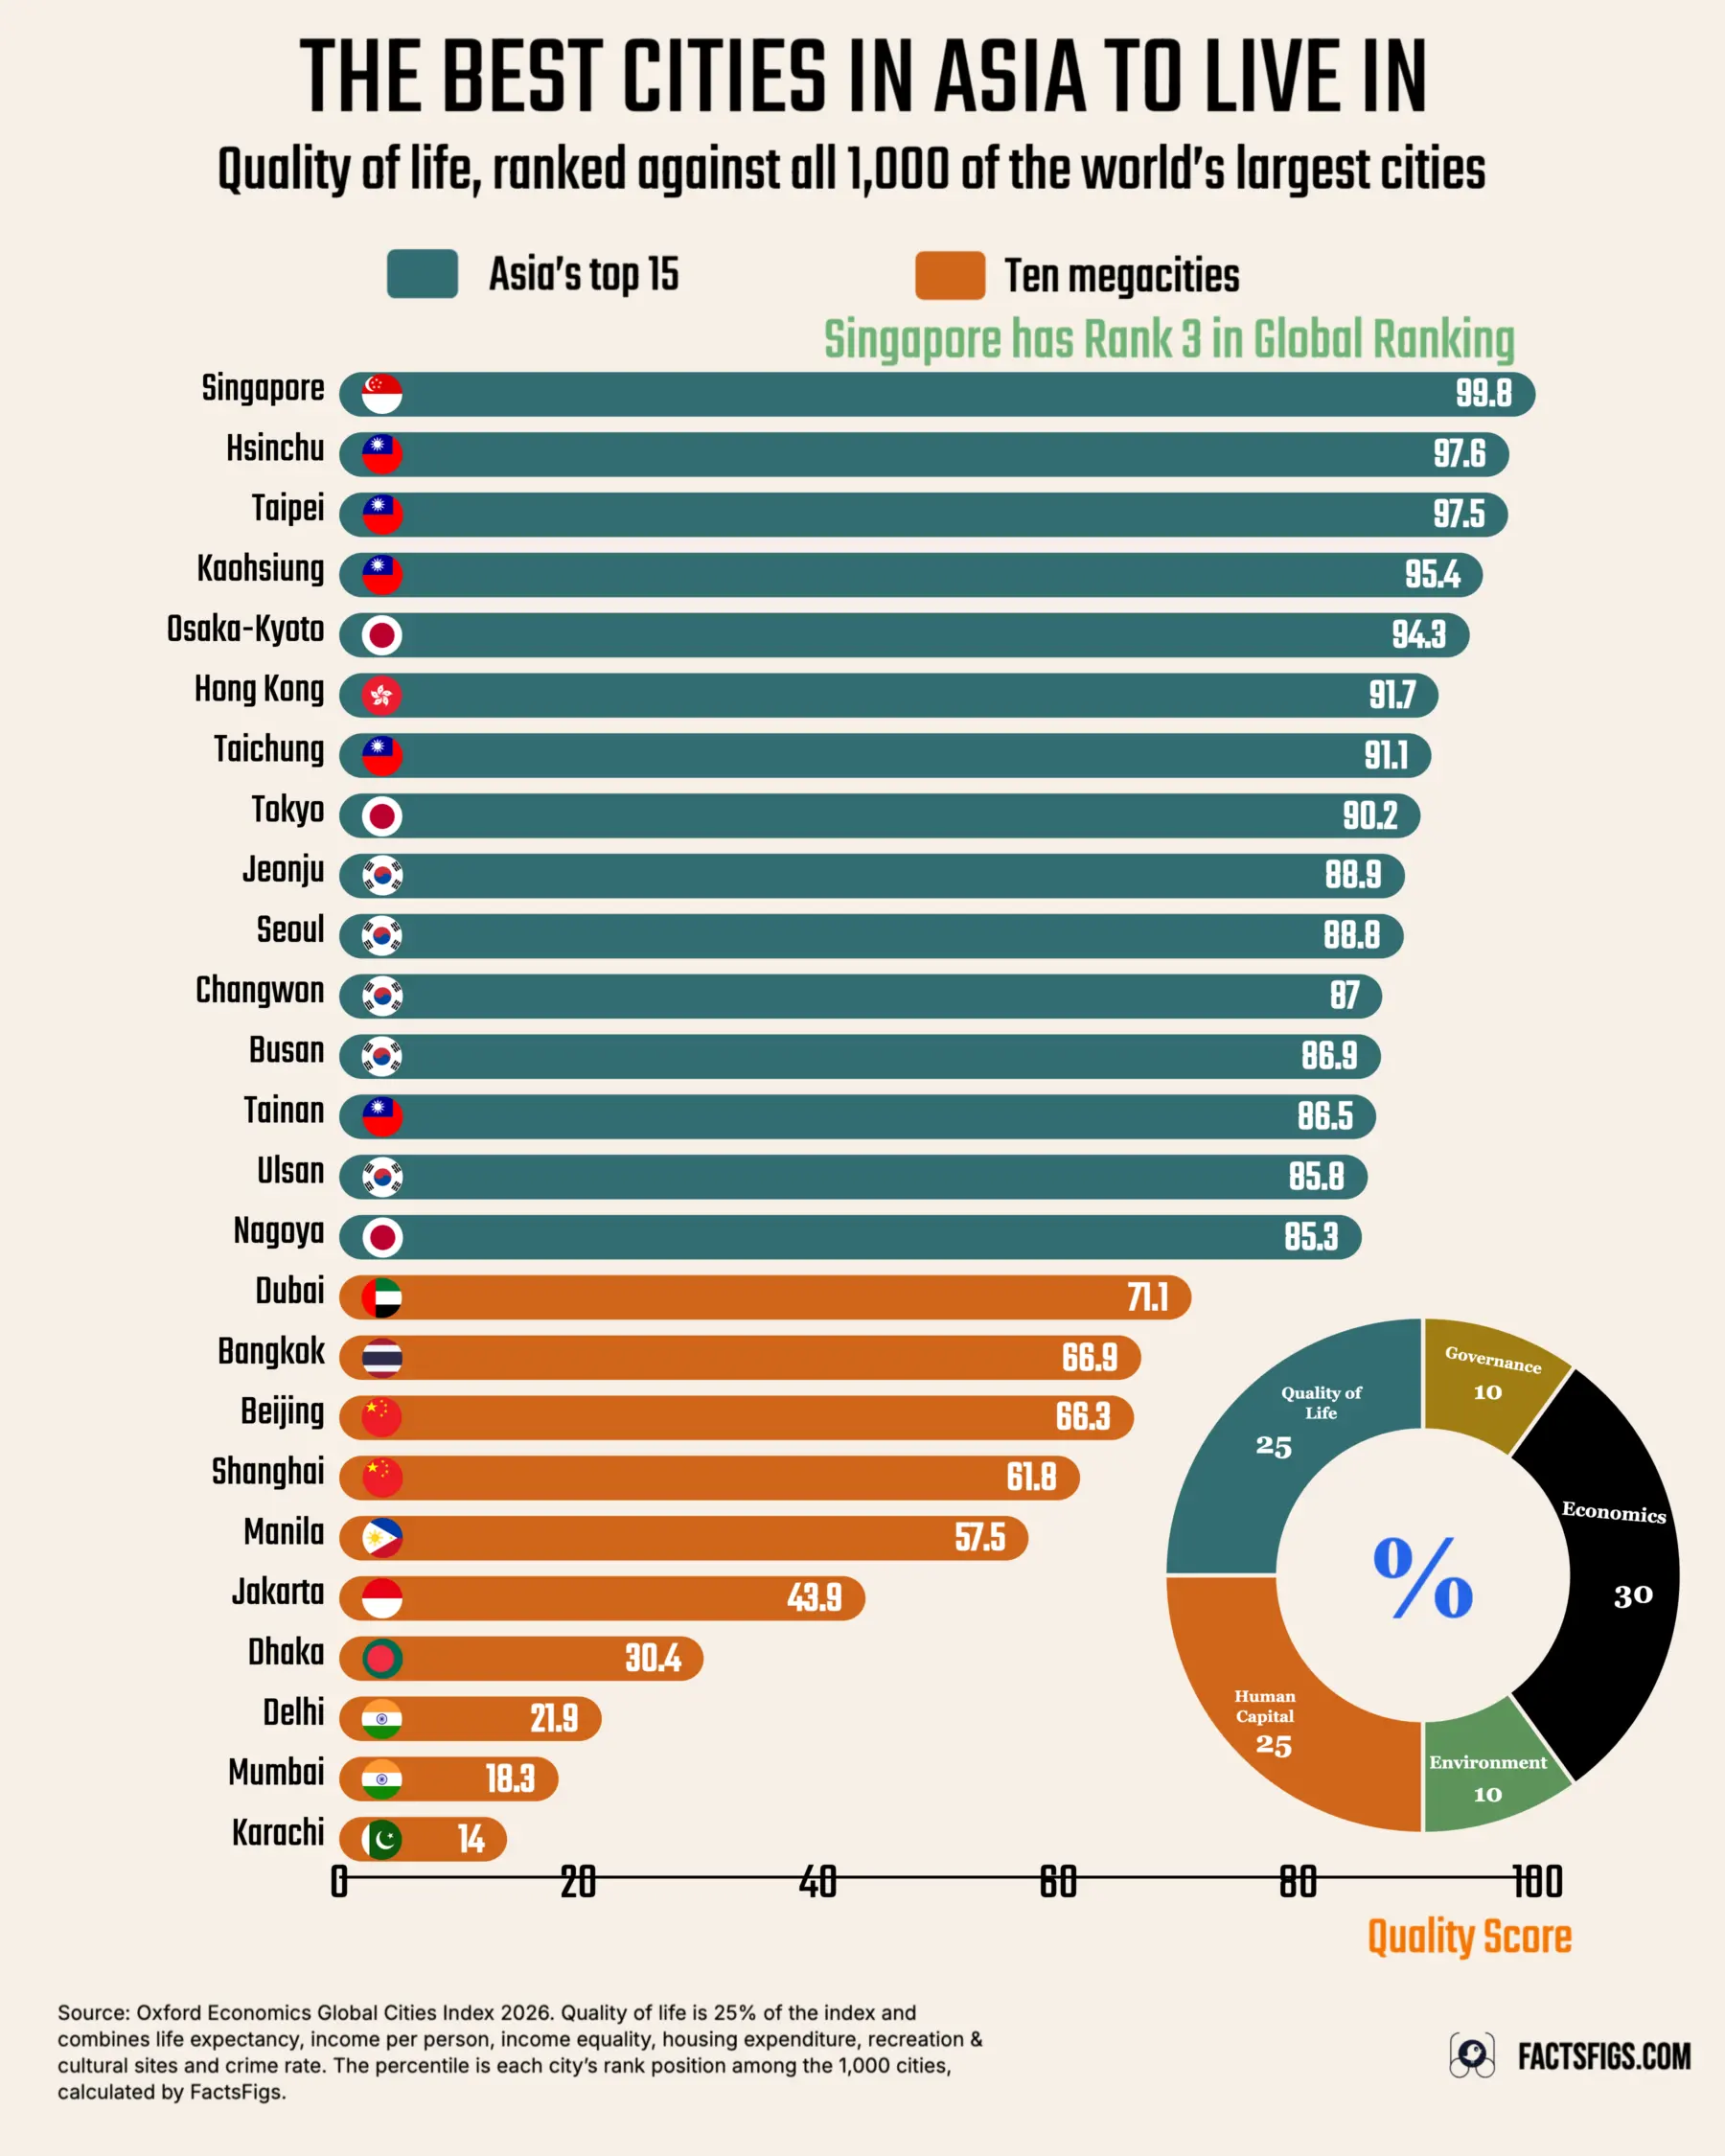
In Oxford Economics' 2026 Global Cities Index, Singapore ranks 3rd on earth for quality of life. The top 15 holds Singapore, five cities from Taiwan, five from South Korea, three from Japan and Hong Kong, ending with Nagoya at 148th.
Every city is ranked against all 1,000, so best in Asia is a world position. All ten megacities compared here, from Dubai at 290th to Karachi at 860th, rank below all 15.
! What the Rankings Reveal:
•
No Overlap Between the Groups:The top 15 sit at 85.3 to 99.8 on a FactsFigs rank-position scale, the ten megacities at 14.0 to 71.1.
•
The Best Are Alike, the Biggest Are Not:The top 15 span 14.5 points. The megacities span 57.1.
•
Capitals Come Second:Taipei, Seoul and Tokyo each rank behind another city in their own country.
? The Figures Behind the Ranking:
•
Singapore:3rd of 1,000 world cities
•
Lowest of the top 15:Nagoya, 148th
•
Highest megacity:Dubai, 290th
•
Lowest megacity:Karachi, 860th
This is a forecast-based rank, not a measurement, and it is the 2026 edition: crime rate replaced internet speed, so it cannot be set beside the 2024 list.
Continue reading below for the full detailed article →
Overview
Why Best in Asia Is Really a World Ranking
Oxford Economics ranks the world's 1,000 largest cities, and every Asian city below is placed among all 1,000, not among Asian peers. Singapore is third on earth, not third in Asia. The ranking is also a forecast: the index is built on Oxford Economics' own city forecasts rather than historic data alone. This is the 2026 edition, in which crime rate replaced internet speed as one of six Quality of Life measures, so it cannot be set beside 2024's list. The percentile used here is ours, a rank position calculated by FactsFigs and never an Oxford Economics score.
The Three Numbers That Define Asia's Quality of Life Ranking
Where Singapore stands on earth, how heavily Taiwan crowds the top 15, and how far apart the megacities fall.
Singapore Is 3rd of 1,000 World Cities
3rd of 1,000
Only Canberra, first, and Bergen, second, rank higher for quality of life than Singapore in the 2026 index. Oxford Economics points to its high life expectancy and very low crime rate, and crime rate is the measure that replaced internet speed this year. In the 2024 edition Singapore ranked 40th, so the two lists cannot be compared.
Taiwan Holds Five of Asia's Top 15
5 of 15
Hsinchu is 25th, Taipei 26th, Kaohsiung 47th, Taichung 90th and Tainan 136th among the world's 1,000 largest cities. South Korea also places five cities, Japan three, and Singapore and Hong Kong one each. Taiwan alone supplies a third of the field, and it is the only place with two cities inside the world's top 30.
Megacities Spread 57.1 Points, the Top 15 Only 14.5
57.1 points
Dubai leads the ten megacities at 71.1 and Karachi closes them at 14.0, a spread of 57.1 points on FactsFigs' rank-position scale. The top 15 run from Singapore at 99.8 to Nagoya at 85.3, only 14.5. Asia's best cities are much alike and its biggest are not, and even Karachi still outranks 140 of the 1,000.
Singapore by the Numbers
World rank, 2026 edition 3 of 1,000Behind Canberra and Bergen, ahead of every other city.
World rank, 2024 edition 40 of 1,000Scored with internet speed, not crime rate, so not comparable.
Next Asian city: Hsinchu 25 of 1,000Hsinchu, 25th, is 22 places behind Singapore.
Scope · What is being compared
Who Counts as Asian, and What Counts as a City
Oxford Economics has no Asia region. Its filters spread the continent across four regions, two of which also hold non-Asian countries, so the Asian set here is FactsFigs' own classification. Russia, Turkey and Egypt are left out as transcontinental, and so is Nicosia, which sits in West Asia but is politically European. It would otherwise have ranked 79th in the world, and Nagoya takes the 15th place instead.
A city is not a municipality either. Oxford Economics measures Functional Urban Areas, which combine a dense core with its commuting zone, so Osaka-Kyoto is one entry. Singapore and Hong Kong are whole territories, not cities inside a larger country, and here they compete head to head with places such as Nagoya.
The second group is ten large Asian cities that FactsFigs labels megacities: Dubai, Bangkok, Beijing, Shanghai, Manila, Jakarta, Dhaka, Delhi, Mumbai and Karachi. It is a chosen set, not a census.
Singapore · The anomaly at the top
#1 Singapore: 3rd in the World, Behind Canberra and Bergen
Singapore ranks 3rd of 1,000, a rank position of 99.8 on the FactsFigs scale. Canberra is first and Bergen second, so Singapore is the highest-placed city in Asia by 22 places, ahead of Hsinchu at 25th. Oxford Economics' own 2026 commentary singles out its high life expectancy and very low crime rate.
Crime rate is new this edition. In 2024, scored with internet speed, Singapore ranked 40th. Hong Kong, 84th and 6th in Asia here, is the other whole territory in the field, which makes the pair the broadest units in a list otherwise made of urban areas.
Taiwan · Five cities in the top 15
Why Taiwan Fills Five of Asia's Top 15 Places
Taiwan places Hsinchu 25th, Taipei 26th, Kaohsiung 47th, Taichung 90th and Tainan 136th. It is the only place with two cities in the world's top 30, and all five sit inside the top 136, so the strength is broad across the island rather than concentrated in the capital.
The index cannot say which measure does the work. Oxford Economics publishes no measure-level figures for these cities, so a rank of 25th cannot be traced to life expectancy, incomes, equality, housing costs, amenities or crime. The category rewards all six at once, and five Taiwanese cities score well on that combination.
Pattern · Capitals versus the rest
In Taiwan, Korea and Japan the Capital Is Not the Best City
Taipei, Seoul and Tokyo are each their country's capital, and each ranks behind another city in its own country: Taipei 26th behind Hsinchu 25th, Seoul 113th behind Jeonju 112th, Tokyo 99th behind Osaka-Kyoto 58th. In Korea the gap is a single place, and it repeats, with Changwon 131st and Busan 132nd.
Japan's gap is the widest: Tokyo trails Osaka-Kyoto by 41 places, and Nagoya, 148th, is a further 49 behind Tokyo.
Quality of Life is not a size contest. Oxford Economics noted in 2024 that its top cities in this category tend to be smaller than the leaders in Economics or Human Capital, and two of the six measures are divided by population.
Korea and Taiwan · Cities few readers know
Hsinchu, Jeonju, Changwon and Ulsan Beat Every Megacity Here
Four cities most readers outside East Asia could not place on a map outrank all ten megacities. Hsinchu is 25th, Jeonju 112th, Changwon 131st and Ulsan 143rd, against 290th for Dubai, the best of the megacities, and 338th for Beijing.
Hsinchu, with about 476,000 residents, is home to Hsinchu Science Park, where TSMC, MediaTek and UMC are headquartered. Ulsan, at about 1.1 million, hosts Hyundai Motor's assembly plant and Hyundai Heavy Industries' shipyard, each described as the world's largest of its kind.
Changwon, at about one million, was Korea's first planned city, modelled on Canberra, the city that tops the 2026 ranking, and its industrial complex employs about 82,000 people. Jeonju, at about 638,000, is known for a hanok village of more than 800 traditional buildings. These are city-limit populations, not the wider Functional Urban Areas the index ranks.
China and India · The missing giants
China and India Hold 250 Cities, but None in Asia's Top 50
On the full 2024 table, 159 of the 1,000 cities are Chinese and 91 Indian, 250 places between them. In the 2026 ranking, FactsFigs' reading of the full table finds none of those 250 inside Asia's top 50.
The headline names land well down the table: Beijing 338th, six places behind Bangkok, and Shanghai 383rd. Delhi is 781st and Mumbai 817th, outranking only about 220 and 180 of the world's 1,000 cities. Karachi, 860th, is lower still. The 25 rows say nothing about the other 240 or so Chinese and Indian cities.
Megacities · A 57-point spread
Why Megacities Spread Four Times Wider Than the Top 15
Dubai leads the ten megacities at 71.1, 290th in the world, followed by Bangkok at 66.9 (332nd), Beijing at 66.3 (338th), Shanghai at 61.8 (383rd) and Manila at 57.5 (426th). Jakarta falls to 43.9 (561st), and the four South Asian megacities all sit below 31: Dhaka 30.4 (696th), Delhi 21.9 (781st), Mumbai 18.3 (817th) and Karachi 14.0 (860th).
That is a spread of 57.1 points where the top 15 span 14.5, a ratio of 3.9 to 1. In world ranks the top 15 cover 145 places, from 3rd to 148th, while the megacities cover 570, from 290th to 860th. Asia's best cities are much alike, and its biggest are wildly unequal.
The two groups do not mix: Dubai, the best megacity, is still 142 places below Nagoya, the weakest of the top 15.
Empty corridor between Nagoya (85.3) and Dubai (71.1) on the FactsFigs rank-position scale
14.2 points, with no city from either group in it. It is empty of these 25 cities, not of Asia: any other Asian city ranked in between is outside this data.
Method · The index behind the ranking
How Quality of Life Becomes a Quarter of the Index
Oxford Economics' index combines five categories: Economics at 30%, Human Capital at 25%, Quality of Life at 25%, Environment at 10% and Governance at 10%. It rests on 27 indicators across 163 countries. Each indicator is normalised so the best-scoring city gets 100 and the lowest 0, and the category totals are normalised again before the weights are applied.
Governance is the odd one out. It is scored at national level, so every Japanese city shares one governance score, and 10% of any city's overall rank is not about the city at all. It plays no part in the Quality of Life ranking, which is built from six measures only.
Quality of Life covers residents' financial and health outcomes and their access to amenities, in Oxford Economics' words. The six measures follow.
Quality of Life · Measures 1 and 2
Two Measures of Living Well: Life Expectancy and Income
Life expectancy · Years at birth
Life expectancy is the life expectancy at birth for residents of the city. It is a result, not a budget: it records how long people live, not how much is spent on keeping them alive. Oxford Economics' 2026 commentary cites Singapore's high life expectancy among its strengths.
Income per person · Adjusted for prices
Income per person is the total disposable income of a city's households divided by its population, adjusted for purchasing power parity across countries. As an average it says nothing about who holds the money, which is the next measure's job.
Quality of Life · Measures 3 and 4
Two Measures of Fairness: Income Equality and Housing
Income equality · The Gini coefficient
Income equality is the Gini coefficient for total household income in the city, a standard measure of how evenly income is spread. A city with a high average income and a wide gap between its richest and poorest households can do well on income per person and badly here.
Housing expenditure · Share of income
Housing expenditure is the share of household disposable income spent on housing and utilities in the city. It is a burden measure, not a price tag: costly homes can still score decently where incomes are high. In a separate 2026 value-for-money comparison Oxford Economics stripped it from the category "to prevent double counting", a sign that it works as a cost.
Quality of Life · Measures 5 and 6
Two Measures of Daily Life: Cultural Sites and Crime
Recreation & cultural sites · Per resident
Recreation and cultural sites is the number of such sites in the city divided by its population, so it measures density, not size. Oxford Economics said Grenoble topped the 2024 category on its multitude of sites per person. The public pages do not say what qualifies as a site.
Crime rate · The 2026 newcomer
Crime rate is the measure that changed. It replaced internet speed in the 2026 edition, and Oxford Economics' public pages list it without a definition, data source or unit, so how crime is counted cannot be checked from outside. Its 2026 commentary does cite Singapore's very low crime rate.
Editions · 2026 against 2024
Why the 2026 and 2024 Rankings Cannot Be Compared
The 2024 edition scored internet speed, the average broadband download speed in the city, as its sixth measure. The 2026 edition scores crime rate instead. The swap moved cities a long way: Singapore went from 40th to 3rd, a rise of 37 places, while Hamamatsu fell from 52nd to 179th, a drop of 127.
Crime rate is the documented change, not necessarily the only one, since the index rests on forecasts that are revised between editions. A list that can move a city by more than a hundred places is a snapshot to cite with its year, not a verdict.
Method · What the percentile means
Why These Cities Come With a Rank, Not a Score
Oxford Economics publishes Quality of Life scores only for the global top 10, which in 2026 includes Singapore, and shows everything else as a rank, such as "#179, top 20%". For 24 of the 25 cities here a rank is all there is.
The percentile in this story is therefore ours: a rank position calculated by FactsFigs as (1,000 minus rank) divided by 999, so 1st would be 100 and 1,000th 0. Singapore, 3rd, is 99.8 and Karachi, 860th, is 14.0. It says how many world cities a city outranks, not how good life there is, and it is not an Oxford Economics score, Singapore's included.
Oxford Economics Global Cities Index 2026 · Quality of Life rank
All 25 Asian Cities Ranked by World Quality of Life Position
World rank is the city's Quality of Life position among 1,000 world cities, as Oxford Economics publishes it. Rank position is calculated by FactsFigs as (1,000 minus rank) divided by 999 and is not an Oxford Economics score.
Top 15
1
Singapore
🇸🇬 Singapore
3
99.8
Top 15
2
Hsinchu
🇹🇼 Taiwan
25
97.6
Top 15
3
Taipei
🇹🇼 Taiwan
26
97.5
Top 15
4
Kaohsiung
🇹🇼 Taiwan
47
95.4
Top 15
5
Osaka-Kyoto
🇯🇵 Japan
58
94.3
Top 15
6
Hong Kong
Hong Kong SAR
84
91.7
Top 15
7
Taichung
🇹🇼 Taiwan
90
91.1
Top 15
8
Tokyo
🇯🇵 Japan
99
90.2
Top 15
9
Jeonju
🇰🇷 South Korea
112
88.9
Top 15
10
Seoul
🇰🇷 South Korea
113
88.8
Top 15
11
Changwon
🇰🇷 South Korea
131
87.0
Top 15
12
Busan
🇰🇷 South Korea
132
86.9
Top 15
13
Tainan
🇹🇼 Taiwan
136
86.5
Top 15
14
Ulsan
🇰🇷 South Korea
143
85.8
Top 15
15
Nagoya
🇯🇵 Japan
148
85.3
Megacity
1
Dubai
🇦🇪 United Arab Emirates
290
71.1
Megacity
2
Bangkok
🇹🇭 Thailand
332
66.9
Megacity
3
Beijing
🇨🇳 China
338
66.3
Megacity
4
Shanghai
🇨🇳 China
383
61.8
Megacity
5
Manila
🇵🇭 Philippines
426
57.5
Showing 1-20 of 25
Page 1 of 2
Figures cited from the Oxford Economics Global Cities Index 2026, read on 29 October 2026. Oxford Economics retains all rights to the index, so FactsFigs cites these 25 rows and does not republish the wider list. Asia is classified by FactsFigs.
The limits of the comparison
What This Ranking Cannot Tell You
It is a forecast, not a measurement. Oxford Economics builds the index on its own city forecasts rather than historic data alone, so a position reflects expected direction as well as current standing. The differences within Asia's top 15 are small slices of a 1,000-city field.
Six measures leave a lot out. Nothing in them records commute times, school quality or the cost of a flat; education sits in the Human Capital category and climate in Environment.
Last, the megacity group is a selection, so the 57.1-point spread describes those ten, not every large Asian city.
The data behind this story comes from the Oxford Economics Global Cities Index 2026, read from its published interactive index on 29 October 2026 by ranking cities on Quality of Life and filtering by region. The index is an all-rights-reserved Oxford Economics product, so it is cited here and not republished: FactsFigs shows only the 25 city ranks used in this story, and full credit for collecting and maintaining the index goes to Oxford Economics. The rank-position column is calculated by FactsFigs.
FactsFigs reviews, cleans, and cross-checks every source dataset before shaping it into a data story. Each visualization is created and designed in FactsFigs Design Studio, an internal tool developed and owned by FactsFigs, and is the original work of a FactsFigs author, not an AI-generated copy of any existing graphic. Individual assets within a visual may or may not be produced with AI tools, but the design of the visual itself is solely FactsFigs' own.
Figures are estimates at the time of publication, provided for information only. Nothing here is financial advice or a guarantee of accuracy.
Last verified: 29 Oct 2026
The charts in this article were built with our own publishing system. See what it does →