In 2022, by 243,647 people. April 2023 is the date the UN announced the crossover, not the date it happened.
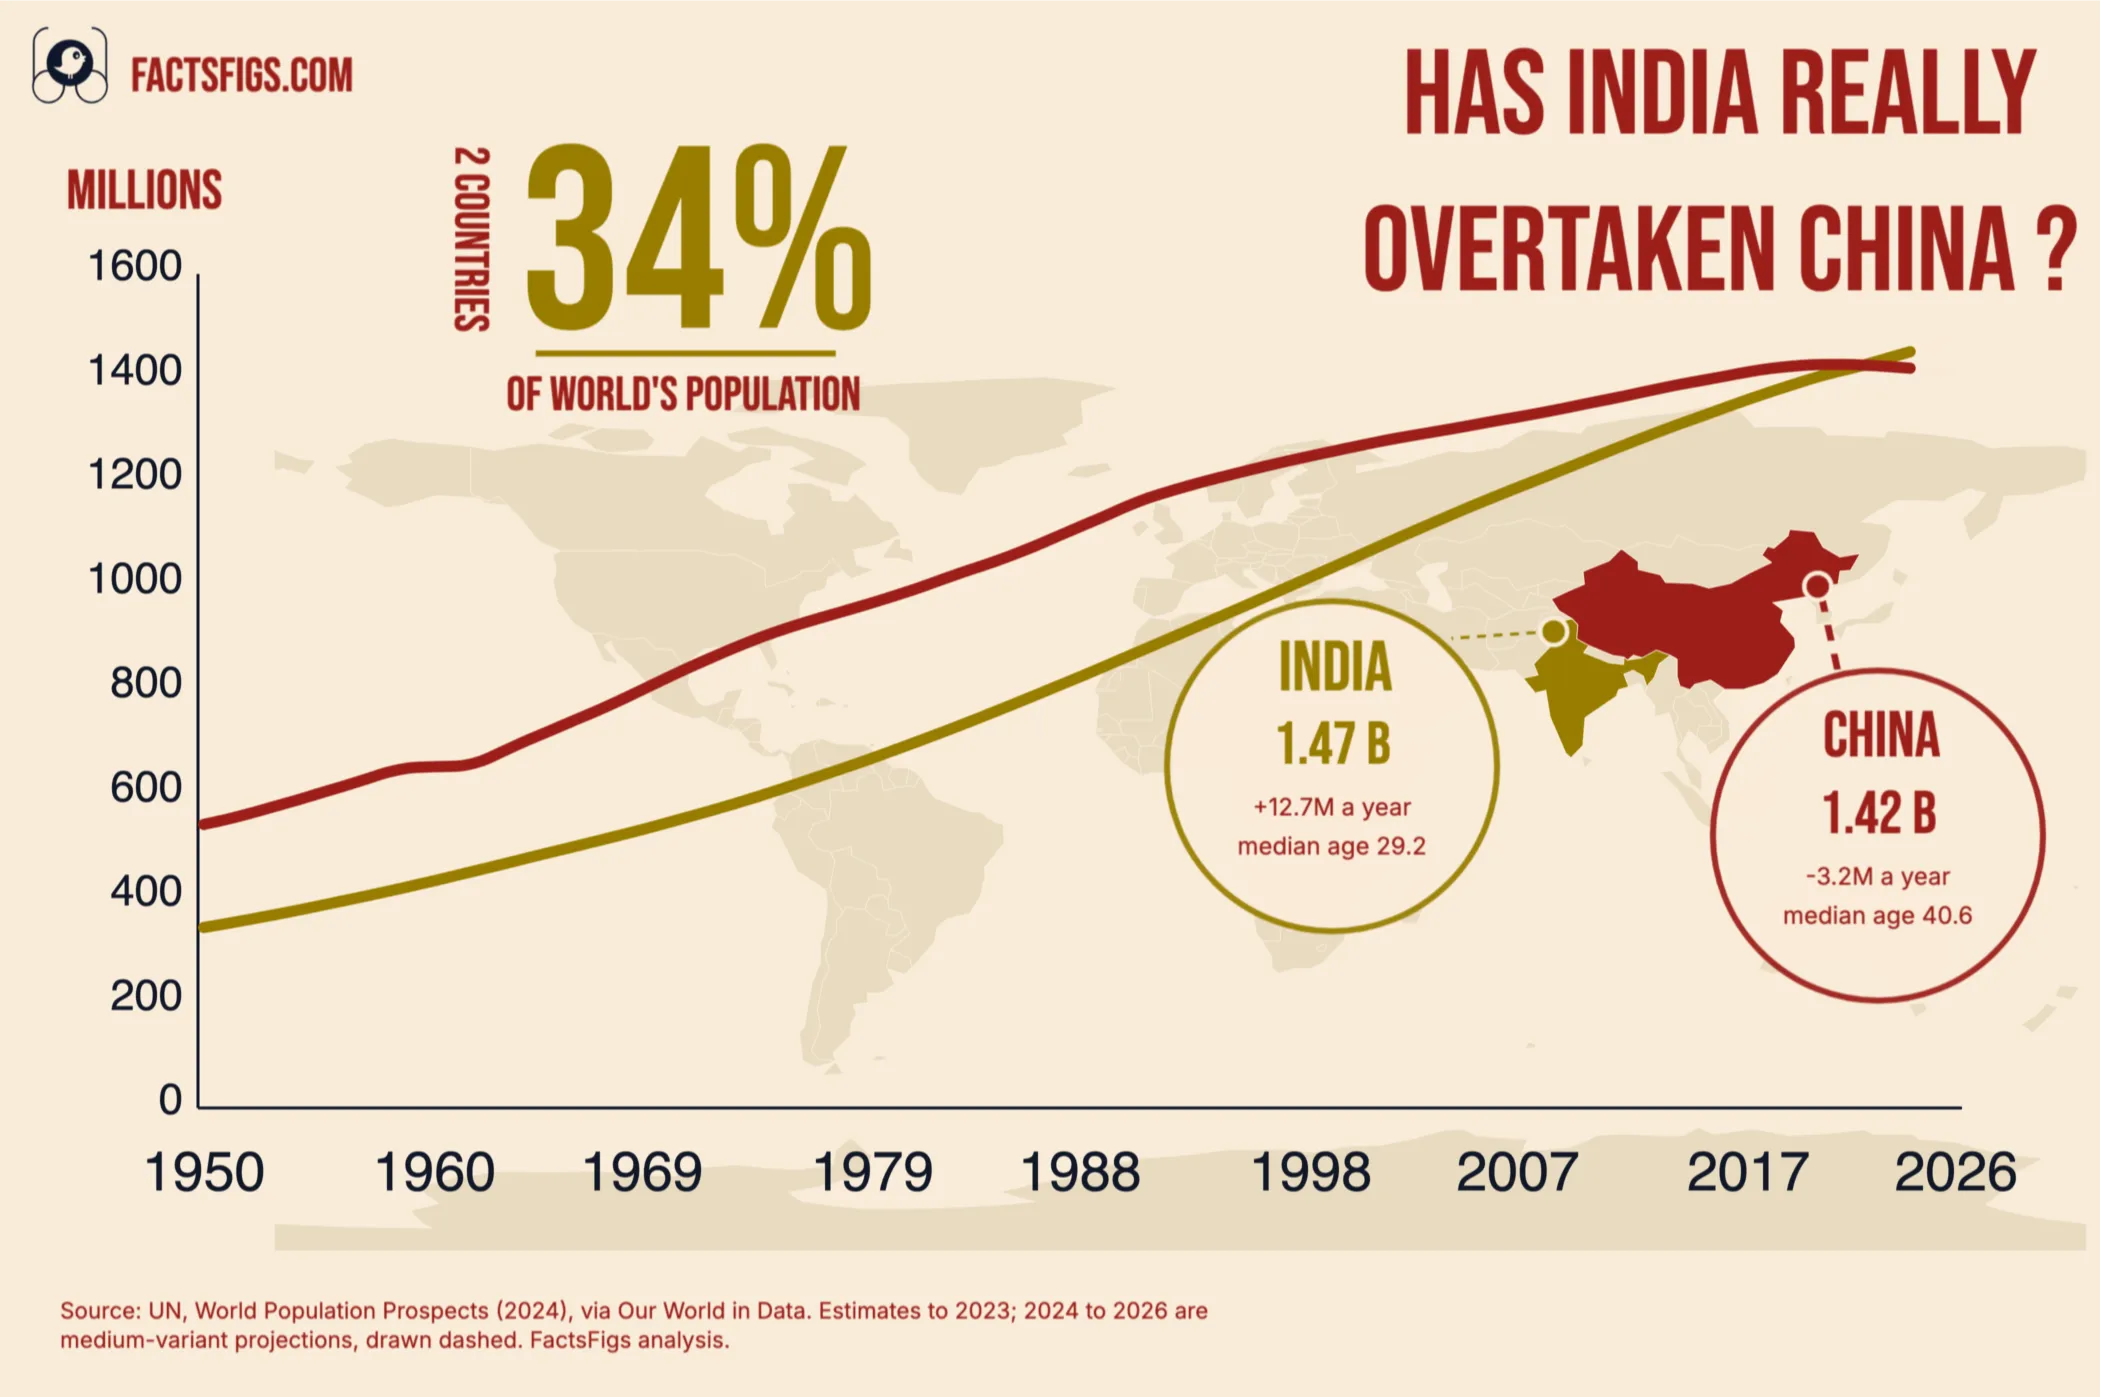
On the UN's 2024 revision India reached 1,425,423,209 people in mid-2022 against China's 1,425,179,562, a margin of 243,647, or 0.017% of either country. China had ranked first in every year of the UN record since 1950, 72 years running.
Neither figure is a count. India's last completed census was in 2011 and the next enumeration is due in February 2027, so India's side of that margin is a projection carried eleven years past its last headcount. The director of the UN Population Division said at the time that the precise timing will never be known.
! What the Two Lines Actually Show:
•
The Lead Peaked in 1975, Not 1980:China was 304.8 million ahead in 1975, and had already started closing by 1976.
•
The Convergence Doubled Speed:4.8 million a year closed from 1980 to 2002, then 9.5 million a year to 2022.
•
China Peaked Before It Was Overtaken:1,426.4 million in 2021, then four straight falls to about 1.405 billion.
? The Figures Behind the Crossover:
•
Crossover:2022, by 243,647 people
•
Widest gap:304.8 million in China's favour, 1975
•
India in 2026:1,476.6 million, 63.7 million ahead
•
India's last census:2011, with the next count due February 2027
The ranking is the least interesting part. India's median age is 29.2 against China's 40.6, and that eleven-year gap decides far more than the order of two totals.
Continue reading below for the full detailed article →
Overview
Why Both Sides of This Comparison Are Estimates
Every figure on the chart comes from the UN's 2024 World Population Prospects, which carries measured estimates to 2023 and medium-variant projections after that. The estimates are not headcounts either: the UN assembles them from censuses, sample registration and migration data, and in 2022 it was doing that for two countries whose censuses were both out of date, India's from 2011 and China's from 2020. That is tolerable when the question is whether a country has a billion people. It is another matter when the answer turns on 243,647 of them.
The Three Numbers That Decide This Story
How close the crossover was, how wide the lead had been before it closed, and how old India's base figure was when the two lines met.
A Margin of 243,647 People in 2022
243,647 people
India reached 1,425,423,209 people in mid-2022 against China's 1,425,179,562. The difference is 0.017% of either total, about one person in six thousand. Shifting either country's fertility or migration assumptions by a fraction of a percent would move the crossing a year in either direction, which is why the UN has never defended the date.
China's Lead Peaked at 304.8 Million in 1975
304.8m
China had 916.1 million people in 1975 to India's 611.3 million, the widest the two have ever stood apart. The gap barely moved over the following decade, down to 287.2 million by 1985, and then fell away: 189.3 million by 2002, and only 12.2 million by 2021.
India's Census Base Was 11 Years Old
11 years
India counted itself in 2011 and has not done so since. The 2021 census was postponed for COVID-19 and never held, so India's figure for 2022 is a cohort-component projection carried eleven years past its last headcount. By the enumeration due in February 2027 that base will be sixteen years old.
India by the Numbers
Working-age share, 2026 68.6 %1,013 million Indians are aged 15 to 64, against 112 million over 65.
Share of world population, 2026 17.8 %China holds 17.0%, so a third of humanity lives in the two.
Female labour force participation 32.4 %World Bank modelled ILO estimate; India's own survey reports 41.7%.
The shape of the convergence
How a 304.8 Million Lead Vanished, and Why It Sped Up
China's lead grew for a quarter of a century and peaked in 1975, 916.1 million people against India's 611.3 million. It shrank slowly at first: between 1980 and 2002 the gap closed by 106.5 million, about 4.8 million a year, a pace that would have run out somewhere in the 2040s.
It did not take that long. The remaining 190 million closed between 2002 and 2022 at roughly 9.5 million a year, nearly twice as much ground in two fewer years. That acceleration is why the crossover happened when it did, and it came from both ends at once: India's huge cohorts of the 1980s and 1990s reaching childbearing age while China's births fell away.
China · Why the line bent
China's Fertility Halved Before the One-Child Policy
The policy everyone remembers arrived after the fall it is credited with. China's total fertility rate dropped by more than half during the 1970s, under the wan xi shao campaign that told couples to marry later, space births further apart and have fewer of them. The one-child policy followed in 1979-80, at the end of that decline rather than the start of it. How much of the drop the campaign caused, and how much came from rising incomes and schooling, is still genuinely argued over.
China · What the relaxations changed
Three Children Allowed, and Births Fell to 7.92 Million
The limit rose to two children from 2016 and to three on 31 May 2021. Neither move worked. China recorded 7.92 million births in 2025, the fewest since records began in 1949 and about 17% below 2024's 9.54 million, against 11.31 million deaths. The population fell 3.39 million to roughly 1.405 billion, a fourth consecutive decline and the steepest on record outside the famine of 1959-61.
That is what a settled age structure does. China peaked at 1,426.4 million in 2021, and the decline now running does not wait on anyone's decision about having a child: too few women are of childbearing age, and too many people are old enough to die.
India · Below replacement, still growing
Below Replacement and Still Adding 12.7 Million a Year
India's total fertility rate was 1.9 in the Sample Registration System report for 2024, below the 2.1 that holds a population level, and the national figure hides a spread from 2.9 in Bihar to 1.2 in Delhi, with only six states still above replacement. India still added 12.7 million people between 2025 and 2026, growing at 0.87% a year while China shrinks at 0.22%.
The two facts are not in conflict. Population momentum is the growth already locked into an age structure, the US Census Bureau's term for the change inherent in how a population is distributed by age. India has 1,013 million people aged 15 to 64 and only 112 million aged 65 and over. Even at 1.9 children each, that many adults near childbearing age produce more births than so small an elderly population produces deaths. The arithmetic flips only when those cohorts themselves grow old, which the UN medium variant puts in the early 2060s, at a peak near 1,701 million.
Data quality · India
Nobody Has Counted India Since 2011
India's last completed census was in 2011. The 2021 round was prepared, then postponed for COVID-19, and never held. A Gazette of India notification of 16 June 2025, issued under the Census Act 1948, sets the reference moment for the next one at midnight on 1 March 2027, with 1 October 2026 for Ladakh and the snow-bound districts of Jammu and Kashmir, Himachal Pradesh and Uttarakhand.
The first phase, the houselisting and housing census, was scheduled to have concluded between 1 April and 30 September 2026. Population enumeration follows in February 2027.
That is what the 243,647-person margin rests on: not a count but a cohort-component projection, rolled eleven years past the last headcount and updated with sample registration. John Wilmoth, director of the UN Population Division, said when the crossover was announced that the precise timing is not known and will never be known.
The announcement makes the point by itself. UN DESA dated the crossover to April 2023; in the same month UNFPA put India ahead at mid-2023. Two arms of one organisation, two dates for one event, and Wilmoth called the mismatch unfortunate. The date that has circulated ever since is the date of a press release.
Years between India's last completed census and its next population enumeration
16, from 2011 to February 2027
Data quality · China
The Dispute Over China's Count Runs Both Ways
Yi Fuxian, a researcher at the University of Wisconsin-Madison whose appointment is in obstetrics and gynecology rather than demography, argues that China has overstated its population for decades. The claimed error moves between retellings, from more than 100 million in one interview to about 140 million where he puts the real 2020 figure near 1.27 billion against a census count of 1.412 billion.
His evidence is indirect: 17.7 million births recorded for 2000 against only 14.2 million lower-secondary graduates in 2015 despite compulsory schooling, and about 5.8 million BCG vaccine vials distributed a year in 2018-2020 where reported births should need nine to thirteen million.
Named demographers reject it. Feng Wang of UC Irvine says not a single person has discovered a discrepancy on that scale, and that three censuses since 2000 show no sign of one. Patrick Gerland, who heads the UN's population estimates section, says the UN does not take Chinese statistics at face value. No published paper has replicated or refuted the method, which is itself informative: the argument has run in newspapers, including the Wall Street Journal in October 2026, and not in the literature.
The documented failure runs the other way. China's own 2021 statistical yearbook put births for 2000 to 2010 at 172.5 million against the 160.9 million the 2010 census found in that age group, a shortfall of 11.6 million children, roughly 57% of them girls, hidden by parents until school registration while birth-planning penalties applied. Daniel Goodkind estimated in Demography that about 19% of children under five went unreported in 2000. The known bias is undercounting, and it has been corrected upwards more than once.
What the crossover actually marks
The Age Structure Changed Hands Too, in 2024
India passed China on working-age adults in 2024, 990.0 million to 984.0 million, two years after the totals crossed. China's working-age population had peaked at 1,000.0 million back in 2015, six years before its total population did.
The distance shows in the profiles. India's median age in 2026 is 29.2 years against China's 40.6, and India carries 11.1 people aged 65 and over for every hundred of working age where China carries 21.6. On the UN's medium scenario China's working-age population falls to 745.3 million by 2050, 255 million below its peak, with 52.2 elderly per hundred workers and 30.9% of the country over 65; India would have 1,134.1 million working-age people and 21.7 elderly per hundred. That divergence is what the crossover marks.
India and China at the Years the Story Turns, 1950-2026
Population in millions on the UN's 2024 revision, with the gap given as India minus China. A negative gap means China is larger.
1950
346.3
544.0
-197.8
Estimate
1960
436.0
654.8
-218.8
Estimate
1970
545.9
823.3
-277.4
Estimate
1975
611.3
916.1
-304.8
Estimate
1980
687.4
983.2
-295.8
Estimate
1990
865.0
1,153.6
-288.6
Estimate
2000
1,057.9
1,269.6
-211.7
Estimate
2002
1,097.6
1,286.9
-189.3
Estimate
2010
1,243.5
1,351.6
-108.1
Estimate
2015
1,328.0
1,396.1
-68.1
Estimate
2020
1,402.6
1,426.1
-23.5
Estimate
2021
1,414.2
1,426.4
-12.2
Estimate
2022
1,425.4
1,425.2
+0.2
Estimate
2023
1,438.1
1,422.6
+15.5
Estimate
2024
1,450.9
1,419.3
+31.6
Projection
2025
1,463.9
1,416.1
+47.8
Projection
2026
1,476.6
1,412.9
+63.7
Projection
The charts carry all 77 annual values; this table shows the years the story turns on, including 1975, where the annual series peaks and a decade-sampled table would not. No download is offered, because we could not confirm from the UN Population Division's own terms that redistributing the series is permitted.
What the ranking does not buy
Most Populous Is Not the Same as Most Powerful
Finishing first on head count moved none of the things head count stands in for. GDP per person in 2025 was $13,862 in China against $2,702 in India, a factor of 5.1, and China produced 27.4% of global manufacturing value added to India's 3.0% on World Bank figures. Participation is the harder constraint: 59.2% of Chinese women aged 15 and over are in the labour force, against 32.4% of Indian women on the World Bank's modelled ILO estimate or 41.7% on India's own Periodic Labour Force Survey. India needs 7.85 million non-farm jobs a year to 2030, by its government's own reckoning, simply to absorb the people already born.
The limits of the comparison
What These Two Lines Cannot Settle
The dashed years are not measurements. Everything from 2024 is the UN's medium variant, one scenario among the several it publishes, and it is already drifting from China's own accounting: the UN has China at 1,416.1 million at mid-2025 while the National Bureau of Statistics reported about 1,405 million at the end of that year. Some of those eleven million is definitional, a mid-year estimate set against a year-end count, but not all of it.
Other models disagree more deeply. A Lancet analysis has India peaking near 1.6 billion in 2048 and falling to about 1.09 billion by 2100, where the UN has 1.70 billion in the early 2060s and 1.51 billion in 2100, roughly 400 million apart at the century's end. The crossover date is revisable too: it belongs to the 2024 revision, the UN revises about every two years, and the next one could move 2022 by a year in either direction.
The data behind this story comes from UN, World Population Prospects (2024), with major processing by Our World in Data, and full credit for collecting and maintaining it goes to the United Nations Department of Economic and Social Affairs, Population Division. FactsFigs filtered the India and China slice for 1950-2026 out of the full series itself rather than using the chart as published, and derived the gap, the growth rates and the age-structure figures from it. Where sources disagree we name both and choose one: China's end-2025 total is the National Bureau of Statistics figure, India's fertility rate is the Sample Registration System for 2024, and the manufacturing shares are the World Bank's rather than UNIDO's, which put the pair at 32.0% and 3.3% for 2024.
FactsFigs reviews, cleans, and cross-checks every source dataset before shaping it into a data story. Each visualization is created and designed in FactsFigs Design Studio, an internal tool developed and owned by FactsFigs, and is the original work of a FactsFigs author, not an AI-generated copy of any existing graphic. Individual assets within a visual may or may not be produced with AI tools, but the design of the visual itself is solely FactsFigs' own.
Figures are estimates at the time of publication, provided for information only. Nothing here is financial advice or a guarantee of accuracy.
Last verified: 28 Oct 2026
The charts in this article were built with our own publishing system. See what it does →