TL;DR: Which Renewable Makes the Cheapest Electricity?
Onshore wind, at $33 per megawatt-hour, because it turns 1.46 times solar's capital into 2.2 times solar's annual output.
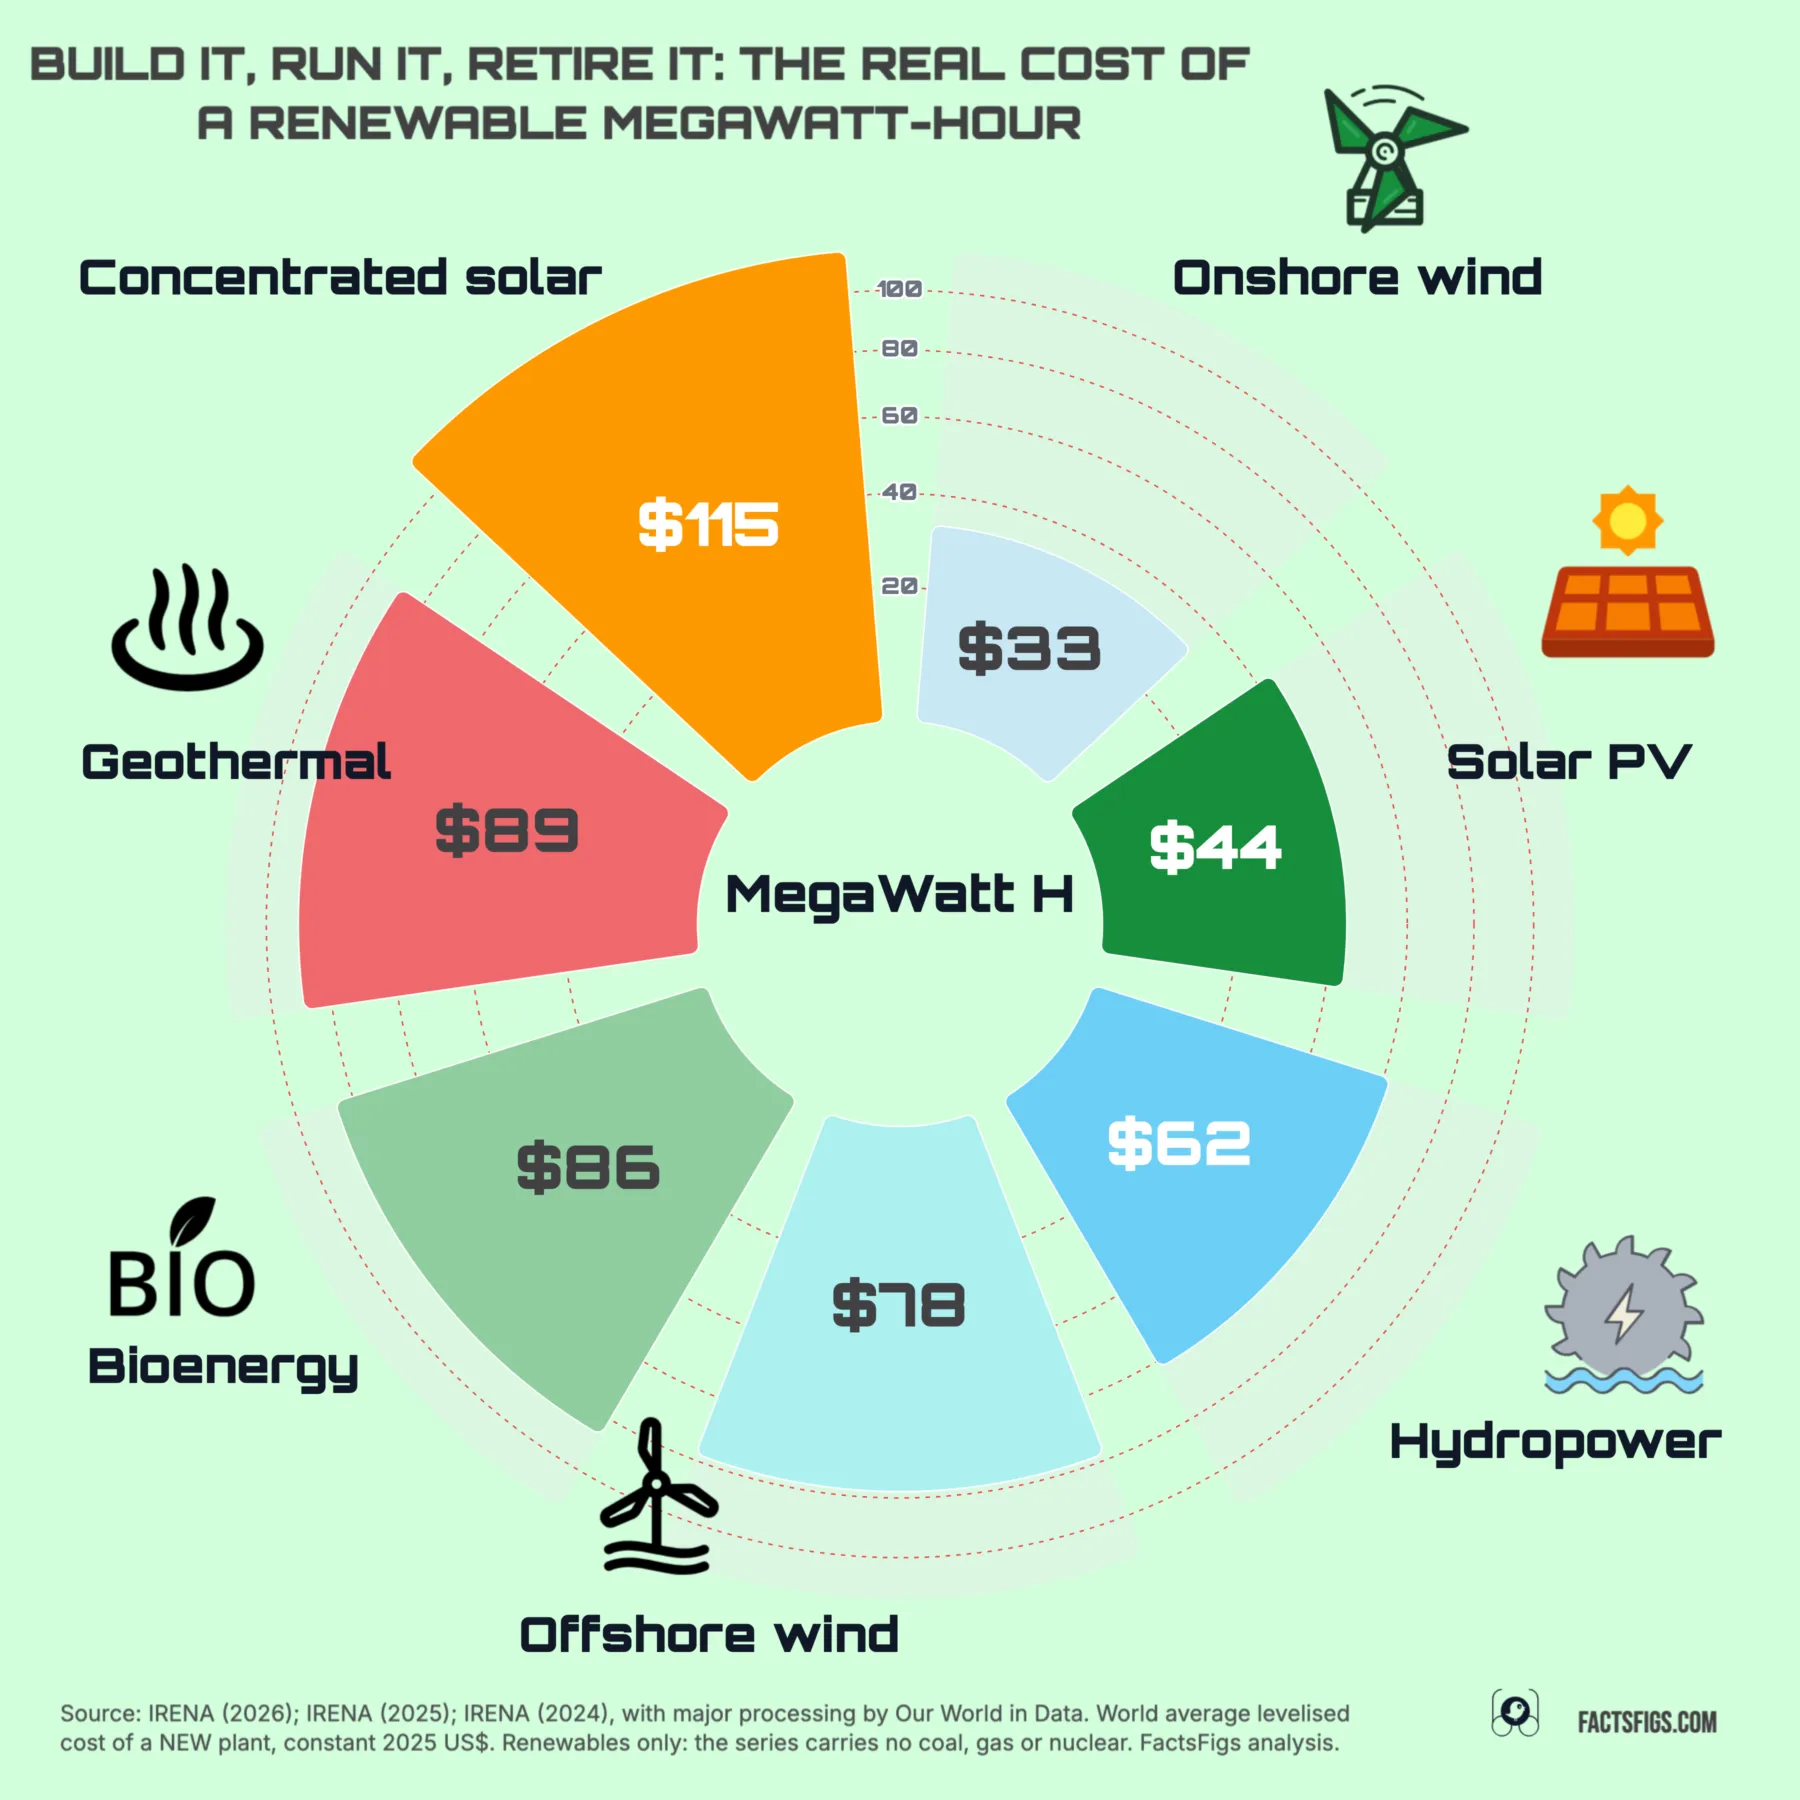
On IRENA's 2025 figures a new onshore wind farm produces electricity at $33 per megawatt-hour, ahead of utility-scale solar PV at $44, hydropower at $62, offshore wind at $78, bioenergy at $86, geothermal at $89 and concentrated solar at $115. These are world averages for plants commissioned in 2025, in constant 2025 dollars, and the series prices renewables only: no coal, gas or nuclear line sits in it.
Wind does not win on the price of a turbine. A kilowatt costs $976 to build against solar's $667, 46% more, then runs at a 36% capacity factor against solar's 16.5%: 2.2 times the output for 1.46 times the capital.
! What the 2025 Ranking Shows:
•
The Cheapest Is Not the One That Fell Fastest:Solar PV fell 89% since 2010 and still finishes second, on a capacity factor less than half of wind's.
•
Two Sources Are Dearer Than in 2010:Hydropower is up 41% and geothermal up 53%; bioenergy has barely moved in fifteen years.
•
The Field Has Converged:Dearest to cheapest was 9.4 times in 2010. In 2025 it is 3.5 times.
? The Figures Behind the Ranking:
•
Cheapest:Onshore wind, $33/MWh, down 71% since 2010
•
Dearest:Concentrated solar, $115/MWh, down 72% since 2010
•
Biggest fall:Solar PV, down 89%, and still second
•
Biggest rise:Geothermal, up 53%, all inside one year
These are plant-gate costs for new build, before transmission, taxes and the cost of keeping supply firm. They settle nothing about coal, gas or nuclear.
Continue reading below for the full detailed article →
Overview
What This Ranking Counts, and What It Leaves Out
Levelised cost of electricity is what a plant must earn across its working life to cover building, financing, fuelling and running it, divided by the electricity it should produce. IRENA publishes it for seven renewable technologies and nothing else, so there is no coal, gas or nuclear figure here to measure them against. Every number is a world average for utility-scale plants commissioned in 2025, in constant 2025 dollars, which makes this a ranking of what is cheapest to build now, not of the electricity already in the wires.
The Three Numbers That Settle the 2025 Ranking
What a kilowatt of wind returns against a kilowatt of solar, how far the seven technologies have converged since 2010, and the 273 megawatts behind geothermal's jump carry this story.
Onshore Wind Delivers at $33 per MWh
$33/MWh
A wind farm commissioned in 2025 undercuts utility-scale solar by a quarter and concentrated solar by 71%. It costs 46% more per kilowatt to build than solar, $976 against $667, and wins anyway because each kilowatt returns about 3,154 kilowatt-hours a year against solar's 1,445. The denominator decides the ranking.
The Field Narrowed From 9.4x to 3.5x
3.5x
In 2010 the dearest renewable cost 9.4 times the cheapest, $412 per megawatt-hour for concentrated solar against $44 for hydropower. In 2025 the distance from concentrated solar at $115 to onshore wind at $33 is 3.5 times. Choosing between renewable technologies is no longer choosing between wildly different prices.
Geothermal's Jump Rests on 273 MW
273 MW
Geothermal's 53% rise is the arithmetic of the few plants that happened to finish in 2025: 273 megawatts worldwide, a fifth less than 2024, with 105 MW in Indonesia and 106 MW in the Philippines. Their weighted installed cost came to $5,997 per kilowatt, 46% above the previous cohort.
Onshore Wind by the Numbers
Capacity factor 36 %36% in 2025, nine points above 2010.
Cost fall since 2010 71 %$114 per megawatt-hour in 2010, $33 in 2025.
Share of 2025 wind built on land 93 %About 159 GW of wind went up, 93% of it onshore.
Worked Example · Solar PV
How $667 of Panel Becomes $44 of Electricity
Forty-four dollars a megawatt-hour looks too cheap until you follow a single kilowatt of solar from the mounting rail to the meter. Installing it costs $667. A 16.5% capacity factor turns the 8,760 hours in a year into 1,445 kilowatt-hours, and IRENA amortises solar over 25 years, so that kilowatt produces roughly 36,100 kilowatt-hours before the accounting stops. Spread the hardware across all of it and the panel itself costs $18.50 per megawatt-hour.
Capital is not free, though. At a 7.5% real discount rate the $667 has to come back as $59.83 a year, which over 1,445 kilowatt-hours is $41.40. Add about $2 of operations and maintenance and the total is $43.50, the published $44. The panel is therefore $18.50 of solar's $44, and financing more than doubles it. That is the same mechanism as the country-by-country spread below, arriving from the opposite direction. The divisor is not the same for every source either: IRENA amortises hydropower over 30 years and bioenergy over 20, so the seven lifetimes being compared are not identical.
Rank 1 · Wind
#1 Onshore Wind: $33/MWh on 46% More Capital
The usual explanation, that turbines are cheaper than panels, is wrong. A kilowatt of onshore wind cost $976 to build in 2025 against $667 for utility-scale solar, 46% more. It wins on what that kilowatt then does: a 36% capacity factor returns about 3,154 kilowatt-hours a year against solar's 1,445, so wind commits $0.31 of capital per annual kilowatt-hour where solar commits $0.46. Wind also improved on both axes while solar improved on one, lifting its capacity factor nine points since 2010 as rotors grew.
Rank 2 · Solar
#2 Solar PV: $44/MWh and the Year the Fall Stopped
Solar is by far the cheapest thing here to build, $667 per kilowatt, under a third of hydropower's and a ninth of geothermal's. Its handicap is that the sun is off most of the time, and a 16.5% capacity factor is the lowest of the seven bar concentrated solar. 2025 is the year a fifteen-year collapse paused: installed costs fell about 6% and the levelised cost did not move, because dearer capital and a lower capacity factor cancelled the hardware saving. A record 511 GW went up regardless, 315 GW of it Chinese.
#3 Hydropower: $62/MWh, and Concrete Has No Learning Curve
Hydropower was the cheapest source on earth in 2010 at $44 per megawatt-hour and led every year through 2019. It now costs $62, up 41%, the only large source to travel that far the wrong way. Most of that is construction: the 2025 installed cost of $2,079 per kilowatt is 36% above 2010 in real terms, and civil works, meaning dams, tunnels and powerhouses, run to between half and seven tenths of a project. Concrete poured into a gorge has no factory behind it and no learning curve.
The rest is one year of weather. The capacity factor of newly commissioned plants fell from 48% to 43% in 2025, after peaking at 53% in 2023, and a metric that divides by output punishes a dry cohort. Additions actually rose 150% to 18.4 GW, and 2025 was hydropower's cheapest build year since 2018. What ran out is the easy sites, not the engineering.
Rank 4 · Wind
#4 Offshore Wind: Three Times the Capital for Five Points
Offshore wind costs $2,931 per kilowatt, three times onshore, and returns a 41% capacity factor against onshore's 36%. Five percentage points of output do not pay for three times the capital, and $78 per megawatt-hour follows from it.
The world average also hides a split that has become two industries. Offshore wind costs $49 per megawatt-hour in China and $141 in the United States, and the global figure has held flat for five years only because Chinese declines offset European and North American increases.
Rank 5 · Bioenergy
#5 Bioenergy: $86/MWh and the Only Fuel Bill Here
Bioenergy is the one technology here that buys fuel every year, and that is the whole story of its flat line. Run the same capital-only arithmetic that reconstructed solar's $44 and bioenergy comes out at $52 against a published $86, which puts roughly two fifths of its cost outside capital altogether: feedstock, handling and operation.
A manufacturing boom that cut module prices by 89% cannot reach that share, so bioenergy's cost has moved 3% in fifteen years. The feedstock is what moves it: rice husk projects average $68 per megawatt-hour against $91 for wood waste. Its small 2025 fall came from output rather than cheaper plant, as its capacity factor reached 78%.
Geothermal capacity commissioned worldwide during 2025
273 MW, from two countries
Rank 6 · Geothermal
#6 Geothermal: 85% Uptime, Sixth Place, One Thin Year
Geothermal's 53% rise since 2010 and its 53% rise over the past twelve months are the same rise. It cost $57.8 per megawatt-hour in 2010 and $57.8 in 2024, then $88.7 in 2025. Nothing drifted; one year moved. The cause is the composition of a very small sample: only 273 MW was commissioned worldwide in 2025, a fifth below 2024, with 105 MW in Indonesia and 106 MW in the Philippines, against a 2024 cohort that was mostly 225 MW in New Zealand.
This is not a story about producing less. Geothermal runs at an 85% capacity factor, the highest of the seven, and finishes sixth anyway because $5,997 per kilowatt is nine times what solar costs to build. It is also the most finance-sensitive source here, with the cost of capital at 45% of its levelised cost against 33% for the plant itself.
Concentrated solar hit a record-low installed cost in 2025, $2,418 per kilowatt, cheaper to build than offshore wind, and its levelised cost still rose 9% to $115. The reason is entirely the denominator: its capacity factor fell to 22% because Chinese developers are deliberately building smaller mirror fields per megawatt of turbine, so the plants work as flexible parts of hybrid wind and solar projects rather than as round-the-clock generators.
Every megawatt commissioned anywhere in 2025 was Chinese, 900 MW across nine projects. Chinese rules treat it as the add-on that lets a wind and solar project meet capacity and storage obligations without a central subsidy, so last place is partly a choice about what the plant is for.
The Denominator
Why a Kilowatt of Wind Beats a Kilowatt of Solar
Sort the seven by capital committed per kilowatt-hour of annual output instead of by cost and the ranking's logic surfaces. Onshore wind commits $0.31, solar PV $0.46, bioenergy $0.53, hydropower $0.55, geothermal $0.81, offshore wind $0.82 and concentrated solar $1.26. The middle reshuffles: bioenergy and geothermal look better on capital per unit of output than on levelised cost, and everything between the two views is fuel, maintenance and the cost of money.
Capacity factor also changes what the ranking means physically. Covering one American household's 10,380 kilowatt-hours a year takes roughly 3.3 kilowatts of onshore wind, 7.2 kilowatts of solar or 1.4 kilowatts of geothermal.
Where It Is Built
Why the Same Turbine Costs Four Different Prices
Onshore wind costs $27 per megawatt-hour in China, $40 in the United States, $52 in Germany and $109 in Japan, and solar runs from $35 in India to $107 in Poland. Almost none of that spread is equipment, which trades as a global commodity at one price. IRENA attributes about 56% of the variation in financing costs to country-level macroeconomic conditions against 24% to the technology.
The real cost of capital for a standardised, fully contracted project runs from about 3% in deep markets such as the United States and Australia to above 10% in the highest-risk economies, and that move alone raises solar's cost by about 92% on the FactsFigs arithmetic set out above. So the contract is the cheapest lever a government holds: a merchant project carries roughly double the weighted cost of capital of a contracted one, and analysis quoted by IRENA finds long-term contracts can cut levelised cost by 30% to 40% through financing alone. For emerging economies IRENA says it flatly, that the cost of capital rather than the cost of technology is the binding constraint.
Deployment and Savings
Who Is Building This, and Who Banks the Savings
The world average is substantially a measurement of Chinese construction. Take China out and onshore wind rises from $33 to $51, solar from $44 to $55 and hydropower from $62 to $70. China put up 315 GW of the 511 GW of solar built in 2025 and about 120 GW of the 159 GW of wind, so a developer anywhere else should read the headline figures as a floor rather than a quote. Volumes are uneven between the seven too: hydropower added 18.4 GW, bioenergy 3.4 GW, concentrated solar 900 MW and geothermal 273 MW.
The savings land unevenly as well. IRENA estimates renewables displaced about $480 billion of fossil fuel purchases worldwide in 2025 along with 8.4 gigatonnes of carbon dioxide, $177 billion of it in China. For Indonesia, Thailand and the Philippines the existing fleet displaced $5.7 billion of coal and gas, a saving that rises exactly when a fuel importer can least afford a price spike and needs no new investment, because the plant is already standing.
Levelised cost is the world average for plants commissioned in 2025, in constant 2025 US dollars. Installed cost and capacity factor are IRENA's weighted averages for the same cohort.
1
Onshore wind
33
976
36%
25 yr
-71%
-3.9%
2
Solar PV
44
667
16.5%
25 yr
-89%
+1.3%
3
Hydropower
62
2,079
43%
30 yr
+41%
+9.2%
4
Offshore wind
78
2,931
41%
25 yr
-63%
-3.5%
5
Bioenergy
86
3,606
78%
20 yr
-3%
-1.5%
6
Geothermal
89
5,997
85%
25 yr
+53%
+53.5%
7
Concentrated solar
115
2,418
22%
25 yr
-72%
+8.6%
Concentrated solar and geothermal are weighted averages of very small commissioning cohorts, 900 MW and 273 MW respectively, so their year-on-year moves should be read with caution. No data file is offered for download, because the underlying cost series is IRENA's rather than ours to redistribute.
The Limits of the Number
What This Ranking Does Not Price In
The first limit is the field itself. IRENA costs renewables and nothing else, so nothing above settles anything about coal, gas or nuclear. IRENA does offer a comparator in prose: a turbine shortage driven partly by data-centre demand roughly doubled the capital cost of a new combined-cycle gas plant in the United States, to about $2,400 per kilowatt, pushing gas toward $100 per megawatt-hour in Italy, Germany and Japan while it held at $50 to $60 where gas is cheap. More than 90% of utility-scale renewables commissioned in 2025 came in below the cheapest new fossil alternative in their market, the second year running.
A Fossil Comparison Needs Another Source · Lazard v19.0
For an unsubsidised like-for-like against fossil and nuclear plant, Lazard's LCOE+ v19.0 of July 2026 is the citable set, and it is a separate source, a separate method and a separate geography that should not be merged into the figures above. Its unsubsidised United States ranges put combined-cycle gas at $51 to $129 and nuclear at $175 to $255 against utility solar at $40 to $98. Lazard sits above IRENA largely because it assumes 60% debt at 8% and 40% equity at 12%.
It Is Not Your Bill · 3.3 to 11.5 Cents
These seven figures are 3.3 to 11.5 US cents per kilowatt-hour at the plant gate. The average American household paid 16.5 cents a kilowatt-hour in 2024 on about 865 kilowatt-hours a month, and the distance between the two covers transmission, distribution, taxes, retail margin and the existing fleet. IRENA also excludes subsidies, system balancing, carbon pricing and air-pollution costs, and calls these data points prices rather than costs.
Two caveats close it. Variable output has to be covered, and the cover is priced: Lazard's firming charge adds roughly $8 to $30 per megawatt-hour to wind and solar. And seven is not the whole set: hydropower's 30-year basis is deliberately conservative against plants that run 30 to 80 years, and IRENA separately tracks wave and tidal stream energy, left out of the ranking because they are pre-commercial.
The Verdict
So What Is Cheapest to Build Right Now?
Onshore wind, at $33 per megawatt-hour, and it wins on output rather than on price. Solar fell furthest, by 89% in fifteen years, and still finishes second because its capacity factor is less than half of wind's. The two sources that now cost more than they did in 2010 got there separately: hydropower through concrete that cannot be mass-produced and a dry commissioning year, geothermal through 273 megawatts of drilling in two countries.
The data behind this story comes from IRENA (2026); IRENA (2025); IRENA (2024), with major processing by Our World in Data, and full credit for collecting and maintaining it goes to IRENA. FactsFigs filtered the World 2025 slice out of the full series itself rather than using the chart as published. The installed costs, capacity factors, economic lives and country figures quoted in the text were read from IRENA's Renewable power generation costs in 2025, its executive summary and its annex on 28 October 2026. The United States comparison figures are Lazard's LCOE+ v19.0 of July 2026, a separate source and method, and the retail price comparison is from the US Energy Information Administration.
FactsFigs reviews, cleans, and cross-checks every source dataset before shaping it into a data story. Each visualization is created and designed in FactsFigs Design Studio, an internal tool developed and owned by FactsFigs, and is the original work of a FactsFigs author, not an AI-generated copy of any existing graphic. Individual assets within a visual may or may not be produced with AI tools, but the design of the visual itself is solely FactsFigs' own.
Figures are estimates at the time of publication, provided for information only. Nothing here is financial advice or a guarantee of accuracy.
Last verified: 28 Oct 2026
The charts in this article were built with our own publishing system. See what it does →