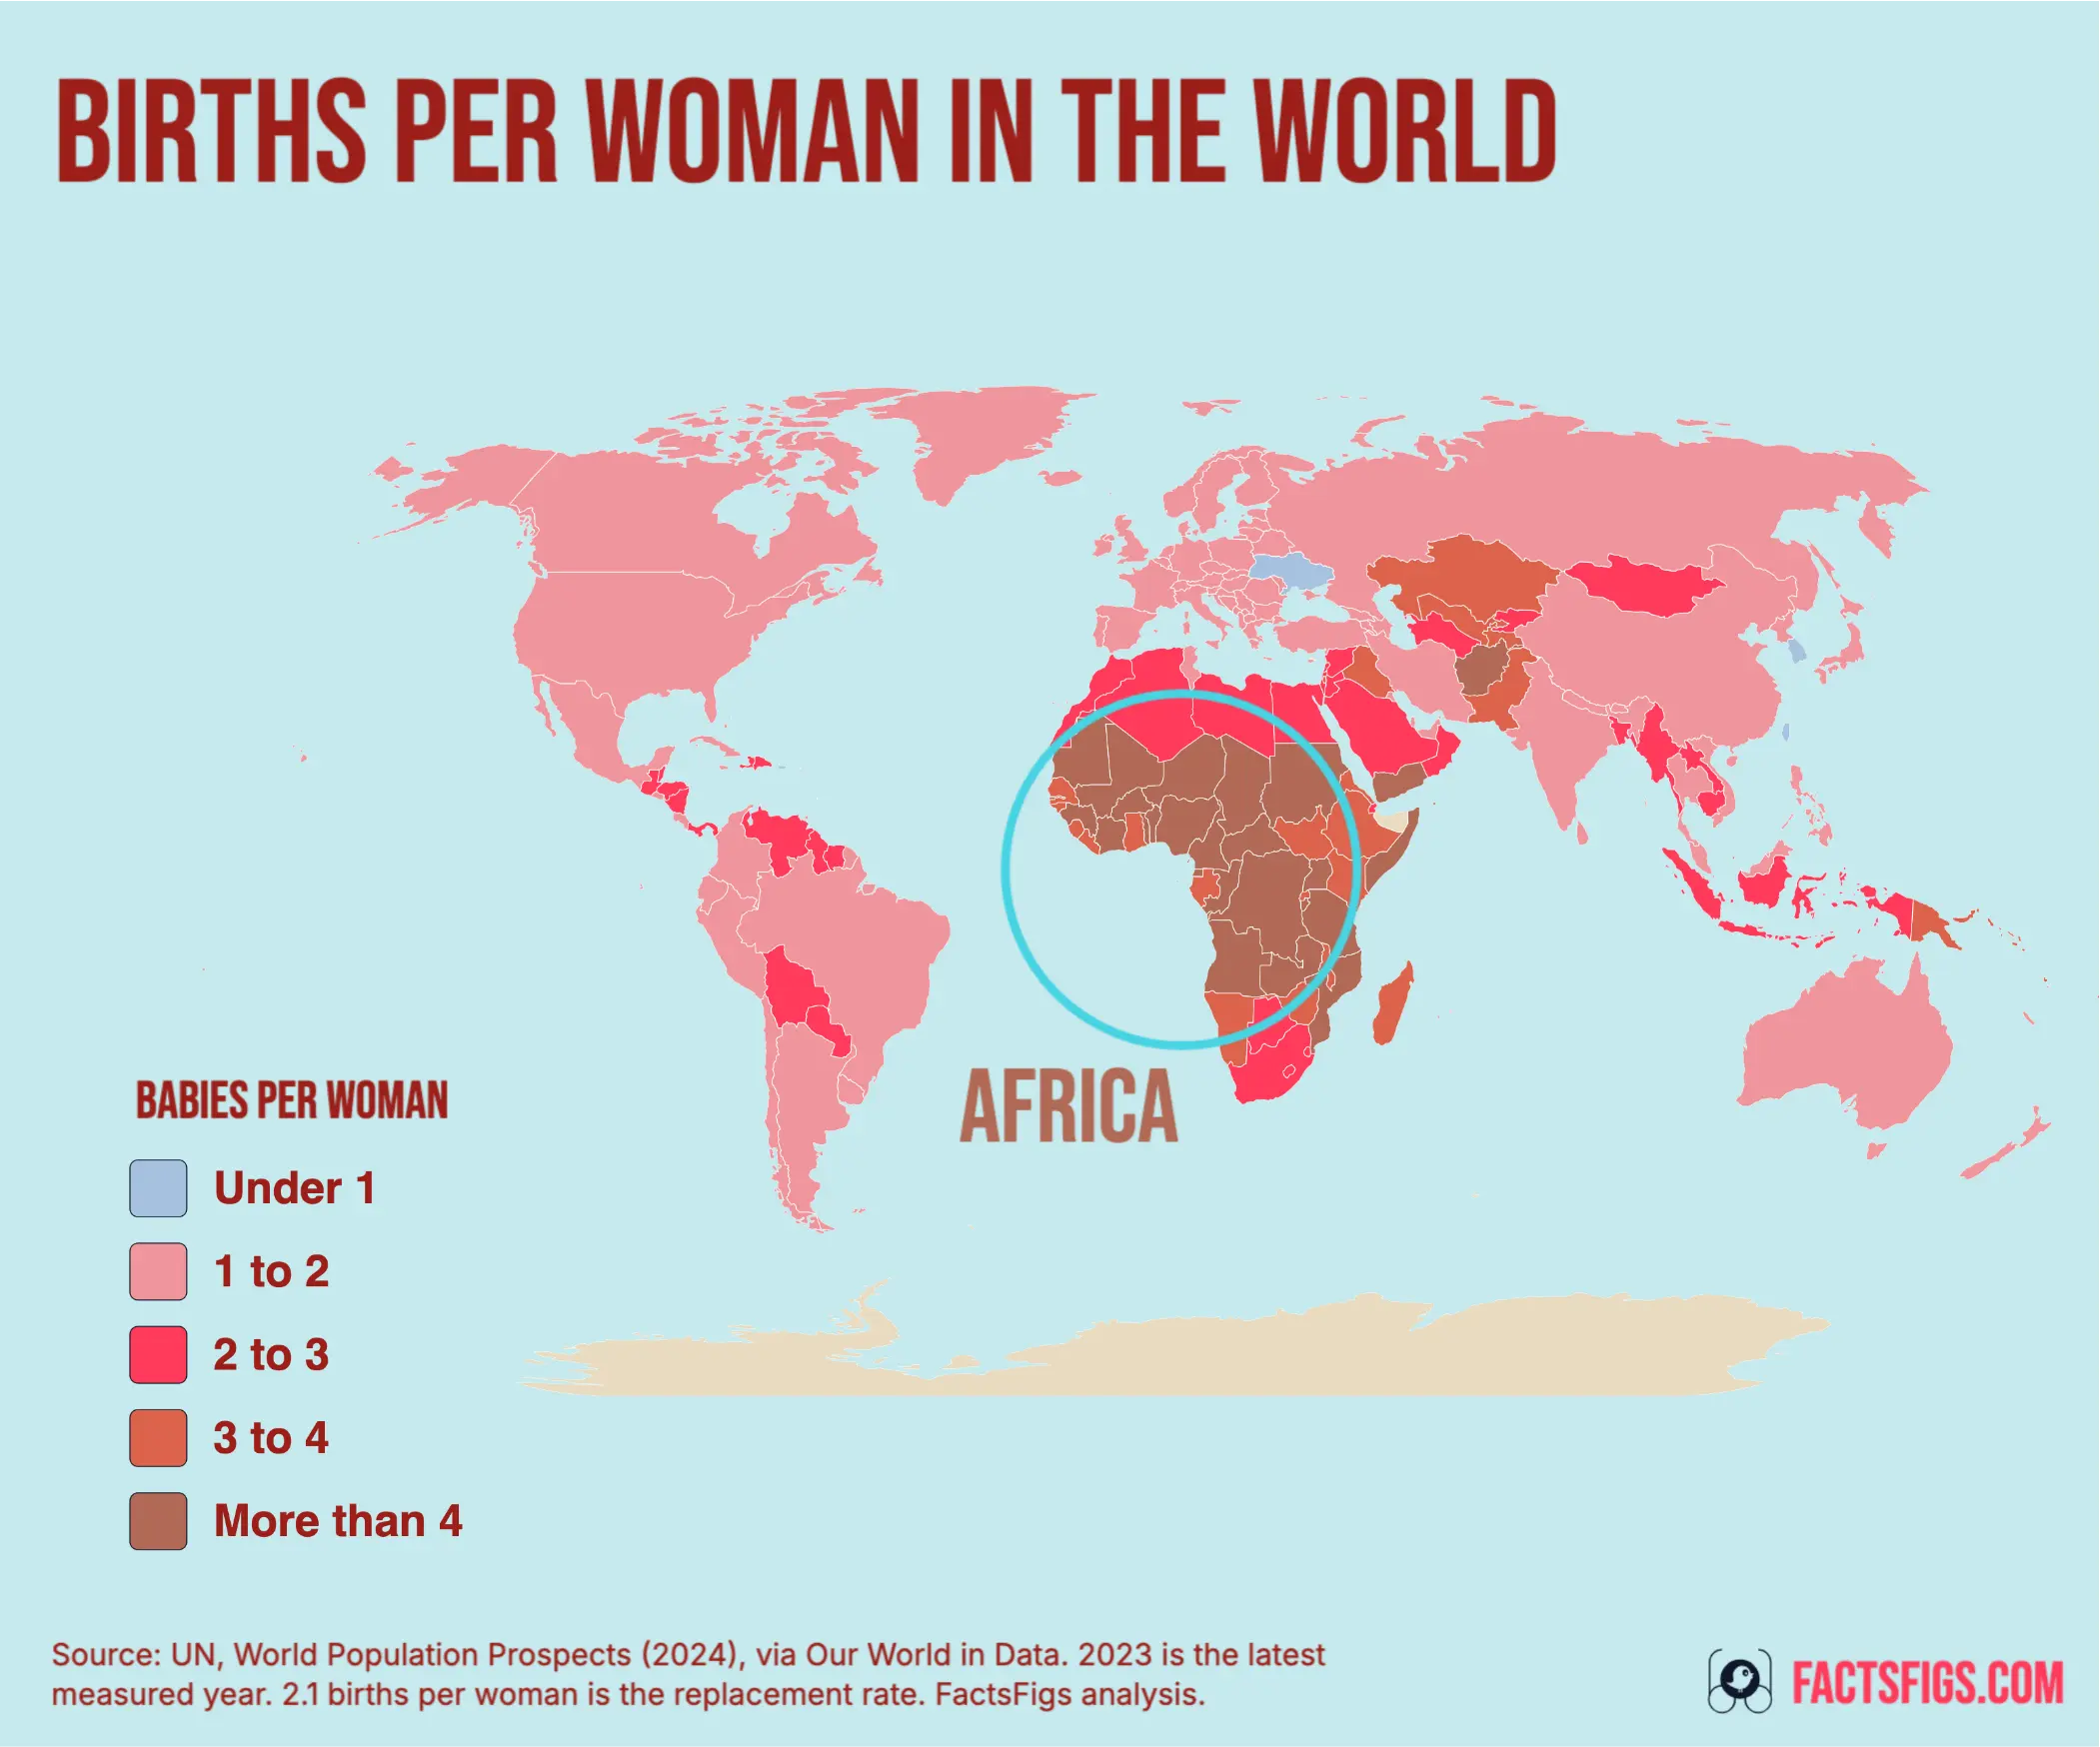
Not globally, and not yet. The world recorded 2.25 births per woman in 2023. Half of its sizeable countries were already below the 2.1 replacement line.
World fertility peaked at 5.31 in 1963 and has fallen 58% since, passing below half the peak in 2004. At 2.25 it is still 0.15 above replacement, so the headline answer to the question is no.
The country-level answer is the opposite. Of the 160 countries and territories with at least a million people, exactly half are below 2.1, and the median one sits at 2.10, on the line itself, against 3.81 in 1990. Across all 237 entities, 130 are below replacement and they hold 67.3% of the world's people.
! What the Map Settles, and What It Leaves Open:
•
The Median Country Has Reached the Line:2.10 births per woman among countries with a million or more residents, against 3.81 in 1990.
•
Two Thirds of People Already Live Below It:5.44 billion of 8.09 billion, in one of the 130 countries and territories under 2.1.
•
Below Replacement Is Not the Same as Shrinking:Momentum, migration and longer lives move a population independently of how many children are born.
? The Figures Behind the Answer:
•
World, 2023:2.25 births per woman
•
Peak:5.31 in 1963, down 58% since
•
Lowest state with 1m people:South Korea, 0.72
•
Highest:Somalia, 6.13
The number worth watching is not the world's. It is the distance between a world still above replacement and a majority of its countries that are not, and that distance has only ever closed from one side.
Continue reading below for the full detailed article →
Overview
Why the World and Its Countries Give Different Answers
A world fertility rate is not an average of its countries' rates. It is built from the world's age-specific birth rates, so it leans towards wherever the women of childbearing age actually are, and a handful of large, high-fertility countries hold it up while most countries sink beneath it. That is precisely what has happened. Nigeria at 4.48, DR Congo at 6.05, Pakistan at 3.60 and Ethiopia at 3.99 contribute enough births to keep the world figure at 2.25, while 130 of the 237 places in this dataset are under 2.1 and the median sizeable country has arrived at the line. Both statements are true at the same time, and most arguments about global fertility turn out to be arguments about which of the two you quote.
The Three Numbers That Answer the Question
What the world records, where the typical country has arrived, and how much of humanity is already on the far side of 2.1.
The World Is at 2.25, Still Above Replacement
2.25 births per woman
The UN's measured series for 2023 puts the world at 2.25 children per woman, down from a peak of 5.31 in 1963 and below half that peak since 2004. It sits 0.15 above the 2.1 replacement line, which is close, but on this dataset the world has not crossed it and the series stops there.
The Median Sizeable Country Sits at 2.10
2.10 births per woman
Rank the 160 countries and territories with a million or more people and the one in the middle reads 2.10, which is the replacement line to two decimal places. In 1990 that midpoint was 3.81 and in 1950 it was 5.97. Half of the group is now below the line and half above it.
67.3% of People Live Below the Line
67.3%
The 130 countries and territories under 2.1 hold 5.44 billion of the 8.09 billion people in this dataset. One further cut sharpens it: 29.1% of humanity lives somewhere under 1.5, and China, at 1.00 births per woman with 1.42 billion residents, does most of that work on its own.
The Replacement Line by the Numbers
Countries and territories below 2.1 54.9 %130 of 237, against 60 in 1990 and 4 in 1950.
People in a country under 1.5 29.1 %China, Japan, Italy, Spain, Russia and Germany are all in that band.
People in a country at 4.0 or above 11.3 %27 countries and territories, 26 of them UN member states.
The two rules this post follows
Why 2.1 Is Not Every Country's Replacement Line
The map draws 237 countries and territories, including places that are not countries. Every ranked list below is restricted to states with at least a million people, which is why Macao at 0.66 and Hong Kong at 0.72 are discussed but never ranked, and why the Vatican appears nowhere: its 501 residents are recorded at exactly 1.00 in all 74 years from 1950 to 2023, which is a placeholder rather than a measurement. Eight small territories, among them the French overseas departments and Gibraltar, carry values but are too small to draw at this scale.
The 2.1 threshold is an approximation that holds only where almost every child survives to adulthood. Espenshade, Guzman and Westoff found replacement fertility running as high as nearly 3.5, and put East Africa's at 2.94, because the arithmetic has to replace daughters who die before having children of their own. Our World in Data counts it from the other side: Niger read 6 in 2023, but its effective rate, counting only children expected to reach adulthood, was 5.
The lowest band: 65 countries and territories
Under 1.5, and the Lowest Fertility on Earth Is Urban
Sixty-five of the 237 entities are under 1.5 births per woman. Among states with a million or more residents the floor is South Korea at 0.72, then Taiwan at 0.87, Singapore at 0.94, Ukraine at 0.98 and China at 1.00. The two lowest readings anywhere belong to Macao at 0.66 and Hong Kong at 0.72. The shape of that list is the clue: the bottom of the world table is made of city states, island cities, and one country whose capital region holds a fifth of its people.
Inside South Korea the pattern repeats at national scale. The Bank of Korea's December 2023 study put Seoul's own rate at 0.59 against Sejong City's 1.12, and modelled that bringing Korean urban concentration down to the OECD average would lift the national figure by 0.414. The same study found young adults under high competitive pressure wanted 0.73 children on average, against 0.87 for those under low pressure. Korea's own statistics agency has since reported 0.75 for 2024 and 0.80 for 2025, two years of marriage-led recovery from a very low base rather than a reversal, and neither year appears on this map, which stops at 2023.
That is why the straightforward cost explanation does not quite fit. Doepke, Hannusch, Kindermann and Tertilt argue the relationships economists built on have broken, with the cross-country link between women's labour force participation and fertility now positive rather than negative, and what separates rich countries is whether a career and a family can be held at once. It explains rich East Asia far better than any story that turns on prices alone.
The second band: 65 countries and territories
Between 1.5 and 2.1 Sits Most of the Rich World, and India
The 1.5 to 2.1 band holds 65 entities and the names in it are the surprise. India reads 1.98, below replacement on the UN's series and 37% down on its own 3.12 in 2003, which is the fertility collapse running underneath the population crossover with China we traced year by year in a separate story. The United States and Brazil are both at 1.62, Mexico and Vietnam at 1.91, Iran at 1.70 and the United Kingdom at 1.56, with Kosovo at 1.54, down from 3.67 in 1990.
The United States is the awkward case, with the most research attention and the least settled answer. Kearney, Levine and Pardue examined the decline since 2007 and could not identify an economic, policy or social factor accounting for much of it. The fall runs across almost every demographic subgroup, which is what pointed them towards a society-wide cause, and their own suggestion, shifting priorities across cohorts, is offered as a conjecture rather than a finding. The richest country's fertility decline has no agreed explanation.
The 2.1 to 3 Band Is Emptying Faster Than Any Other
Forty-eight entities sit between 2.1 and 3, and the band works as a waiting room rather than a resting place. Indonesia is at 2.13, Bangladesh at 2.16, South Africa at 2.22, Morocco at 2.23, Saudi Arabia at 2.28 and Egypt at 2.75. In 2000 the band held 54 entities and today it holds 48, while over the same period the count below 2.1 went from 90 to 130. Countries pass through this range in a decade or two, and almost none come back up through it.
Israel at 2.83 is the band's genuine anomaly: the highest fertility of any high-income country, comfortably above replacement, and holding there while every comparable economy fell away. It is the standing argument that nothing about being rich makes sub-replacement fertility inevitable.
The top band: 27 countries and territories
Above 4.0, Every Country Is Below Its 1990 Level
Twenty-seven entities are at 4.0 or above and they hold 11.3% of the world's people. Somalia leads at 6.13, then Chad at 6.12, Niger at 6.06, DR Congo at 6.05 and the Central African Republic at 6.01. Twenty-six of the 27 are UN member states; the exception is Mayotte, a French overseas department at 4.62.
The cliché this band attracts is that African fertility is not moving. Every one of the 27 is below its 1990 level, and the spread inside the group is the actual story. Burkina Faso has gone from 7.01 in 1990 to 4.19, a fall of 40%. The Central African Republic has gone from 6.05 to 6.01, a fall of 1%, and is higher now than it was in 2003. Ethiopia, meanwhile, has fallen from 6.40 in 2003 to 3.99 and left the band entirely.
Nigeria is where the measurement itself is contested. The map carries the UN's 4.48 for 2023; Nigeria's own 2023-24 Demographic and Health Survey reports 4.8, with rural women at 5.6 and urban women at 3.9. Part of that gap is definitional, because a survey rate covers the three years before fieldwork rather than one calendar year. We kept the UN figure so the map stays internally consistent, and did not average the two.
Countries and territories at 4.0 births per woman or above
178 in 1950, 97 in 1990, 63 in 2000, 27 in 2023
The world series, 1950 to 2023
The One Interruption in Seventy Years Was a Famine
The world rate rose before it fell. It was 4.85 in 1950, peaked at 5.31 in 1963 as child mortality dropped faster than births did, and has fallen 58% since, passing below half the peak in 2004. The count of entities under 2.1 went from 4 in 1950 to 60 in 1990 to 130 now, and the count at 4.0 or above travelled the other way, from 178 to 27.
The series has exactly one visible interruption, a dip to 4.57 in 1961 and a spike back to 5.31 by 1963, and it belongs to a single country. China runs 6.43 in 1957, 4.45 in 1960, 3.86 in 1961 and then 7.51 in 1963. Over the identical years the UN's own aggregate for less developed regions excluding China holds between 6.11 and 6.15 and never moves. The world's only wobble is China's famine of 1959 to 1961 and the rebound that followed it. Everywhere else, the line simply falls.
The time dimension a single-year map cannot carry
World Fertility and the Band Counts, 1950 to 2023
Counts are taken on the same fixed set of 237 countries and territories in every year, so the columns are comparable across the whole series. The median is the midpoint country, not a population-weighted figure.
1950
4.85
5.81
4
1
178
1963
5.31
6.09
7
1
178
1990
3.31
3.27
60
12
97
2000
2.75
2.58
90
36
63
2008
2.63
2.37
99
28
51
2010
2.60
2.25
103
30
51
2019
2.40
2.05
122
46
36
2023
2.25
1.95
130
65
27
1963 is the world peak and 2008 the low point of the under-1.5 count, which fell from 36 in 2000 before more than doubling by 2023. No download is offered, because we could not satisfy ourselves from the UN Population Division's own terms that redistributing the series is permitted.
The policy question
Has Any Country Bought Its Fertility Rate Back?
Hungary is the case everyone cites, and it has now gone backwards. Roughly 5% of GDP goes to family subsidies, and the rate rose from about 1.23 in 2011 to 1.61 in 2021. It reads 1.49 in our 2023 data, and Hungary's own statistics office has since reported 1.39 for 2024 and 1.31 for 2025, with births at their lowest since records began in 1949. The sceptical reading is that much of the rise was timing: births postponed through the financial crisis arriving at once, which lifts a period rate while it happens and depresses it afterwards.
The largest sustained rise in the dataset is somewhere almost nobody looks. Between 2003 and 2023 Uzbekistan went from 2.50 to 3.50, Kazakhstan from 2.08 to 3.01 and Mongolia from 2.02 to 2.69. Kazakhstan is the documented case: down to 1.80 in 1999, back to 3.00 by 2018, with the published analysis attributing 81% of the 2000 to 2011 increase to economic growth and finding that postponed births contributed nothing. The clearest fertility recovery in the world was bought by a commodity boom, not by a baby bonus.
The evidence on what policy actually moves is narrower than the debate suggests. Bergsvik, Fauske and Hart's review of 35 quasi-experimental studies draws the distinction that matters: childcare expansions raise completed family size, cash transfers move the timing. Of the 160 sizeable countries, 132 were lower in 2023 than in 2003 and 28 were higher, and those 28 cluster in post-Soviet states recovering from a crash rather than in countries that paid for them.
What the map does not say
A Country Below 2.1 Is Not a Country Shrinking
Below replacement does not mean falling, and not for decades. A population with many young women keeps growing after fertility reaches 2.1, because the number of potential mothers is still rising; Keyfitz formalised that as population momentum. It runs in reverse too, so a population that has already aged through low fertility keeps shrinking even if births recover, which is why parts of Eastern Europe are expected to decline whatever happens next.
The world is still growing. Population growth was about 0.9% a year in 2023, down from a peak of about 2.3% in 1963, the same year fertility peaked, and the UN's 2024 projections, which are not part of the series mapped here, expect a peak of around 10.3 billion in the mid-2080s. Migration and mortality move national totals independently of births, which is why two countries at the same fertility rate can be heading in opposite directions, and the mortality side has a geography of its own.
The measure carries a known bias too. A total fertility rate is a period figure: it describes what a woman would have if one year's age-specific rates held for her whole life. Where childbearing is being postponed, it sits below what those women will actually end up with, and can stay below for as long as the postponement lasts. The direction of that bias is well established; its size varies too much between countries to quantify here. A rate of 1.5 describes one year, not a generation.
The data behind this story comes from UN, World Population Prospects (2024), with major processing by Our World in Data, and full credit for collecting and maintaining it goes to the United Nations Department of Economic and Social Affairs, Population Division. FactsFigs filtered the 2023 country slice out of the full 1950 to 2023 series itself rather than using the chart as published, and derived the band counts, the medians, the population shares and the twenty-year changes from it. Where sources disagree we name both and choose one: Nigeria is shown at the UN's 4.48 rather than the national survey's 4.8, and the figures for South Korea in 2024 and 2025 and for Hungary in 2024 and 2025 come from those countries' own statistics agencies, not from this dataset.
FactsFigs reviews, cleans, and cross-checks every source dataset before shaping it into a data story. Each visualization is created and designed in FactsFigs Design Studio, an internal tool developed and owned by FactsFigs, and is the original work of a FactsFigs author, not an AI-generated copy of any existing graphic. Individual assets within a visual may or may not be produced with AI tools, but the design of the visual itself is solely FactsFigs' own.
Figures are estimates at the time of publication, provided for information only. Nothing here is financial advice or a guarantee of accuracy.
Last verified: 29 Oct 2026
The charts in this article were built with our own publishing system. See what it does →