

26%
About 2.14 billion people in 2024, against 39% in 2000. The share fell, but the number only fell from 2.39 billion because the world added 2 billion people.

Facts & Figures
Visual Intelligence
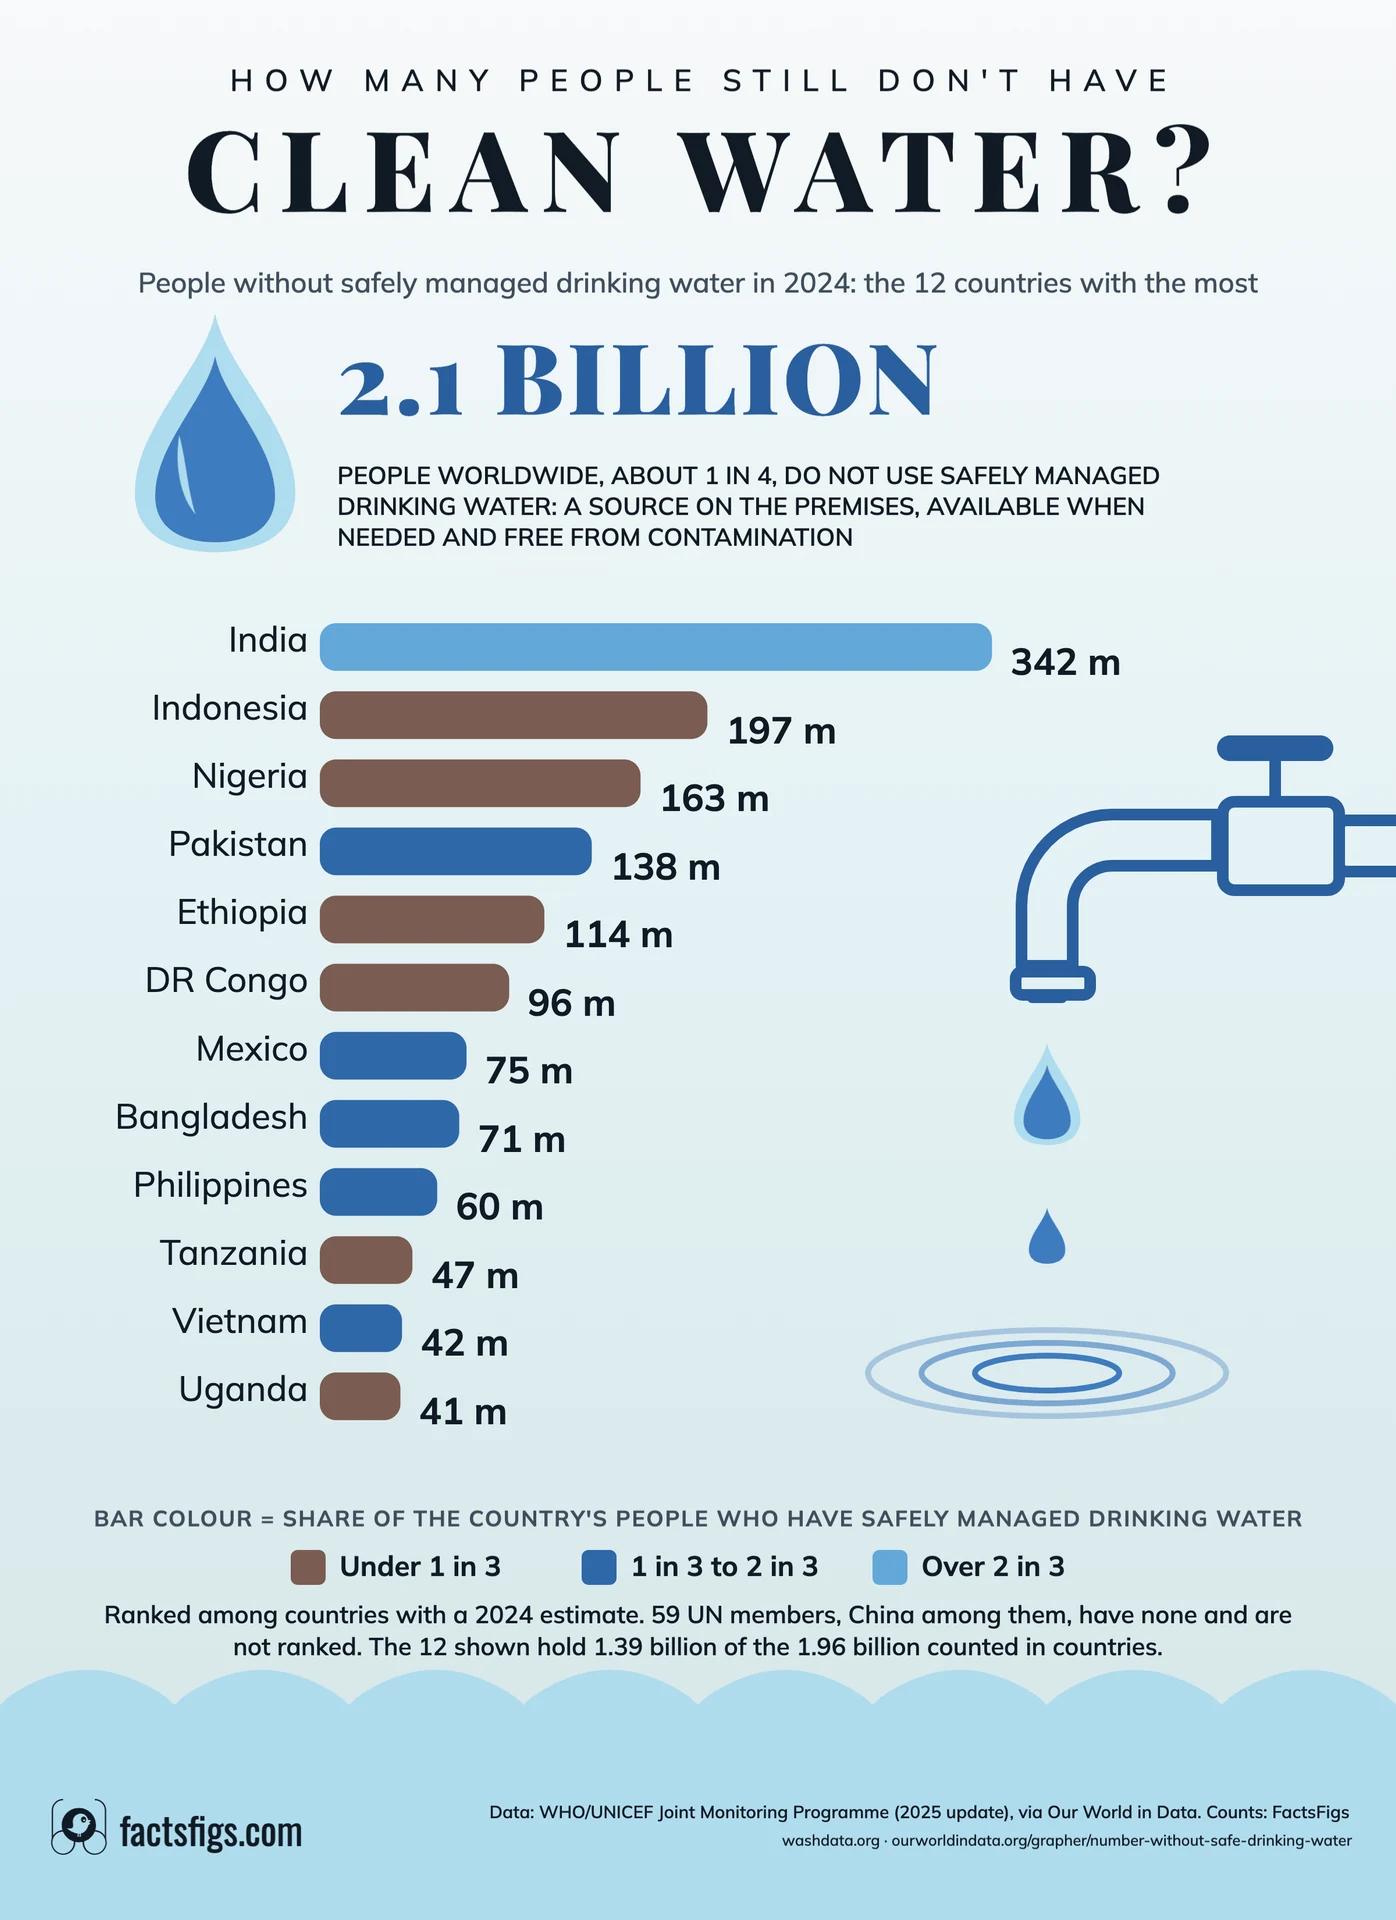
About 2.1 billion people, 1 in 4, lack safely managed drinking water, and most of them live in a few large countries.
In 2024 an estimated 2.14 billion people did not have safely managed drinking water, which means water from an improved source that is on the premises, available when needed and free from contamination. That is 26% of the world, down from 39% in 2000. Most of them are not without a source at all. About 1.4 billion use a basic improved source that fails the stricter test, and 106 million drink untreated surface water. India has the most people without, 342 million, and ten countries hold 61% of the world total.
Counting people instead of percentages moves the focus from the poorest countries to the biggest ones, and the programme has no estimate for 59 UN members, including China.
Continue reading below for the full detailed article →
Overview
The WHO/UNICEF Joint Monitoring Programme, known as the JMP, estimates how many people use each level of drinking water service, from national surveys and censuses. This page uses its 2025 update, which runs to 2024 and applies United Nations population estimates. The top level is safely managed: water from an improved source such as a pipe or a protected well, on the premises, available when needed and free from faecal and priority chemical contamination. Anyone below that level counts as lacking it, even when an improved source is nearby. That is why the figure is larger than the number of people with no source.
How much of the world lacks safely managed water, how concentrated the count is and how few people have no improved source at all.
26%
About 2.14 billion people in 2024, against 39% in 2000. The share fell, but the number only fell from 2.39 billion because the world added 2 billion people.
61%
The ten countries with the most people without it hold 1.3 billion of the 2.14 billion. India, Indonesia, Nigeria and Pakistan alone hold 840 million.
5%
106 million of the 2.14 billion take water straight from a river, lake or canal. Most of the rest have an improved source that fails the stricter test.
The short answer
About 2.1 billion people, or 1 in 4, did not have safely managed drinking water in 2024. The programme's own figures are 2.1 billion and 74% coverage, so 26% do not have it. Clean water is the everyday phrase; safely managed is the measure, and it is stricter than most people mean by clean.
Most of the 2.1 billion do have an improved source: about 1.4 billion use one within a 30-minute round trip. They fall short because the water is not on the premises, not there when needed or not tested as free from contamination. Only 106 million, about 5% of the total, take their water straight from a river, lake or canal.
The definition
The programme ranks drinking water on a ladder. Safely managed is the top rung: an improved source such as a pipe, borehole or protected well, located on the premises, available when needed and free from faecal and priority chemical contamination. Below it come basic (an improved source within a 30-minute round trip), limited (an improved source farther away), unimproved (such as an unprotected well or spring) and surface water from a river, lake or canal.
The ladder matters because the same people appear differently at each rung. At the basic level or above, 91% of the world has a source; at the safely managed level, 74%.
Where they live
India, with 342 million, then Indonesia (197 million), Nigeria (163 million), Pakistan (138 million) and Ethiopia (114 million). The ten countries with the most hold 1.3 billion people, 61% of the world figure and 66% of the total counted in individual countries.
Counts and shares tell different stories. India has the most people without, but 76% of Indians have safely managed water. In Ethiopia 13.5% do and in DR Congo 11.9%. Among countries of more than a million people, the lowest shares are in the Central African Republic (6%), Chad (6%) and Sierra Leone (11%), all small enough that they do not reach the top 12 by count.
Over time
Slowly. The share with safely managed water rose from 61% in 2000 to 68% in 2015 and 74% in 2024. The number without rose from 2.39 billion in 2000 to a peak of 2.48 billion in 2008, then fell to 2.41 billion in 2015 and 2.14 billion in 2024, which is 270 million fewer in nine years.
The count falls more slowly than the share because the world grew from 6.2 billion to 8.2 billion people over the same years. This page reports the past and does not forecast when everyone will be covered.
Income
Poor countries have the lowest shares, but middle-income countries have the most people. In 2024 about 31% of people in low-income countries had safely managed water, against 69% in lower-middle-income, 78% in upper-middle-income and 96% in high-income countries.
Counted in people, lower-middle-income countries had 963 million without it, upper-middle-income countries 625 million and low-income countries 523 million, with 59 million in high-income countries. The two middle groups hold 73% of the groups' total. The programme computes each group separately, so the groups add to 2.17 billion, not the 2.14 billion world figure.
The gap in the data
Fifty-nine UN member states have no 2024 estimate for safely managed drinking water. Together they had 2.25 billion people in 2023 on UN population estimates, and the largest is China, with 1.42 billion. Others include Turkey, Thailand, Kenya, Sudan, Argentina, Yemen, Niger, Mali and Somalia. The programme publishes no safely managed estimate for them.
The 159 places with an estimate add up to 1.96 billion people without. The programme's world total is 2.14 billion, so about 180 million people are counted in the world figure but cannot be assigned to a country. Every ranking on this page is therefore a ranking of countries with an estimate, not of the world.
The 12 largest counts
The 12 countries with the most people without safely managed drinking water, the share of their people who have it and the running total as a share of the 159 countries counted.
| 1 | 🇮🇳 India | 342 | 76% | 17% |
| 2 | 🇮🇩 Indonesia | 197 | 30% | 27% |
| 3 | 🇳🇬 Nigeria | 163 | 30% | 36% |
| 4 | 🇵🇰 Pakistan | 138 | 45% | 43% |
| 5 | 🇪🇹 Ethiopia | 114 | 14% | 49% |
| 6 | DR Congo | 96 | 12% | 54% |
| 7 | 🇲🇽 Mexico | 75 | 43% | 57% |
| 8 | 🇧🇩 Bangladesh | 71 | 59% | 61% |
| 9 | 🇵🇭 Philippines | 60 | 48% | 64% |
| 10 | 🇹🇿 Tanzania | 47 | 31% | 66% |
| 11 | 🇻🇳 Vietnam | 42 | 59% | 68% |
| 12 | 🇺🇬 Uganda | 41 | 18% | 71% |
Counts are the programme's estimates of people not using safely managed drinking water, rounded to the nearest million, on United Nations population estimates. Ranked among the 159 places with a 2024 estimate; 59 UN members, including China, have none. DR Congo is the Democratic Republic of the Congo.
How this was built
We took the programme's 2024 estimates of the share of people using safely managed drinking water and the number not using it, as published by Our World in Data. The file holds 180 entities: 163 places and 17 regional or income-group totals, which we removed by their codes. Of the 163 places, 159 have a 2024 value: 134 UN member states, 23 dependencies or territories, Palestine and Niue. None of the territories is near the top 12. We ranked the 159 by the number of people without safely managed water.
We checked the ten largest counts against the programme's own country workbooks, and the shares match to one decimal and the counts to within a million. The counts are model estimates built from surveys on UN population estimates, so they are shown to the nearest million. DR Congo is shortened from the Democratic Republic of the Congo.
WHO/UNICEF Joint Monitoring Programme, Progress on household drinking water, sanitation and hygiene 2000-2024 Our World in Data, number of people not using safely managed drinking water
The data behind this story comes from the WHO/UNICEF Joint Monitoring Programme for Water Supply, Sanitation and Hygiene, Progress on household drinking water, sanitation and hygiene 2000-2024 (2025), and its household database, as processed and published by Our World in Data under CC BY 4.0. Population figures are United Nations estimates applied by the programme. Full credit for collecting and maintaining the data goes to the programme and the national statistics offices behind it. This page is not endorsed by WHO or UNICEF.
FactsFigs reviews, cleans, and cross-checks every source dataset before shaping it into a data story. Each visualization is created and designed in FactsFigs Design Studio, an internal tool developed and owned by FactsFigs, and is the original work of a FactsFigs author, not an AI-generated copy of any existing graphic. Individual assets within a visual may or may not be produced with AI tools, but the design of the visual itself is solely FactsFigs' own.
Figures are estimates at the time of publication, provided for information only. Nothing here is financial advice or a guarantee of accuracy.
Last verified: 20 Nov 2026
Related Publications
Organic farming does less harm on the same land, but for the same amount of food only pesticide harm clearly favours it, and it needs 64% more land.
18 Nov 2026
27 of 38 antibiotic classes reached patients in the 1940s to 1960s, 13 in the 1960s alone. Only 9 have arrived since 1970.
17 Nov 2026
Humans have warmed the Earth by 1.37°C, tracking the 2,780 billion tonnes of CO2 emitted since 1850, 47% of it since 1990.
16 Nov 2026
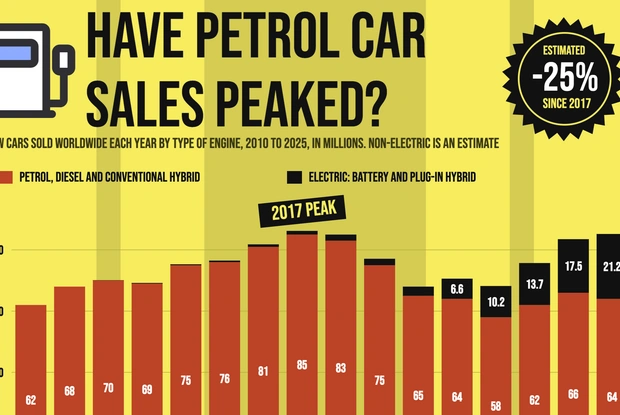
The IEA dates the peak of conventional car sales to 2017. An estimated 25% fewer were sold in 2025; China is about half the fall.
14 Nov 2026