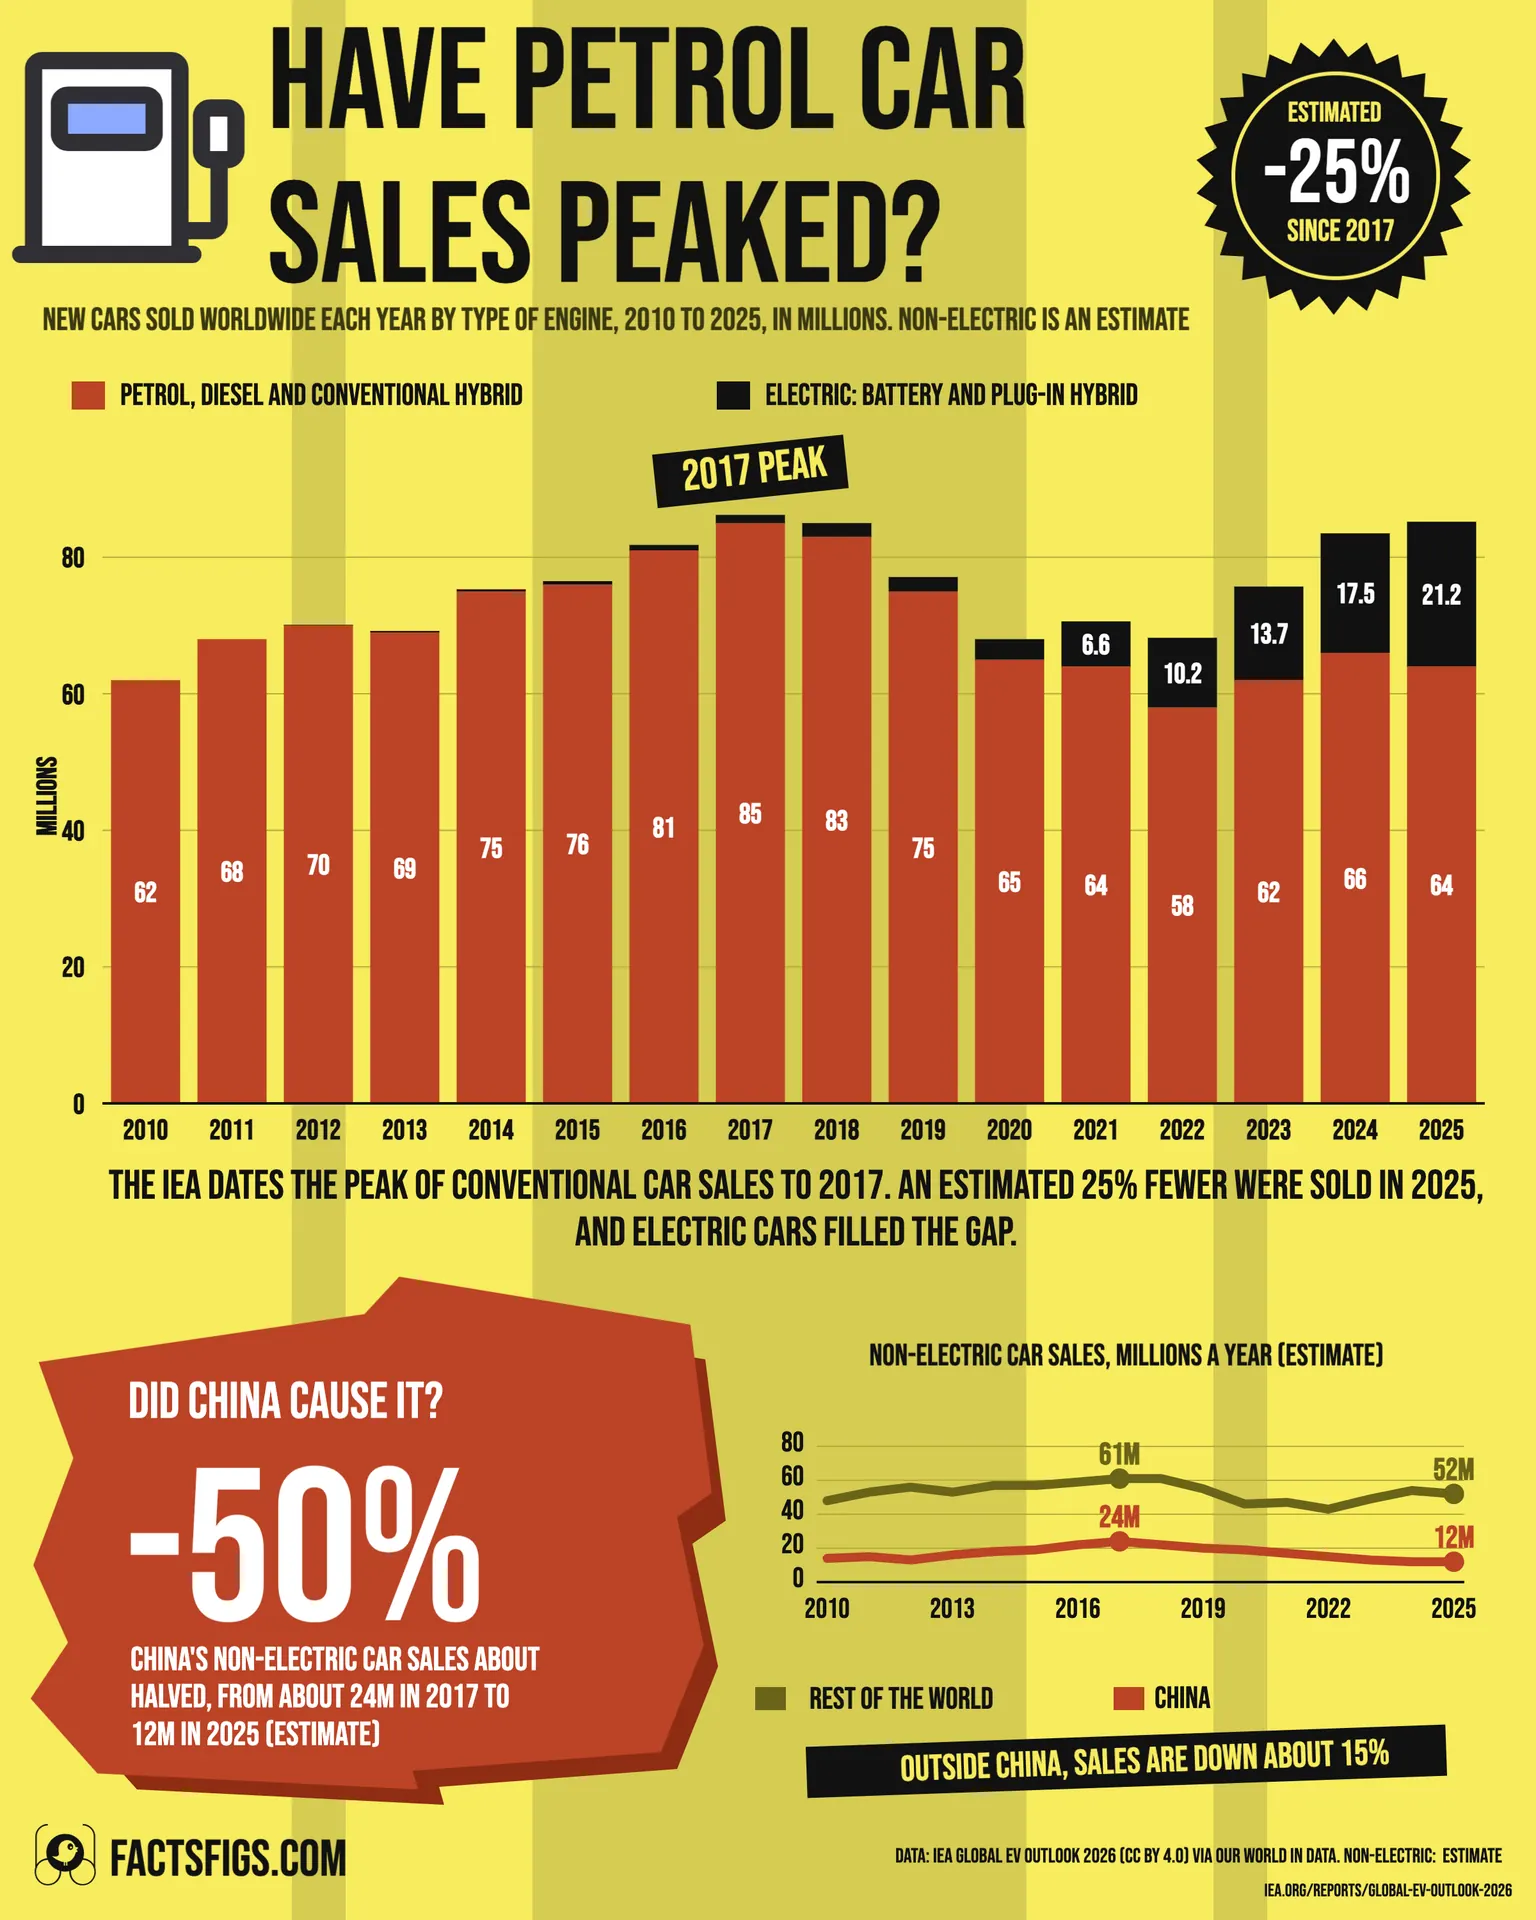
Yes. The IEA dates the peak of conventional car sales to 2017, and an estimated quarter fewer non-electric cars were sold in 2025.
FactsFigs estimates about 85 million non-electric new cars sold worldwide in 2017 and 64 million in 2025, from the IEA's published electric sales and rounded sales shares. China's non-electric sales about halved, from about 24 million to 12 million, which is roughly half of the world's fall.
The path was not a line. Sales fell about 10% in 2019, before the pandemic, hit a low in 2022 and rebounded by 2024, while electric cars grew to 21.2 million, a quarter of all sales.
! Three Things Behind the Peak:
•
The Peak Is the IEA's Call, the Size Is Ours:The IEA names 2017; the 25% fall is a FactsFigs estimate, good to a few points.
•
China Is About Half the Fall:China's non-electric sales about halved, to about 12M; the rest of the world fell about 15%.
•
Electric Cars Replaced, Not Added:Electric sales rose 20M as non-electric fell about 21M, so the market is the same size.
? The Figures Behind the Story:
•
Peak year, per the IEA:2017
•
Non-electric new cars, 2017:About 85 million, estimate
•
Non-electric new cars, 2025:About 64 million, estimate
•
Electric cars sold, 2025:21.2 million, 25% of all sales
The world buys about as many new cars as it did in 2017, but a quarter of them are now electric.
Continue reading below for the full detailed article →
Overview
What the Data Counts as a Petrol Car
The International Energy Agency publishes how many electric cars are sold each year and what share of new cars they are, with electric meaning battery-electric and plug-in hybrid. Everything else is non-electric: petrol, diesel and conventional hybrid cars, so it is wider than "petrol", and the data do not say how much of it is petrol alone. "Petrol car sales" is shorthand for that wider group. The IEA reports vans separately from cars. The IEA does not publish a non-electric total; Our World in Data derives it, and so does this page, from the IEA's electric sales and rounded shares. Those figures are estimates, good to a few percent, so they are shown to the nearest million.
Three Numbers Behind the Peak
How far non-electric sales have fallen, how much of that is China and how many electric cars replaced them.
An Estimated 25% Fewer Non-Electric Cars Than in 2017
25%
About 85 million non-electric new cars were sold worldwide in 2017 and about 64 million in 2025. The IEA publishes the inputs rounded, so the true fall could differ by several points.
China's Non-Electric Sales About Halved
50%
From about 24 million in 2017 to about 12 million in 2025, which is about 12 million of the world's estimated 21 million fall. Outside China the fall is about 15%.
21.2M Electric Cars Sold in 2025
21.2M
One in four new cars worldwide, in the IEA's data. In 2017 electric cars were 1.2 million, or 1.4% of sales.
China by the Numbers
China's share of world electric sales 63 %13.3 million of 21.2 million in 2025.
Electric share of China's new cars 53 %Up from 2.4% in 2017.
China's share of world non-electric sales 19 %Down from about 28% in 2017, estimate.
The peak
When Did Petrol Car Sales Peak?
The IEA puts it in 2017. Its Global EV Outlook 2026 says that in its exploratory scenarios sales of conventional cars "never return to their 2017 peak". Our World in Data, which publishes the series this page draws on, also dates the peak to 2017 and notes that Bloomberg New Energy Finance estimated it around the same time. GlobalData, using a wider count of all light vehicles, likewise puts the market's peak at 95 million in 2017.
In the series built for this page, 2017 is the highest year, at about 85 million non-electric cars against about 62 million in 2010. The rounding behind the series means 2016, 2017 and 2018, at about 81, 85 and 83 million, cannot be separated with confidence from these figures alone. The IEA's date rests on its own unrounded data.
Total new car sales, electric and non-electric together, were also at their highest in 2017, at about 86 million.
The fall
Are Petrol Car Sales Falling?
Yes, by an estimated quarter, but not in a straight line. The series falls from about 85 million in 2017 to about 64 million in 2025, most of it in two steps: about 10% in 2019 and about 14% in 2020.
The 2019 fall came before the pandemic. ACEA, counting passenger car registrations from IHS Markit data on a different basis, reports a world fall of 4.9% that year, to 74.9 million. Both measures fell. The series used here shows a larger drop, and we found no source that explains the size of the difference.
The sources do show where the 2019 fall was. ACEA reports China down 8.9%. The China Association of Automobile Manufacturers named the transformation of the industry, trade frictions with the United States, changes in environmental protection standards and cuts to electric car subsidies, and Reuters reported that cities and provinces covering over 60% of China's car sales brought in new emission standards early, which unsettled buyers. ACEA reports India down 11.3%, mainly because of rising ownership costs and tighter consumer credit after problems in the financial sector, and the United States down 3.2%. Europe was up 0.4%.
The pandemic then took a larger bite: the IEA puts the 2020 fall in world car registrations at 16%, with China down about 9% and Europe about 22%.
The series reaches its low in 2022, at about 58 million, and rebounds about 14% by 2024. GlobalData says the global light vehicle market recovered about 10% in 2023 as supply shortages eased and carmakers worked through order backlogs. S&P Global Mobility estimates that over 9.5 million units of light-vehicle production were lost to the semiconductor shortage in 2021 and another 3 million in 2022. The IEA reports that China's conventional car sales fell 8% in 2023, so the rebound came from outside China. The series edges lower in 2025, a change small enough to sit within its rounding, and three years after the low is too short a run to say whether that is a new decline or a pause.
The hidden relationship
Did China Cause the Peak?
China is about half of the fall, not all of it. Its non-electric sales, estimated from the same IEA series, fell from about 24 million in 2017 to about 12 million in 2025, a drop of about half. That is about 12 million of the world's roughly 21 million fall.
The rest of the world fell too, by about 15%, from about 61 million to about 52 million. Europe's non-electric sales fell by roughly a third over the same years.
China's own car market did not shrink. Its total sales were about 24 million in 2017 and 25 million in 2025, while the electric share went from 2.4% to 53%. China bought 63% of the world's electric cars in 2025. The IEA reports that Chinese automakers supplied 60% of global electric car sales and that 70% of the battery-electric cars sold in China in 2025 were already cheaper than the average conventional car; in the small car segment it says electric cars have largely displaced conventional ones.
Policy shaped 2025 too. China's trade-in scheme, launched in April 2024 and renewed in 2025, offered 20,000 yuan for replacing an old vehicle with a new electric car and 15,000 yuan for a new conventional one. The IEA says it was temporarily halted in several cities in July 2025 over limited provincial funding and reports of zero-mileage cars, and electric sales dipped 10% from June. The China Passenger Car Association reported conventional fuel passenger car retail of 10.94 million in 2025, down 9%, on a retail basis that differs from the series used here.
Not by much. On the series' estimates, total sales were about 86 million in 2017 and about 85 million in 2025, within rounding of each other. Over the same years electric sales rose 20 million, from 1.2 million to 21.2 million, and non-electric sales fell about 21 million. That is close to one for one.
The total did dip along the way, to about 68 million in 2020 and again in 2022, before recovering. The market after 2017 is about the same size as before, with a different mix of drivetrains.
All 16 years
World New Car Sales by Type, 2010 to 2025
Electric sales as published by the IEA and the electric share of sales, with estimated total and non-electric sales worldwide, in China and in the rest of the world.
2010
0.0
0.0%
62
62
14
48
2011
0.0
0.1%
68
68
15
53
2012
0.1
0.2%
70
70
13
56
2013
0.2
0.3%
69
69
16
53
2014
0.3
0.4%
75
75
18
57
2015
0.5
0.7%
76
76
19
57
2016
0.8
1.0%
82
81
22
59
2017
1.2
1.4%
86
85
24
61
2018
2.0
2.4%
85
83
22
61
2019
2.1
2.7%
77
75
20
55
2020
3.0
4%
68
65
19
46
2021
6.6
9%
71
64
17
47
2022
10.2
15%
68
58
15
43
2023
13.7
18%
76
62
13
49
2024
17.5
21%
83
66
12
54
2025
21.2
25%
85
64
12
52
Electric means battery-electric and plug-in hybrid. Non-electric is every other new car, including petrol, diesel and conventional hybrid. Estimates are derived from the IEA's electric sales and rounded shares, are good to a few percent and are shown to the nearest million. Rest of the world is the world estimate minus China, calculated by FactsFigs.
Electric cars
How Many Electric Cars Were Sold in 2025?
The IEA's data show 21.2 million electric cars sold worldwide in 2025, up from 17.5 million in 2024 and 1.2 million in 2017. The IEA's own summary says electric sales grew by 20% to exceed 20 million, one quarter of all new cars sold. In 2017 the share was 1.4%.
The shares differ widely by market. The IEA reports electric cars at 28% of new car sales in Europe in 2025 and under 10% in the United States, and says more than 100 countries recorded growth in electric sales. China's 13.3 million electric cars were 63% of the world total.
The IEA's figures for the years ahead are scenarios, not forecasts. In its exploratory scenarios the share of conventional cars shrinks in every case and their sales never return to the 2017 level, and electric cars reach around 50% of world sales in 2035.
For 2026 the IEA expects electric car sales of 23 million, 28% of the total. It says the current high oil price, which it links to the conflict in the Middle East, is drawing attention to the lower running costs of electric cars, and that the conflict's wider economic effects might temper overall car sales. It also reports that electric sales in the first quarter of 2026 were 8% lower than a year earlier, mainly in China and the United States after policy changes, including China cutting its electric car purchase tax exemption to 50% from January. The data on this page end in 2025 and extend none of these projections.
The figures are the IEA's Global EV Outlook 2026 series of new cars sold, as published by Our World in Data, covering 2010 to 2025. The IEA publishes electric sales and the electric share of sales, each rounded. Our World in Data divides one by the other to get total sales and subtracts electric sales to get non-electric. Because the shares are rounded, those results can be off by a few percent, which is why we show them to the nearest million, say "about" and "an estimated", and do not rely on year-to-year differences smaller than that.
The IEA's own data download needs an account and carries different terms from the CC BY 4.0 licence stated on its report pages, so we cite the report and read the figures from Our World in Data's copy, which cites the same licence. The rest-of-world figure is the world estimate minus China, calculated by FactsFigs. The data do not split petrol, diesel and conventional hybrid cars, so every statement about "petrol" cars here means the wider non-electric group. Statements about causes are attributed to the organisation that made them and use those sources' own bases, which differ from the series used here.
The data behind this story comes from the International Energy Agency's Global EV Outlook 2026 (IEA, 2026, licensed CC BY 4.0), read through Our World in Data's processed series of new cars sold by type. Statements about the causes of changes in sales come from ACEA, the China Association of Automobile Manufacturers, the China Passenger Car Association, Reuters, GlobalData and S&P Global Mobility, each attributed in the text. Full credit for collecting and maintaining the data goes to the IEA.
FactsFigs reviews, cleans, and cross-checks every source dataset before shaping it into a data story. Each visualization is created and designed in FactsFigs Design Studio, an internal tool developed and owned by FactsFigs, and is the original work of a FactsFigs author, not an AI-generated copy of any existing graphic. Individual assets within a visual may or may not be produced with AI tools, but the design of the visual itself is solely FactsFigs' own.
Figures are estimates at the time of publication, provided for information only. Nothing here is financial advice or a guarantee of accuracy.
Last verified: 13 Nov 2026
The charts in this article were built with our own publishing system. See what it does →