TL;DR: Where Do America's Veterans Live, and Why Are There Fewer?
Most veterans live in the biggest states, but the highest shares are in Alaska, Virginia and the Mountain West. The total falls because deaths outnumber new veterans by more than two to one.
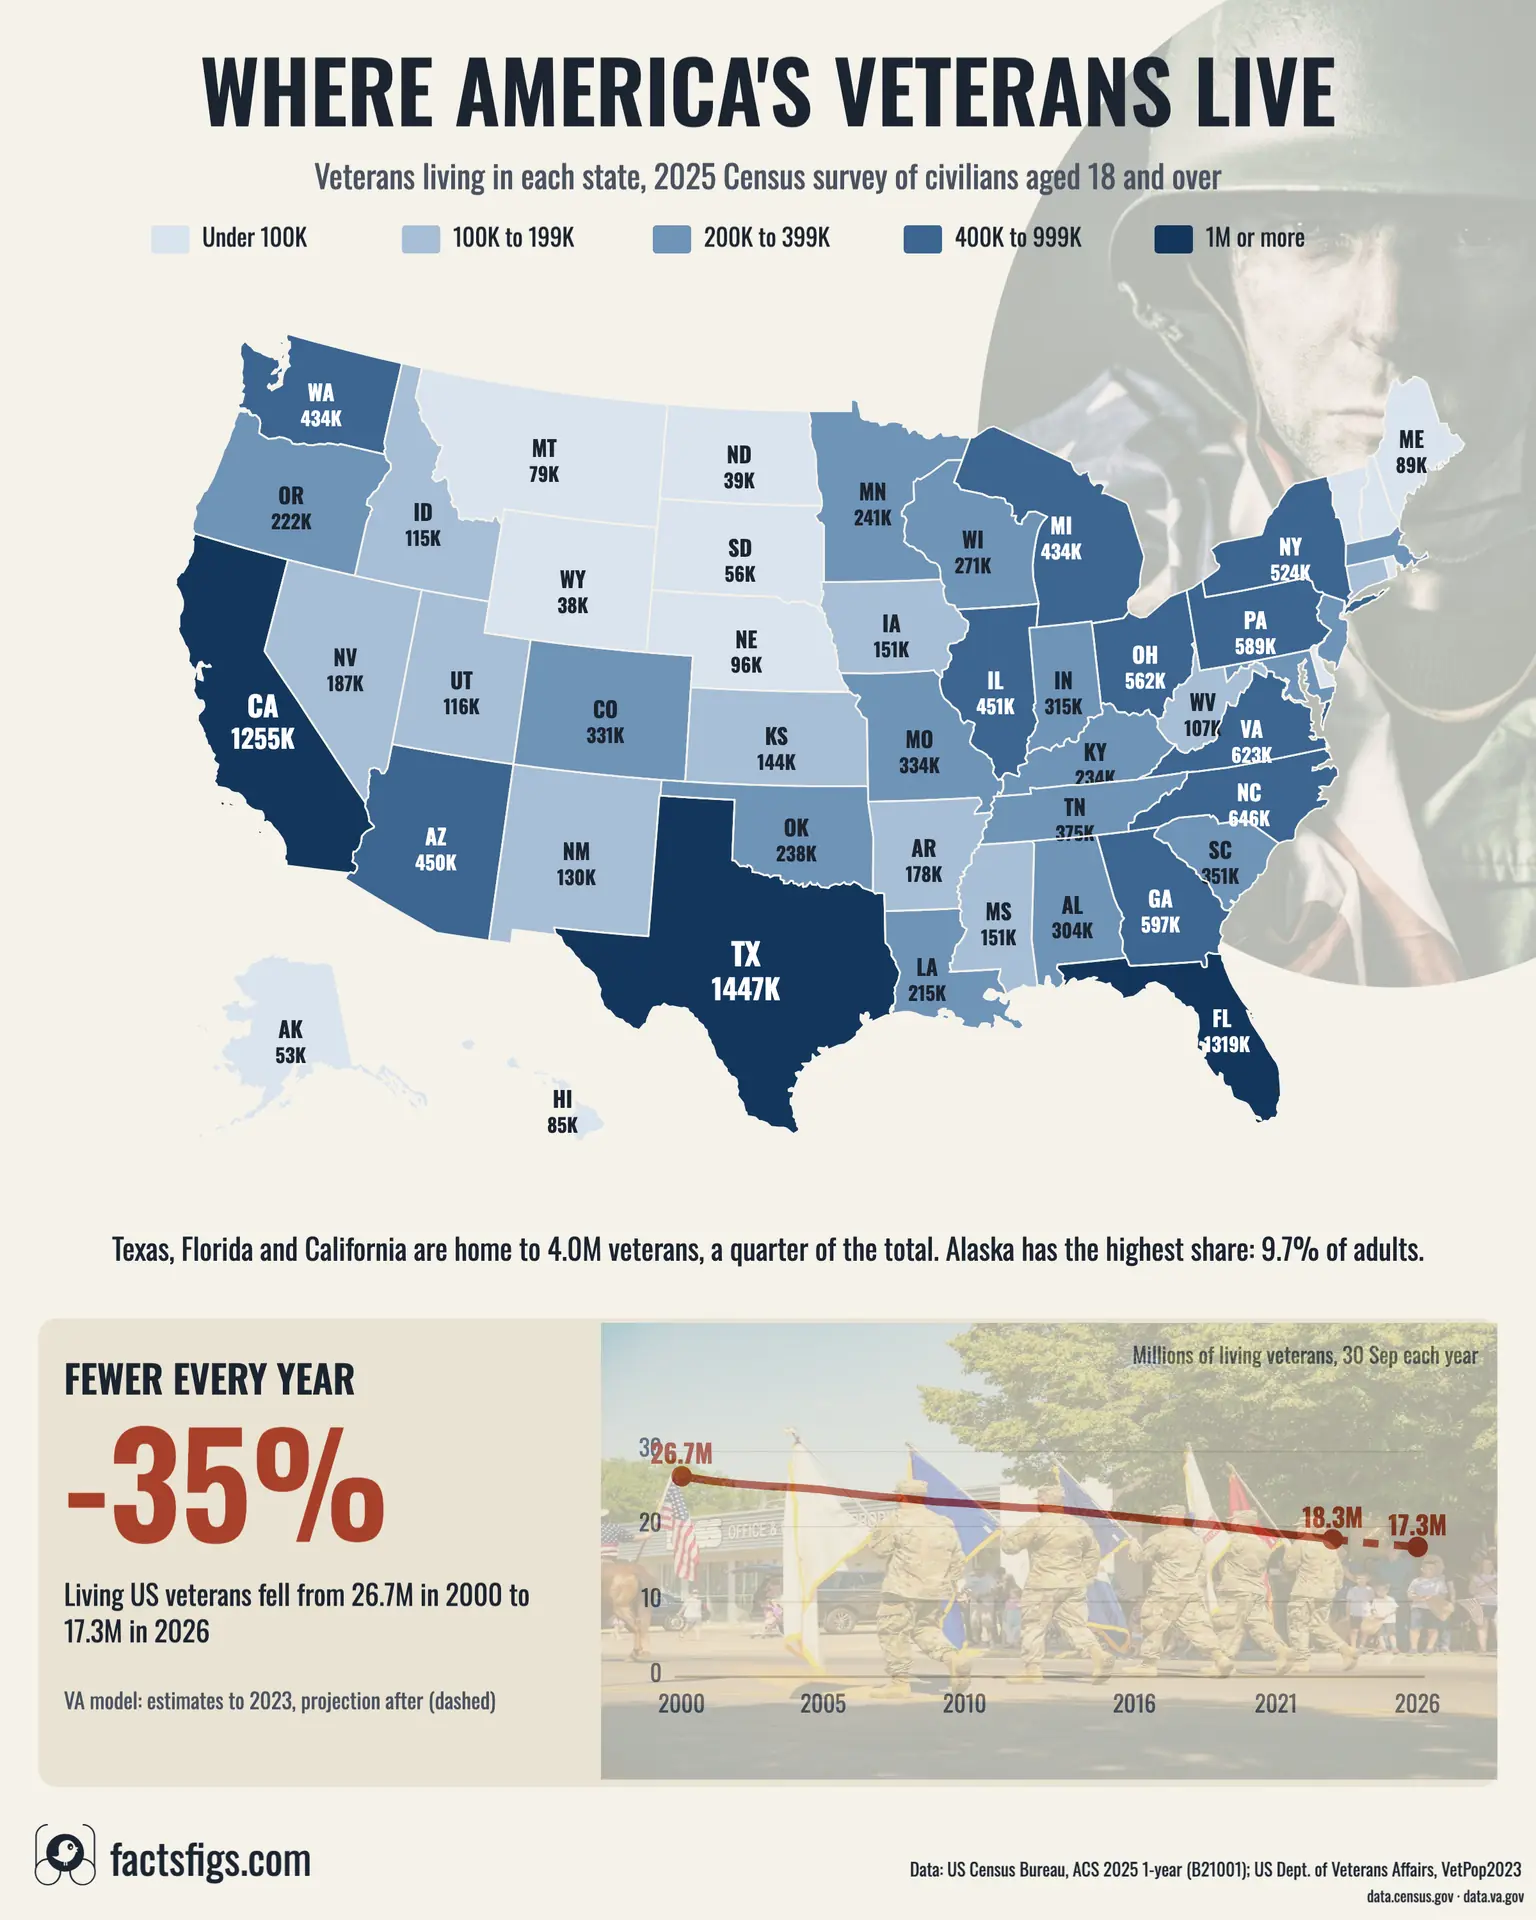
The Census Bureau's 2025 survey counts 15,746,228 civilian veterans in the 50 states and DC, 5.9% of adults. Texas, Florida and California hold 4.0 million of them, but 9.7% of Alaska's adults are veterans against 3.3% in New York.
The VA's VetPop2023 model estimates 26.7 million living veterans in 2000 and projects 17.3 million for 2026, about 362,000 fewer a year.
! Three Things Behind the Map and the Decline:
•
Big States Lead on Count:Texas, Florida and California rank top three partly because they are large; California is 47th by share.
•
Military-Heavy States Lead on Share:In Alaska, Virginia, Montana, Wyoming and South Carolina, 8% or more of adults are veterans.
•
Deaths Outpace New Veterans:The VA model projects 524,569 veteran deaths in fiscal 2025, about 1,437 a day.
? The Figures Behind the Story:
•
Veterans in the 50 states and DC:15.7 million in 2025, Census survey
•
Living veterans nationally:17.3 million in 2026, VA projection
•
Fall since 2000:35%, from 26.7 million, VA model
•
Highest share of adults:Alaska, 9.7%
Veterans were 12.7% of American adults in 2000 and 5.9% in 2025, as the wartime generations pass and a smaller volunteer military replaces fewer of them.
Continue reading below for the full detailed article →
Overview
Two Sources, Two Totals, One Direction
There is no single official count of American veterans. The Census Bureau surveys households every year and publishes state estimates with margins of error; the Department of Veterans Affairs runs a model, built on its own and Defense Department records, that covers every living veteran. The map uses the survey, because it measures where veterans live. The national trend uses the VA model, because it is one consistent series from 2000 to 2026. The two disagree on the level by about 11% and agree on the direction.
Three Numbers That Frame the Veteran Map
How many veterans there are, where they make up the largest share of adults, and how far the national total has fallen.
15.7M Veterans Live in the 50 States and DC
15.7M
The Census Bureau's 2025 survey counts 15,746,228 civilian veterans aged 18 and over, plus or minus 85,315, or 5.9% of the country's 268.8 million civilian adults. Puerto Rico's 62,071 are counted separately.
9.7% of Alaska's Adults Are Veterans
9.7%
Alaska ranks 46th by count, with 53,052 veterans, but first by share. Virginia follows at 9.0%, close enough to be within the survey's margin of error, then Montana at 8.6%.
35% Fewer Living Veterans Than in 2000
35%
The VA's VetPop2023 model estimates 26,662,359 living veterans at 30 September 2000 and projects 17,260,286 for 2026, a fall of 9.4 million, with every year lower than the one before.
Texas by the Numbers
Veterans in Texas 1.45 M1,446,930 in 2025, plus or minus 27,633, the most of any state.
Share of all US veterans 9.2 %About one in eleven of the 15.7 million live in Texas.
Share of Texas adults 6 %6.0%, close to the national 5.9%; Texas ranks 35th by share.
The count
How Many Veterans Are There in the US?
The Census Bureau's answer for 2025 is 15,746,228. That is the number of civilians aged 18 and over in the 50 states and the District of Columbia who told the American Community Survey they had served on active duty in the armed forces and were no longer serving. The survey's margin of error, at 90% confidence, is plus or minus 85,315. Puerto Rico, surveyed separately, adds 62,071 veterans.
The VA's answer is higher. Its VetPop2023 model starts from VA and Defense Department records, blends in census survey data for older ages, and projects 17,587,687 living veterans for 30 September 2025 and 17,260,286 for 30 September 2026, counting those abroad and in the territories too.
Even inside the 50 states and DC the model runs about 11% above the survey, and most of the gap sits among younger veterans: in 2023 the survey found 75% as many veterans under 35 as the model did, but 96% as many aged 65 to 74. Neither the VA nor the Census Bureau says why.
Both measures put veterans at a small and shrinking share of adults. The 2000 census counted 26.4 million civilian veterans, 12.7% of adults. The 2025 survey's 15.7 million is 5.9%.
Where they live
Veteran Population by State: Texas, Florida and California Lead
Texas has the most veterans of any state, 1,446,930 in 2025. Florida has 1,318,557 and California 1,254,746. Together the three hold 4,020,233 veterans, 25.5% of the national total, and they are the only states above a million. Florida has fewer adults than Texas but more veterans per adult, 7.0% against 6.0%, and California the lowest rate of the three, 4.0%. The VA's model puts California 2,819 ahead of Florida, close enough to call a tie.
After the top three the counts fall by half. North Carolina has 646,491, Virginia 623,047, Georgia 596,611 and Pennsylvania 588,783. Georgia and Pennsylvania are within each other's margin of error and cannot be ranked against each other. Ohio (561,908), New York (524,170) and Illinois (450,893) complete the top ten, with Arizona 11th at 449,601, a gap to Illinois well inside the margin.
A count map is mostly a population map: Texas, Florida and California are also the three most populous states. The smallest counts belong to the District of Columbia (19,902), Vermont (33,009), Wyoming (37,969), North Dakota (39,118) and Rhode Island (42,095).
Share of adults
Which States Have the Highest Share of Veterans?
Measured against each state's adults, the order changes. Alaska leads at 9.7%, with 53,052 veterans among 545,864 civilian adults. Virginia follows at 9.0%, then Montana at 8.6%, Wyoming at 8.2% and South Carolina at 8.0%. Alaska's lead over Virginia is about the size of the survey's margin of error, and Montana and Wyoming overlap, so the top five read better as a group than as a strict order.
South Dakota and New Mexico (7.8%) and Hawaii (7.7%) come next. Virginia is the only state in the top five by both count and share.
The lowest shares are in the Northeast and in California: New York at 3.3%, New Jersey 3.4%, the District of Columbia 3.5%, Massachusetts 3.8% and California 4.0%. New York still has the ninth largest number of veterans, 524,170, because it has so many adults.
Puerto Rico is not on the map, which covers the 50 states and DC. Its 62,071 veterans are 2.3% of its adults, lower than any state.
All 51, by count
Veterans in Every State and DC, 2025
Civilian veterans aged 18 and over in each state, the survey's margin of error, veterans as a share of civilian adults and each state's rank on both measures, sorted by number of veterans.
Texas
1,446,930
27,633
6.0%
1
35
Florida
1,318,557
26,118
7.0%
2
20
California
1,254,746
19,955
4.0%
3
47
North Carolina
646,491
13,461
7.4%
4
15
Virginia
623,047
12,315
9.0%
5
2
Georgia
596,611
15,407
6.8%
6
24
Pennsylvania
588,783
12,604
5.6%
7
40
Ohio
561,908
14,109
6.0%
8
37
New York
524,170
10,699
3.3%
9
51
Illinois
450,893
9,624
4.5%
10
45
Arizona
449,601
12,187
7.5%
11
13
Washington
434,198
12,552
6.9%
12
22
Michigan
433,589
9,966
5.4%
13
41
Tennessee
375,004
10,155
6.5%
14
27
South Carolina
350,835
9,964
8.0%
15
5
Missouri
334,269
8,929
6.8%
16
23
Colorado
331,110
9,726
7.0%
17
19
Maryland
321,975
9,965
6.6%
18
26
Indiana
315,178
10,467
5.8%
19
38
Alabama
304,284
9,425
7.5%
20
12
Showing 1-20 of 51
Page 1 of 3
Download this data (CSV)Source: US Census Bureau, 2025 American Community Survey 1-year estimates, table B21001, a US government work with no copyright. Shares and ranks derived by FactsFigs. Free to use with credit to the US Census Bureau and FactsFigs.
Margins of error are at the 90% confidence level. Ranks that sit within each other's margins, such as Georgia and Pennsylvania by count or Alaska and Virginia by share, are not statistically distinct. The October to November 2025 funding lapse interrupted survey collection, which the Census Bureau says reduced the sample and widened margins.
The decline
Why Are There Fewer Veterans Every Year?
The short answer is arithmetic. In its VetPop2023 model the VA projects 524,569 veteran deaths in fiscal 2025, the year to 30 September 2025, about 1,437 a day. The model's total falls by 333,554 over the same year, which implies roughly 191,000 people became veterans. Deaths outnumber new veterans by about 2.7 to 1.
The Defense Department's estimate of the inflow is close: more than 200,000 service members, including reservists, move from active duty to civilian life each year, according to a June 2024 Congressional Research Service report.
In the VA's series the total is lower in every year than the one before, from fiscal 2001 to the projected fiscal 2026. The fall was largest at the start, 574,273 in fiscal 2001, and has narrowed since; the model has it at 327,401 in fiscal 2026. The Census survey shows the same direction with one blip: its 2025 count is 44,982 above 2024, a difference well inside the survey's margin of error. The death figures are the model's projections from its 2023 base, not recorded counts.
Who is passing
The Wartime Generations Are Getting Older
The veterans dying now are mostly the large cohorts of the mid-twentieth century. The 2000 census counted roughly 5.7 million Second World War veterans; the 2025 survey finds about 41,600. Korean War veterans fell from roughly 4.0 million to about 367,000 over the same years. Vietnam-era veterans, the largest wartime group in 2000 at about 8.4 million, numbered about 4.9 million in 2025.
Age follows from that. In the 2025 survey 49.7% of veterans were 65 or older and 30.5% were 75 or older. The VA's model puts the 65-and-over share at 45.8% for fiscal 2025, up from 35.9% in 2000, and keeps deaths above 500,000 a year through fiscal 2027 as Vietnam-era veterans move past 75.
The largest group now is the Gulf War era: everyone who has served since August 1990, including in Afghanistan and Iraq. The VA's model counts 9.1 million of them in fiscal 2025, 51.8% of all living veterans. Service eras overlap, since one person can serve in more than one, so these groups cannot be added together.
Supply
A Smaller Volunteer Military Makes Fewer Veterans
Veterans come from people who served, and fewer people serve. The last draft calls went out in December 1972, Defense Secretary Melvin Laird announced the end of conscription on 27 January 1973, and the authority to induct expired on 30 June 1973, according to the Congressional Research Service. The military has been all volunteer since.
It has also become smaller. Active-duty end strength was 2,198,687 in fiscal 1973 and 2,163,578 in fiscal 1987, the high point of the 1980s, according to Defense Department figures compiled from Defense Manpower Data Center records. It was 1,370,678 in fiscal 2000 and 1,273,382 in fiscal 2023, 41.1% below the 1987 level.
A force of about 1.3 million, with around 200,000 leaving active duty in a year, cannot replace generations that passed through a draft-era military of more than 2 million. That link is FactsFigs' reading of the numbers: the sources give the force sizes and the dates, not the causation.
The national line
Living US Veterans by Year, 2000 to 2026
Living veterans at 30 September of each fiscal year in the VA's VetPop2023 model, the change from the year before, and whether each figure is a model estimate or a projection.
2000
26,662,359
—
Model estimate
2001
26,088,086
-574,273
Model estimate
2002
25,734,833
-353,253
Model estimate
2003
25,355,457
-379,376
Model estimate
2004
25,155,753
-199,704
Model estimate
2005
24,920,058
-235,695
Model estimate
2006
24,410,497
-509,561
Model estimate
2007
23,983,724
-426,773
Model estimate
2008
23,696,461
-287,263
Model estimate
2009
23,311,035
-385,426
Model estimate
2010
23,140,644
-170,391
Model estimate
2011
22,826,992
-313,652
Model estimate
2012
22,508,562
-318,430
Model estimate
2013
22,366,012
-142,550
Model estimate
2014
22,024,152
-341,860
Model estimate
2015
21,570,586
-453,566
Model estimate
2016
21,222,131
-348,455
Model estimate
2017
20,827,295
-394,836
Model estimate
2018
20,539,173
-288,122
Model estimate
2019
20,125,216
-413,957
Model estimate
Showing 1-20 of 27
Page 1 of 2
Download this data (CSV)Source: US Department of Veterans Affairs, VetPop2023 National Estimates 2000 to 2023 (data.va.gov, CC0 1.0) and VetPop2023 Table 1L projections, US government works. Year-on-year change derived by FactsFigs. Free to use with credit to the VA and FactsFigs.
Fiscal years end on 30 September. Figures to 2023 are model estimates; 2024 to 2026 are projections from the 2023 base and will change when the VA publishes a newer model. Counts include veterans living abroad and in the territories.
What comes next
How Many Veterans Will There Be in 2050?
The VA's model expects the decline to continue at a slowing pace: 13,363,515 living veterans in fiscal 2040 and 11,573,129 in fiscal 2050, an average fall of 1.6% a year over its 30-year horizon. The projection rests on assumptions about how many people will leave the military and how long veterans will live, so it is a planning estimate, not a certainty.
Women are the one group the model holds roughly steady, at about 2.1 million. The 2000 census counted 1,593,254 women veterans, 6.0% of the total; the 2025 survey counts 1,788,236, or 11.4%. Because the number of men keeps falling, the VA projects women will be 18.7% of veterans by fiscal 2053.
How to read these numbers
What the Survey and the Model Can and Cannot Tell You
The map uses the 2025 American Community Survey, released on 29 October 2026, about six weeks late after the October to November 2025 funding lapse cut its sample. Only 2 of the 51 state figures differ from 2024 by more than their margin of error, so the counts show no sign of a problem, but they cannot show that any one state gained or lost veterans in a year.
Veterans abroad and in Guam, the US Virgin Islands, American Samoa and the Northern Mariana Islands are outside the survey; the VA's model counts 94,419 of them together for fiscal 2025.
The national line is the VA's model, not a head count. Values to fiscal 2023 are estimates and 2024 to 2026 are projections, drawn dashed until the VA publishes a newer model. The line's 17.3 million and the map's 15.7 million measure different populations and are not meant to match.
The data behind this story comes from the US Census Bureau's 2025 American Community Survey 1-year estimates (table B21001, Sex by Age by Veteran Status) for the state map and table, and the Department of Veterans Affairs' VetPop2023 model for the national trend, deaths and projections. Age and service-era figures come from the same two sources, active-duty strength from the Defense Department's Office of People Analytics, and the draft dates and transition estimate from Congressional Research Service reports. All are US government works, and full credit for collecting and maintaining the data goes to the Census Bureau and the VA.
FactsFigs reviews, cleans, and cross-checks every source dataset before shaping it into a data story. Each visualization is created and designed in FactsFigs Design Studio, an internal tool developed and owned by FactsFigs, and is the original work of a FactsFigs author, not an AI-generated copy of any existing graphic. Individual assets within a visual may or may not be produced with AI tools, but the design of the visual itself is solely FactsFigs' own.
Figures are estimates at the time of publication, provided for information only. Nothing here is financial advice or a guarantee of accuracy.
Last verified: 12 Nov 2026
The charts in this article were built with our own publishing system. See what it does →