Which Country Drinks the Most Coffee?



Facts & Figures
Visual Intelligence
TL;DR: Which Country Drinks the Most Coffee Per Person?
The published answer is Hong Kong at 43.2 kg a person a year. The believable answer is a cluster of countries around 11 kg, and Finland is 24th.
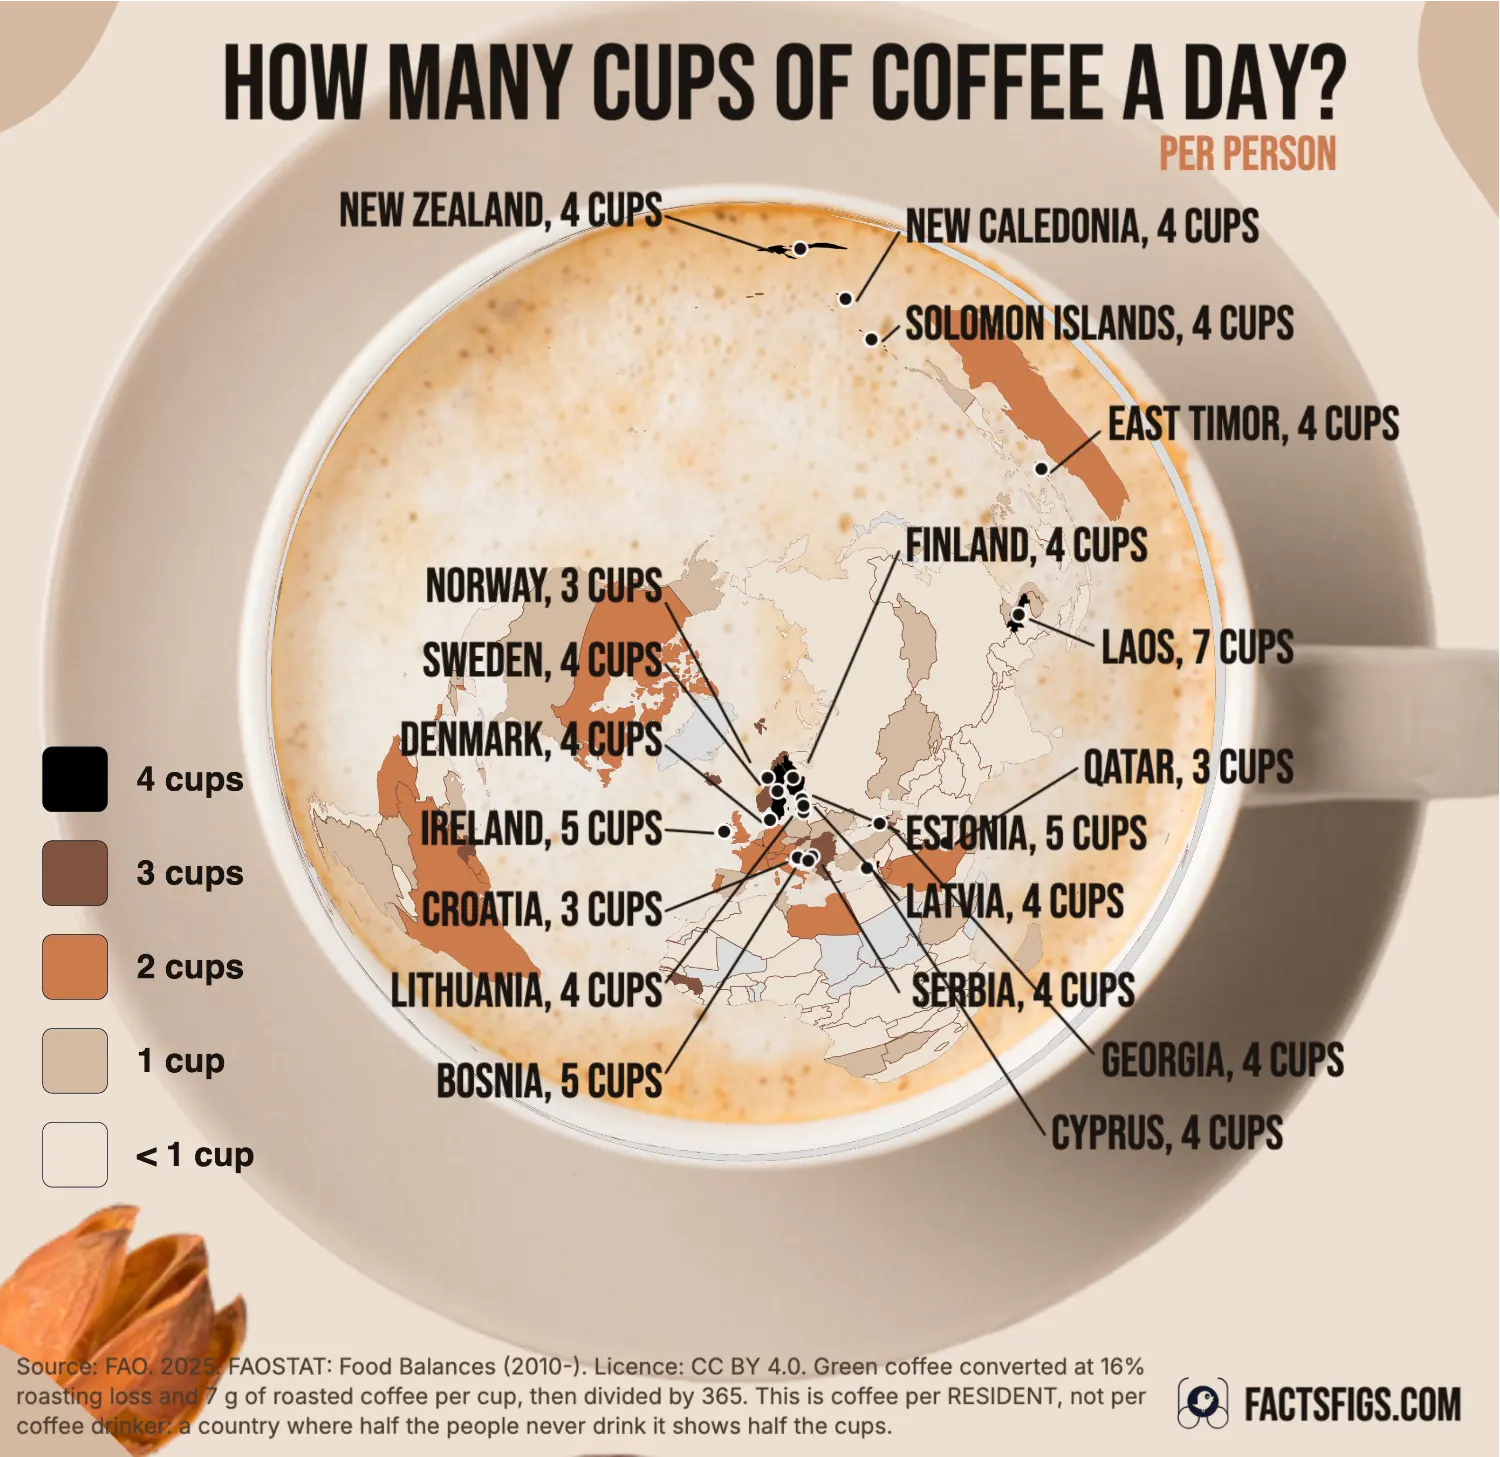
FAO food balance sheets are the only global, openly licensed source for coffee consumption per person. For 2023 they rank Hong Kong first at 43.2 kg of green coffee per resident, then Laos at 22.6, the Maldives at 20.7 and Luxembourg at 19.0. Finland, the country almost every article names, is 24th of the 161 countries with a continuous series, at 10.8 kg. The measure is coffee entering a country divided by the people living there, which counts commuters, tourists and cargo that moves on as residents drinking.
! What the numbers actually show:
- • The published number one: Hong Kong, at 43.2 kg of green coffee a resident in 2023. That is 28 times the world average, and about 14 cups a day for every person living there, infants included.
- • Why that is not drinking: Hong Kong's coffee imports jumped from 152,000 tonnes in 2022 to 420,000 in 2023 while exports stayed near 39,000. Per person the figure went from 14.0 kg to 43.2 in twelve months. No change in habit does that.
- • The most consistent leader: Luxembourg has the highest 14 year average of any country, 24.2 kg, on about 685,000 residents. STATEC counts 47% of everyone working there as commuting in from France, Germany or Belgium.
- • Where Finland actually ranks: 24th of the 161 countries with a continuous series, at 10.8 kg a person, roughly three and a half cups a day. It has never been first in this dataset in any year since 2010.
? The figures that hold up:
- • World average: 1.55 kg a person a year, about one cup every other day
- • Countries whose series holds up: Eleven, in a band from 10.6 to 15.7 kg a person
- • United States: 4.2 kg a person, 67th, about 1.4 cups a day
- • Countries under one cup a day: 67 of the 176 on the map
A per person consumption figure is an accounting identity, not a survey. Nobody asked anyone how much coffee they drink. The number is coffee that crossed a border, minus coffee that crossed back out, divided by the resident population, and the top of the table is where those three quantities disagree most.
Continue reading below for the full detailed article →
Overview
What a Coffee Consumption Figure Actually Measures
There is no global survey of coffee drinking. What exists is a balance sheet. FAO takes everything a country produced, add everything it imported, subtract what it exported and what went to stocks, and what remains is treated as available for people to eat or drink. Divide by the resident population and you have kilograms per person. The arithmetic is sound. The assumption underneath it is that the people who live in a country are the people who consume what arrives in it, and for small, open, heavily visited or heavily transited economies that assumption fails. The figures are green bean equivalent, so a kilogram here is unroasted coffee: roasting removes roughly a sixth of the weight, and at seven grams of roasted coffee a cup, one kilogram of green beans makes about 120 cups. Every 2023 value in this dataset carries FAO estimate flag E, meaning FAO modelled it rather than receiving it from the country.
The Published Ranking
Which Countries Top the Official Coffee Table?
For 2023 the order is Hong Kong 43.2 kg, Laos 22.6, the Maldives 20.7, Luxembourg 19.0, Macao 16.8, Ireland 15.8, Estonia 15.7, Antigua and Barbuda 14.4, Bosnia and Herzegovina 14.3 and Lithuania 13.4. Four of those ten have fewer than a million residents. Two are special administrative regions whose trade is overwhelmingly transit. One, Laos, grows coffee rather than importing it, and its series nearly triples between years.
None of the Nordic countries appears. Denmark is 20th, Sweden 23rd, Finland 24th and Norway 26th. Iceland, named in almost every article on this subject, is 7.9 kg and 40th. If the published ranking were a ranking of drinkers, the best known fact about coffee drinking in the world would be wrong, and it is not: the Nordic figures are stable, plausible and roughly where every other source puts them. It is the countries above them that do not belong.
Luxembourg
Why Does Luxembourg Keep Coming First?
Across all 14 years Luxembourg has the highest average of any country, 24.2 kg a person, and it was the single highest country in nine of the fourteen years. It has roughly 685,000 residents. According to STATEC, the national statistics office, 47% of the 485,000 people employed in Luxembourg in May 2024 commute in from France, Germany or Belgium every working day.
Those commuters buy coffee in Luxembourg, where it is cheaper, and carry it home. Nothing in a food balance sheet records that. The coffee is logged as an import and never logged as an export, so it lands entirely on the 680,000 residents. The same mechanism explains the country's position in fuel and tobacco statistics, where it is a well known artefact. Coffee is the same effect, less often noticed.
Hong Kong
Did Hong Kong Really Start Drinking Three Times More Coffee?
No. In 2022 Hong Kong imported 152,000 tonnes of green coffee and exported 26,000. In 2023 it imported 420,000 tonnes and exported 39,000. Domestic supply tripled, and because the resident population did not, consumption per person went from 14.0 kg to 43.2 kg in twelve months. There is no plausible change in behaviour that does this.
What is plausible is coffee moving onward without being recorded as a Hong Kong export. Mainland China's own figure for 2023 is 0.2 kg a person on a population of 1.4 billion, and its coffee market has been growing quickly. A step change of this size in one year, in one direction, in a port economy, is a trade accounting event. It is included in the chart because it is what the published data says, and marked red because it is not what it appears to say.
Tourists and Small Denominators
Why Do Holiday Islands Rank So High for Coffee?
The Maldives is third at 20.7 kg on about 531,000 residents, and receives roughly two million visitors a year. FAO does record a separate tourist consumption line, 1,000 tonnes against 11,000 tonnes of food use, but at that scale any shortfall in the split lands hard on a small population. Antigua and Barbuda, with about 70,000 residents, is eighth, and its series swings eightfold between its highest and lowest years.
Small populations make the arithmetic fragile in a second way. A single shipment that arrives in December rather than January can move a country several places. That is why the chart marks every country with under a million residents, regardless of how its number looks, and why a stable series matters more than a high one.
The Believable List
So Which Countries Really Drink the Most Coffee?
Take the countries with more than a million residents whose highest year is less than 1.5 times their lowest across 14 years, and the picture settles down. Estonia leads at 15.7 kg, then Bosnia and Herzegovina 14.3, Lithuania 13.4, New Zealand 12.8, Cyprus 12.1, Denmark 11.7, Sweden 10.9, Finland 10.8, Bulgaria 10.6, Norway 10.6 and Slovakia 10.6. Most of the familiar names are there, in a tight band between 10 and 13 kg, which is about three to four cups a day.
Two cautions. Estonia and Lithuania sit above the Nordics here, and both are transit routes to larger neighbours, so part of their figure may be the Luxembourg effect in slower motion. And stability is not accuracy: a country whose statistics are consistently wrong in the same direction will look stable. What this filter removes is the figures that move too fast to be about habits. What it cannot do is confirm the ones that remain.
The Full Ranking
Coffee Per Person, Top 20 Countries, 2023
Kilograms of green coffee available per resident, the 14 year average, how far the series swings, and the resident population implied by the dataset itself.
| 1 | Hong Kong | 43.2 | 14.20 | 13.5 | 4.70x | 7.45 | Series more than doubles between years |
| 2 | 🇱🇦 Laos | 22.6 | 7.43 | 18.8 | 2.81x | 7.66 | Series more than doubles between years |
| 3 | 🇲🇻 Maldives | 20.7 | 6.81 | 22.4 | 2.08x | 0.53 | Under 1 million residents |
| 4 | 🇱🇺 Luxembourg | 19.0 | 6.25 | 24.2 | 1.49x | 0.68 | Under 1 million residents |
| 5 | Macao | 16.8 | 5.52 | 12.2 | 1.85x | 0.71 | Under 1 million residents |
| 6 | 🇮🇪 Ireland | 15.8 | 5.19 | 8.5 | 2.74x | 5.19 | Series more than doubles between years |
| 7 | 🇪🇪 Estonia | 15.7 | 5.16 | 15.2 | 1.37x | 1.34 | Stable for 14 years |
| 8 | 🇦🇬 Antigua and Barbuda | 14.4 | 4.73 | 7.0 | 7.98x | 0.07 | Under 1 million residents |
| 9 | 🇧🇦 Bosnia and Herzegovina | 14.3 | 4.70 | 11.8 | 1.49x | 3.16 | Stable for 14 years |
| 10 | 🇱🇹 Lithuania | 13.4 | 4.41 | 14.4 | 1.37x | 2.84 | Stable for 14 years |
| 11 | 🇱🇧 Lebanon | 12.9 | 4.24 | 13.3 | 1.55x | 5.81 | Series swings more than 1.5x |
| 12 | 🇵🇫 French Polynesia | 12.9 | 4.24 | 10.1 | 1.61x | 0.31 | Under 1 million residents |
| 13 | 🇳🇿 New Zealand | 12.8 | 4.21 | 11.9 | 1.47x | 5.15 | Stable for 14 years |
| 14 | 🇹🇱 Timor-Leste | 12.6 | 4.14 | 10.2 | 2.42x | 1.35 | Series more than doubles between years |
| 15 | 🇬🇪 Georgia | 12.5 | 4.11 | 9.4 | 1.67x | 3.83 | Series swings more than 1.5x |
| 16 | 🇳🇨 New Caledonia | 12.2 | 4.01 | 11.9 | 1.70x | 0.33 | Under 1 million residents |
| 17 | 🇱🇻 Latvia | 12.2 | 4.01 | 10.7 | 1.81x | 1.89 | Series swings more than 1.5x |
| 18 | 🇷🇸 Serbia | 12.2 | 4.01 | 10.8 | 2.32x | 6.75 | Series more than doubles between years |
| 19 | 🇨🇾 Cyprus | 12.1 | 3.98 | 12.0 | 1.44x | 1.33 | Stable for 14 years |
| 20 | 🇩🇰 Denmark | 11.7 | 3.85 | 12.2 | 1.25x | 5.91 | Stable for 14 years |
Green bean equivalent. Cups a day converts at 16% roasting loss and 7 g of roasted coffee per cup, then divides by 365; it is cups per RESIDENT, not per coffee drinker. Residents are derived by dividing total food use by consumption per person, which is the population FAO itself used. Assessment is calculated by FactsFigs from the swing in each series and the resident population, not by FAO. The download covers the top 40. Source: FAO. 2025. FAOSTAT: Food Balances (2010-). Licence: CC BY 4.0.
The Finland Claim
Is It True That Finland Drinks the Most Coffee in the World?
Not in this dataset, in any year since 2010. Finland's best placing in any year is fifth, in 2011, and in 2023 it is 24th at 10.8 kg. The claim usually traces to International Coffee Organization figures, which are not openly licensed and cost 250 pounds per dataset, so most articles repeat a number they have not seen. Where ICO figures have been quoted publicly they also put Luxembourg at the top, around 24 kg, for the same cross border reason.
The explanation offered for Finland is often that the law guarantees workers two coffee breaks. That is not right either. Finland's Working Hours Act guarantees a meal break. Coffee breaks are set by sector collective agreements, which typically allow one on a shift of four hours or more, with the length agreed at each workplace and usually 10 to 15 minutes. The coffee break is a real and protected part of Finnish working life. It is a matter of negotiated agreements, not statute.
Data Source and Attribution
FAO FAOSTAT Food Balances (2010-), CC BY 4.0 STATEC, Luxembourg labour market, May 2024 PAM (Finnish Service Union United), work breaks International Coffee Organization, historical data terms
The data behind this story is FAO. 2025. FAOSTAT: Food Balances (2010-). Accessed 4 November 2026. Licence: CC BY 4.0. Full credit for collecting and maintaining it goes to the Food and Agriculture Organization of the United Nations. FactsFigs extracted the Coffee and products item, took the food supply quantity in kilograms per person per year, calculated the 14 year average and the ratio of each country’s highest year to its lowest, and derived resident population by dividing total food use by consumption per person. The assessment column is FactsFigs’ own and is not part of the FAO dataset. All 2023 values carry FAO’s estimate flag.
FactsFigs reviews, cleans, and cross-checks every source dataset before shaping it into a data story. Each visualization is created and designed in FactsFigs Design Studio, an internal tool developed and owned by FactsFigs, and is the original work of a FactsFigs author, not an AI-generated copy of any existing graphic. Individual assets within a visual may or may not be produced with AI tools, but the design of the visual itself is solely FactsFigs’ own.
Figures are estimates at the time of publication, provided for information only, nothing here is financial advice or a guarantee of accuracy.
Last verified: 4 Nov 2026
Related Publications
More from FactsFigs
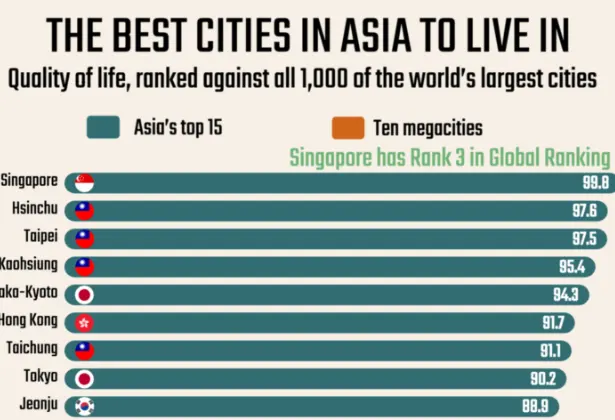
Best Cities in Asia for Quality of Life: Not the MegaCities
Singapore is 3rd of 1,000 world cities for quality of life. Taiwan and Korea take five of Asia's top 15 each; no megacity comes close.
29 Oct 2026
Is the World Running Out of Babies? Births Per Woman, by Country
The world is at 2.25 births per woman and still above replacement. Half of its sizeable countries are not.
29 Oct 2026
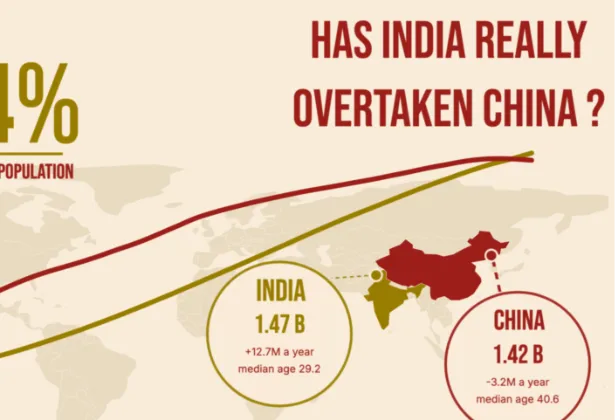
Population: Has India Really Overtaken China?
India passed China in 2022 by 243,647 people, not in 2023. Neither country has counted itself recently enough to be sure.
28 Oct 2026
The Cheapest Renewable Electricity Source: It Isn't Solar
Onshore wind makes the cheapest new renewable power at $33/MWh. Solar fell 89% since 2010 and still finishes second.
28 Oct 2026