TL;DR: Do World Cup Hosts Really Get a Home Advantage?
Yes, a large one, though it has faded
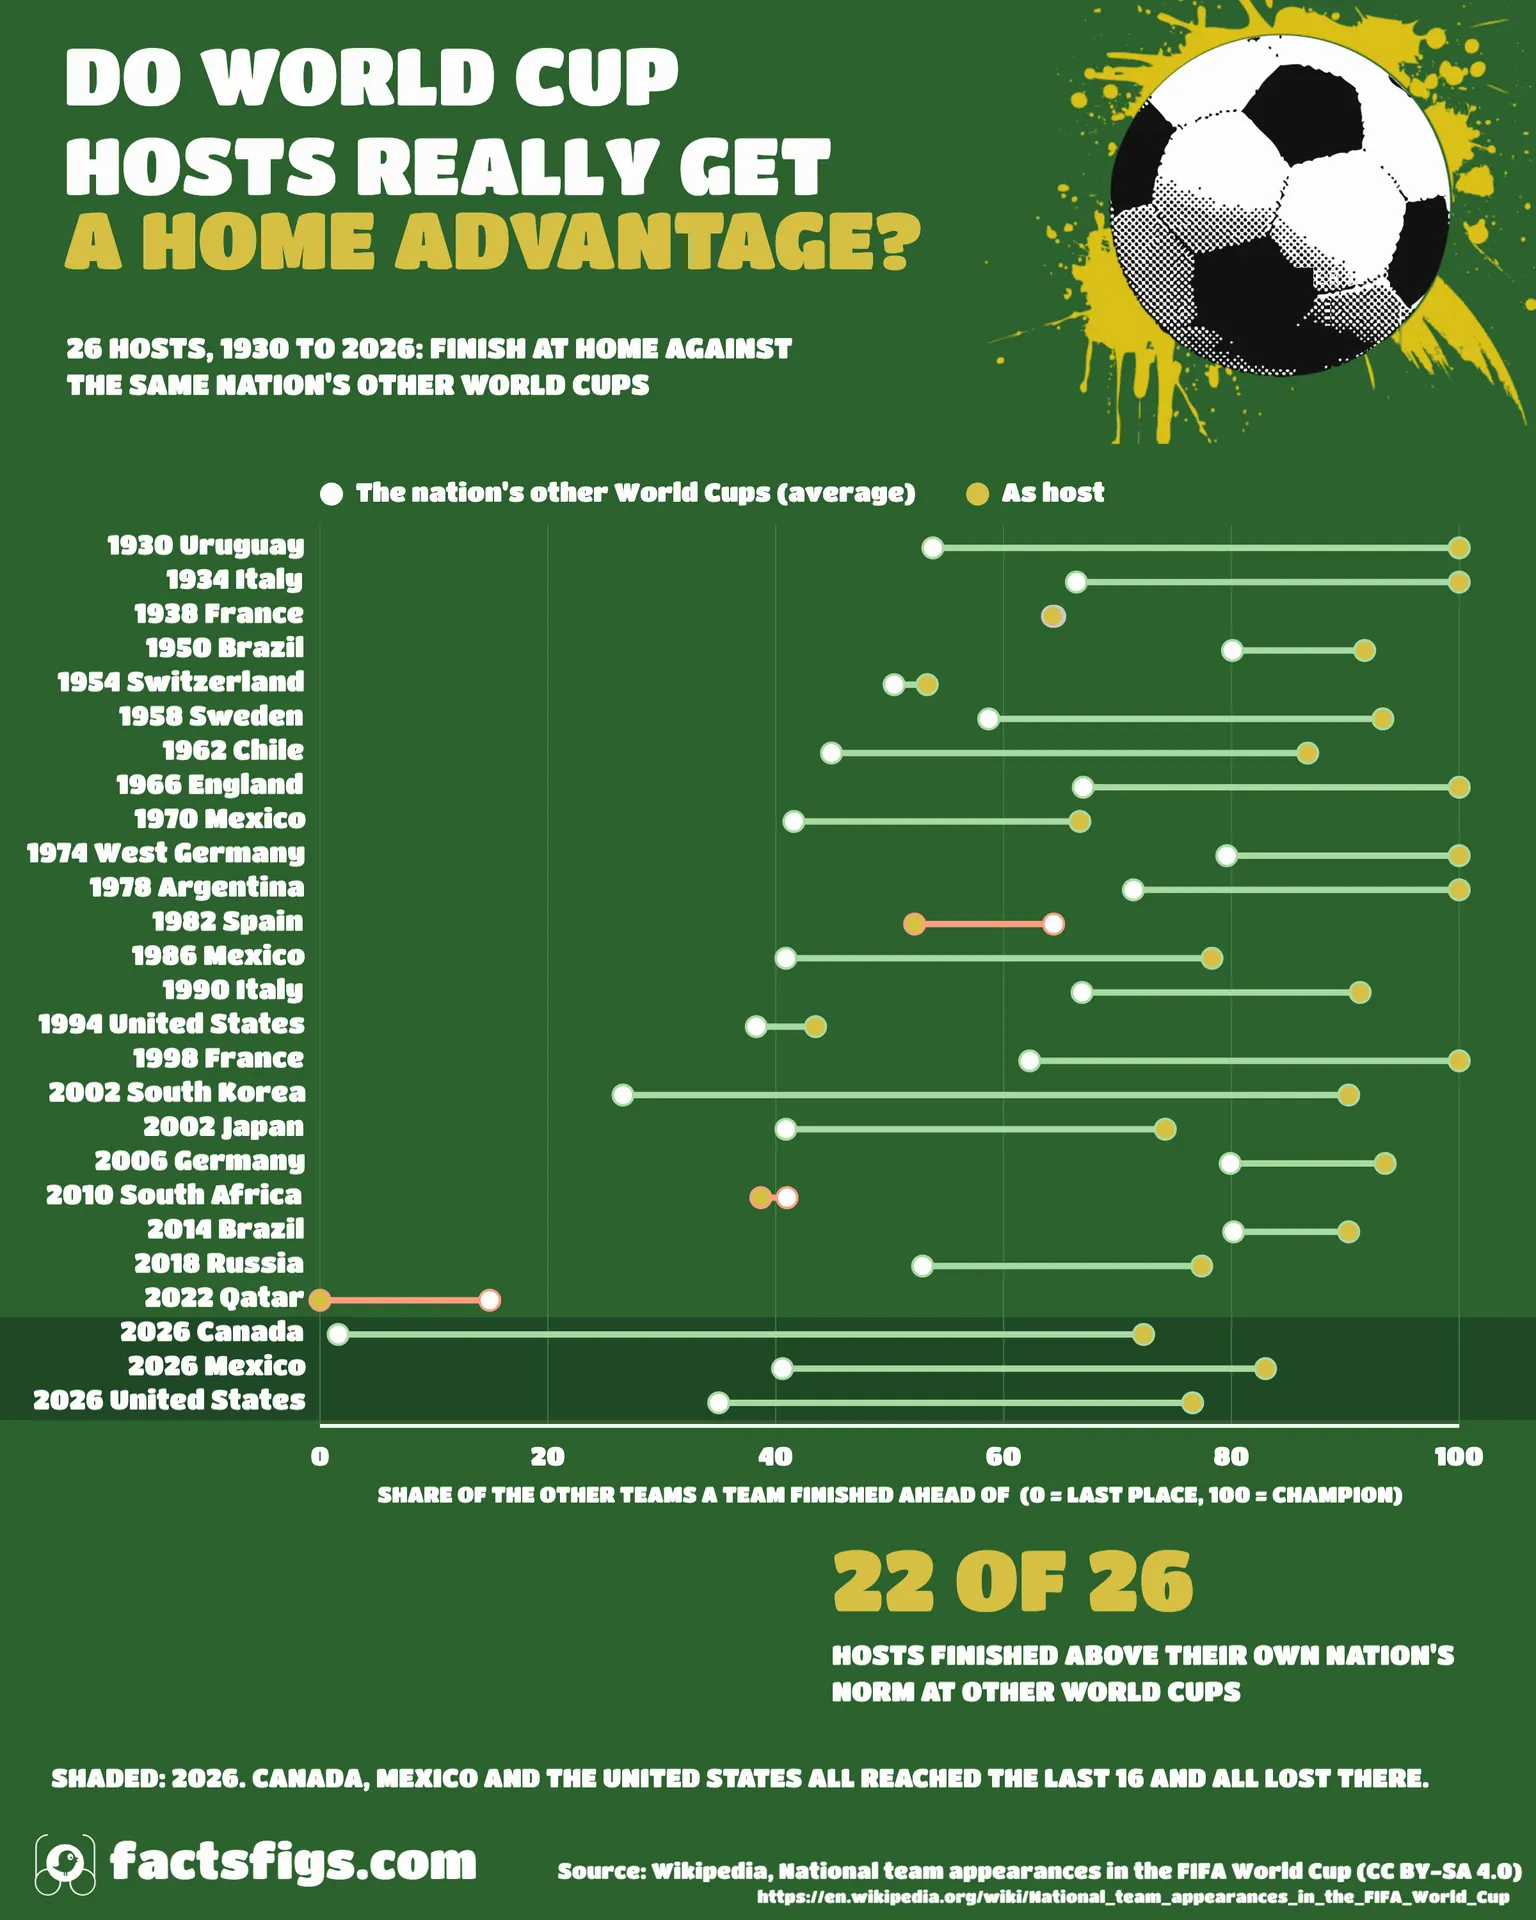
Across the 26 host entries from 1930 to 2026, hosts finished ahead of 78% of the other teams on average. The same nations managed 52% at their other World Cups. Twenty-two of the 26 hosts did better at home than their own norm, and hosts won the title in 6 of 26 entries, 23%, against 7.5% for the same nations elsewhere.
The edge has shrunk. From 1998 to 2022 only France won as host, and South Africa and Qatar went out in the group stage. In 2026 Canada, Mexico and the United States all reached the last 16 and all lost there.
The data shows that hosts do better, not why.
! What the Data Shows:
•
Hosts Beat Their Own Norm:22 of 26 finished above the same nation at other World Cups.
•
Hosts Win More Often:6 titles in 26 entries, against 17 in 226 elsewhere.
•
The Edge Has Narrowed:One host win in 8 entries from 1998 to 2022.
? Key Numbers:
•
Host Finish, on Average:Ahead of 78% of teams, against 52% elsewhere
•
Host Title Rate:23% against 7.5%
•
2026 Hosts, Group Stage:2.11 points a match against 1.31
•
2026 Hosts, Knockouts:All three out in the last 16
A host nation does much better than its usual self, and the pattern holds across 26 entries and 96 years. The gap is smaller since 1998, and 2026 shows the edge as a lift to the last 16 rather than a trophy. The data cannot say whether crowds, travel, climate or a friendly draw is behind it.
Continue reading below for the full detailed article →
Overview
Six of Eight Champions Won at Home
Six of the eight World Cup winners won the trophy at home. The fact is repeated whenever a host nation qualifies, and it sounds like proof of a home advantage. It is not quite proof, because hosts have mostly been big football nations that would have done well anyway. This post asks a fairer question: did each host do better at home than the same country did at its other World Cups? It compares all 26 host entries from 1930 to 2026, including the three 2026 hosts, which all went out in the last 16.
Three Numbers Behind the Host Edge
The comparison with a nation's own record, the title rate and the 2026 group stage show the size of the edge and where it ended.
85%: Hosts Above Their Own Norm
85%
Twenty-two of the 26 host teams finished ahead of a larger share of the field than the same nation did at its other World Cups. Hosts averaged 78% of the other teams beaten, against 52% for those nations elsewhere. Only four did worse: France in 1938, Spain in 1982, South Africa in 2010 and Qatar in 2022.
23%: Host Title Rate
23%
Across the 19 host nations, hosts won the World Cup in 6 of 26 host entries, 23.1%. The same nations won 17 titles in 226 other appearances, 7.5%. That is about three times the rate, though a few big nations lift it. The six host titles came in 1930, 1934, 1966, 1974, 1978 and 1998.
2.11: 2026 Hosts, Points Per Group Match
2.11
Canada, Mexico and the United States took 19 points from nine group matches, 2.11 each. The other 45 teams took 177 from 135, 1.31 each. Mexico won all three games without conceding a goal. All three hosts then reached the last 16 and lost there, so the group-stage edge did not carry through.
The Host Edge by the Numbers
26 Host EntriesFrom Uruguay in 1930 to three hosts in 2026.
13 Home Matches in 2026Won 8, drew 1 and lost 4.
1 Host Win From 1998 to 2022France in 1998, in 8 host entries.
The Fair Test
A Fair Test Needs the Same Nation Twice
Hosts are not average teams. Brazil, Italy, Germany, France, England and Argentina have all hosted, and they would do well anywhere. So the comparison here is each host against itself: its finish as host, and its average finish at every other World Cup it played.
A finish is measured as the share of the other teams in the tournament that the team finished ahead of, using FIFA's tournament ranking. The champion scores 100 and last place 0. That puts a 13-team field in 1930 and a 48-team field in 2026 on one scale, which is why the post compares each nation only with itself.
The Record
Hosts Beat Their Own Norm 22 Times in 26
The 26 hosts averaged a finish ahead of 78% of the other teams. The same nations averaged 52% at their other World Cups. Twenty-two hosts did better at home, four did worse, and the average gap is 25 points. Before 2026 the split was 19 to 4.
Four hosts finished below their norm. France in 1938 was within a point of it, and South Africa in 2010 was 2 points below. Spain in 1982 was 12 points below after a second-round exit, and Qatar in 2022 was 15 below, last of 32 teams. A split of 22 to 4 would come up about once in 2,000 tries if home or away made no difference.
The Titles
Hosts Win the Cup at Three Times the Rate
Six hosts have won the tournament: Uruguay in 1930, Italy in 1934, England in 1966, West Germany in 1974, Argentina in 1978 and France in 1998. That is 6 of 26 host entries, 23.1%. The same 19 nations won 17 titles in 226 other appearances, 7.5%.
Brazil lost the 1950 final and the 2014 semi-final at home, and Spain went out in the second round in 1982, so hosting is not a guarantee. England's only title came as host. Brazil's five and Germany's three titles away from home are part of why the away rate is 7.5% and not lower.
The Fade
The Edge Has Narrowed Since 1998
From 1998 to 2022 there were eight host entries. Six finished above their norm, and the average gap across the eight was 21 points, but only France in 1998 won. South Korea reached fourth place in 2002 and Germany third in 2006. South Africa in 2010 and Qatar in 2022 went out in the group stage.
Eight entries are too few to settle it: the sign test on those eight gives a 29% chance of a split like that by luck alone. The older record carries the result, 19 of 23 before 2026, and the recent one is weaker evidence in the same direction.
The 2026 Hosts
In 2026 the Hosts Went Far, Then Stopped Together
Canada, Mexico and the United States all won their Round of 32 matches and all lost in the Round of 16. Canada lost 0-3 to Morocco, Mexico 2-3 to England and the United States 1-4 to Belgium. Mexico's quarter-final finishes as host in 1970 and 1986 stood as its best.
The group stage was where hosts looked strongest. They took 2.11 points a match against 1.31 for the other 45 teams. Mexico won all three games, scored 6 and conceded none, finishing level on 9 points with France and Argentina. For Canada, in a third World Cup, the last 16 is its best finish.
At Home
Thirteen Matches at Home, Four Defeats
Between them the three hosts played 13 matches inside their own country. They won 8, drew 1 and lost 4, scoring 29 goals and conceding 14. Mexico and the United States played all five of their matches at home. Canada played three at home and lost one of them, 1-2 to Switzerland.
Canada's two knockout matches were in the United States, a 1-0 win over South Africa in Inglewood and the 0-3 loss to Morocco in Houston. So the shared hosting meant that one host's knockout run was largely away from home, a difference earlier single hosts never faced.
The Limits
What This Comparison Cannot Show
No team-strength rating was used, so a host that was unusually strong that year looks like a host advantage. The baseline also flatters the nations: their other World Cups are years they qualified, while a host qualifies automatically, which makes the measured gap smaller than the true one if anything. Qatar has one other tournament to compare with, Canada two and South Africa three.
A rank means different things in different formats, a last-16 exit is a high rank in a 48-team field and a middling one in a 24-team field. Two entries in 2002 and three in 2026 share a host year. And the data says nothing about why: crowds, travel, climate, referees and kinder draws are all untested.
The Verdict
A Real Edge, Smaller Than It Was
Hosts do better at home than their own record predicts, in 22 of 26 cases, and they win the title about three times as often as the same nations elsewhere. The claim that six of eight champions won at home is true, but it overstates the edge, because the hosts were strong teams.
The edge has been smaller since 1998, and the 2026 hosts used it to reach the last 16 together and no further. Whether the next shared tournament, in 2030 across Morocco, Portugal and Spain, repeats that is the next test.
The Full Data Table
Every World Cup Host, 1930 to 2026
Each host's finish, the share of the other teams it finished ahead of, the average for the same nation at its other World Cups, and the gap in points. Years with two or three hosts have one row each.
Share ahead = (teams minus rank) over (teams minus 1) from FIFA's tournament ranking as shown on Wikipedia; ties use the first place of the tie. The nation's other World Cups exclude the host year and cover 1930 to 2026. Percentages and gaps are FactsFigs calculations.
The data behind this story comes from Wikipedia's National team appearances in the FIFA World Cup, which lists the hosts and every nation's tournament ranking, and from the match results and stadiums on Wikipedia's pages for the 2026 World Cup, read on 21 November 2026. The dataset is available under CC BY-SA 4.0, and full credit for collecting and maintaining the underlying records goes to Wikipedia's contributors. The shares of teams finished ahead of, the gaps, the title rates and the significance figures are FactsFigs calculations.
FactsFigs reviews, cleans, and cross-checks every source dataset before shaping it into a data story. Each visualization is created and designed in FactsFigs Design Studio - an internal tool developed and owned by FactsFigs - and is the original work of a FactsFigs author, not an AI-generated copy of any existing graphic. Individual assets within a visual may or may not be produced with AI tools, but the design of the visual itself is solely FactsFigs' own.
Figures are estimates at the time of publication, provided for information only - nothing here is financial advice or a guarantee of accuracy.
Last verified: 21 Nov 2026
The charts in this article were built with our own publishing system. See what it does →