TL;DR — Which Countries' Dairy Farms Use Milking Robots Most?
Sweden at 46.6%, the US at about 4%, and a robotic arm that makes the difference
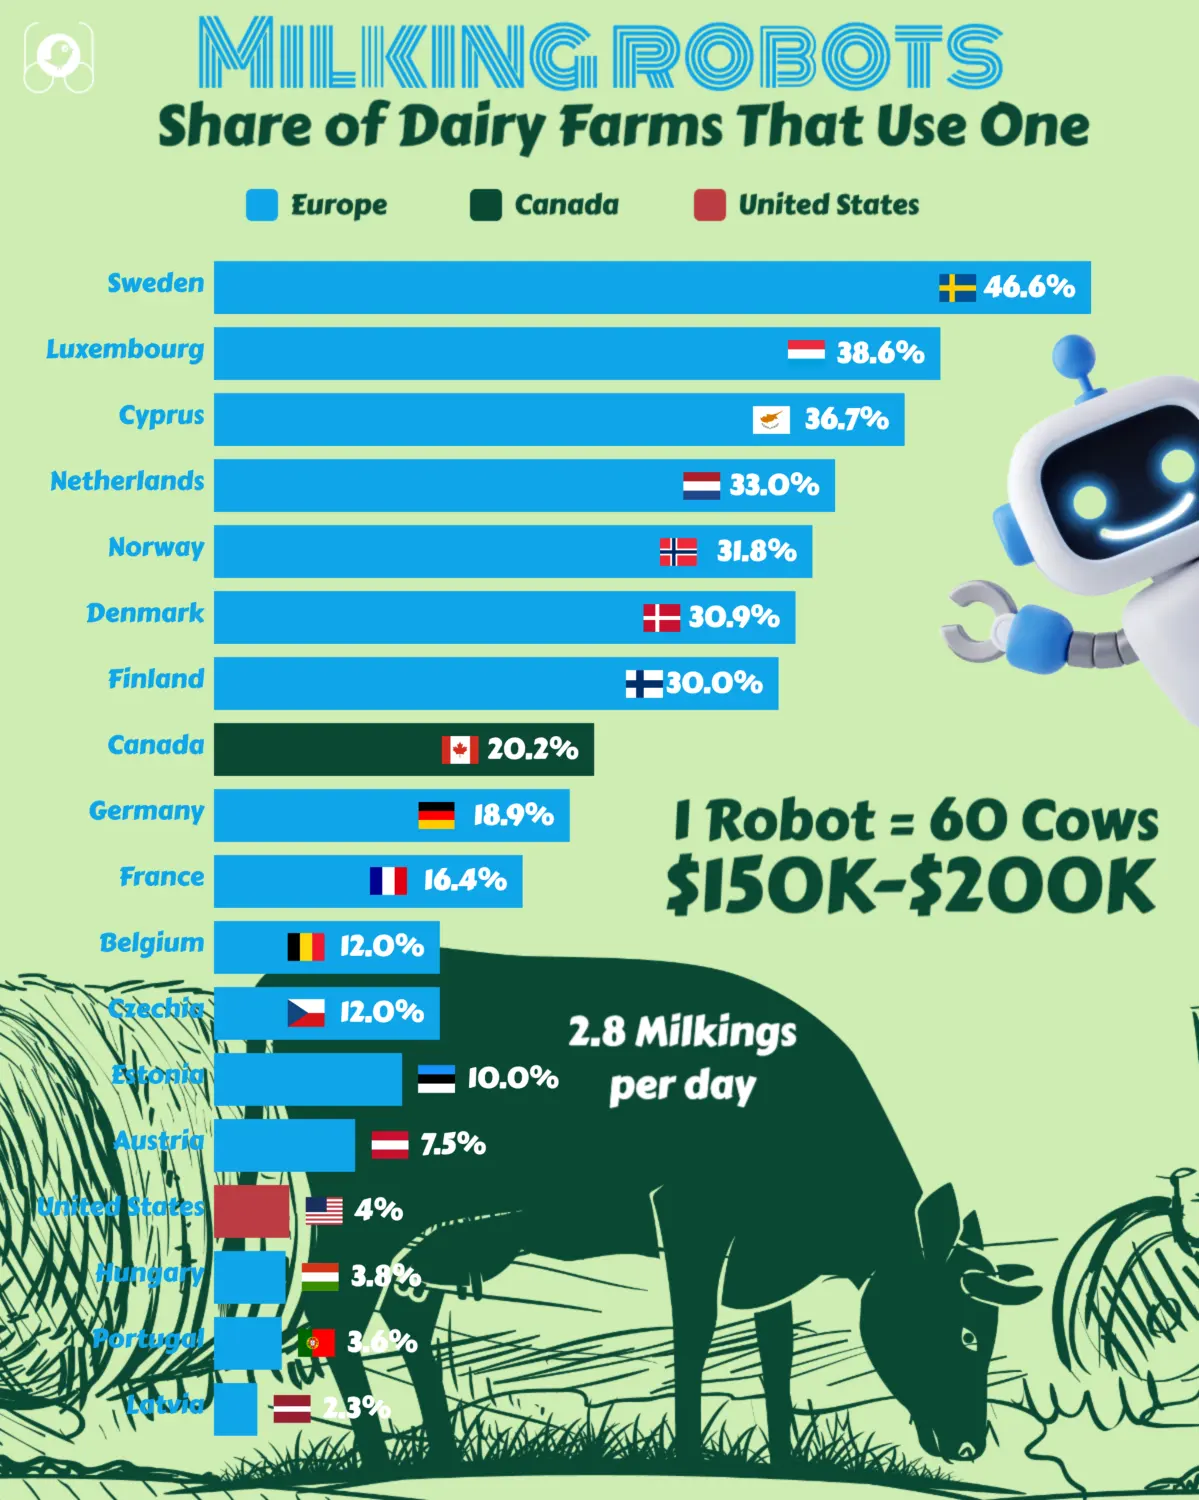
Milking-robot adoption runs from 2.3% of dairy farms in Latvia to 46.6% in Sweden, where 1,250 of 2,680 farms have one; seven European countries are at 30% or above. Canada reports 20.2% and the US about 4%, from different surveys.
Eurostat counts only systems with a robotic arm. Measured robot farms milk cows 2.8 to 2.9 times a day against about 2.0 and use 29% to 36% less labour, but the work moves rather than vanishes.
One robot box serves about 60 cows and costs $150,000 to $200,000 before the barn; a Danish farm of average size needs five.
! What to Keep in Mind Before Quoting a Country:
•
Different Surveys · 2020 to 2023:Eurostat counts holdings, Canada a census of farms, the US a sample. Trust the ordering, not the decimals.
•
Four Countries Dropped · 2 Implausible, 2 Rounded:Romania and Croatia report shares their herds cannot support; Slovakia and Malta report 5 farms, a rounding floor.
•
Eight Missing · Absent, Not Zero:Eight countries never reported milking robots, so they cannot be ranked.
? The Numbers Behind the Ranking:
•
Sweden, 2023:46.6%: 1,250 of 2,680 dairy farms
•
United States, 2021:About 4% of farms, 6% of the milk
•
A Danish farm of average size:5 robots, $750,000 to $1.0 million
The gap is real, but herd size explains it only loosely: Denmark, with Europe's largest herds, trails Sweden.
Continue reading below for the full detailed article →
Overview
Why the Robot Milking Gap Between Countries Is So Wide
Milking is one of the few farm jobs with hard robot adoption data. Each share here divides farms with a milking robot by farms with dairy cows: 1,250 of 2,680 in Sweden gives 46.6%. Divide by all cows instead and Sweden falls to 10.0% and the Netherlands to 25.9%, reversing their order. The result counts farms, not robots or milk, and robot farms skew large: about 4% of US dairy farms produce 6% of its milk.
The Three Numbers That Define the Robot Gap
The US share, the measured labour saving and the Romanian herd size.
About 4% of US Dairy Farms Run Milking Robots
4%
USDA's 2021 dairy survey puts box robots on 4% of US dairy farms, up from 1% in 2016, though wide standard errors mean the two years cannot be told apart statistically. Those farms produce 6% of American milk, so robot farms are larger than average. Sweden's 46.6% is a ratio of reported counts.
36% Less Labour per Cow on Irish Robot Farms
36%
Teagasc audited seven robot farms and ten conventional farms in Ireland and measured labour falling from 25.0 to 15.8 hours per cow per year, which it reports as 36%. Dutch farm accounts for 31 matched pairs show 29% less. Both are measured on working farms, unlike the larger savings that circulate as projections.
One Robot Box Could Milk 15 Romanian Farms
15 farms
A robot box serves roughly 60 cows, while the average Romanian dairy holding keeps 3.9, so one box could milk the combined herds of about 15 average farms. Eurostat nonetheless records 31,470 Romanian holdings with milking robots. That mismatch is the clearest single reason Romania is excluded from the ranking.
Sweden by the Numbers
46.6% of Swedish Dairy Farms Use Robots 46.6 %1,250 of 2,680 farms in 2023, the highest share charted.
110.3 Cows on a Swedish Farm of Average Size 110.3 cowsTwo robot boxes: $300,000 to $400,000 in robot units.
15.7 Points Ahead of Denmark 15.7 pointsDenmark's 30.9% comes with herds twice as large, 245.5 cows.
Parlour Versus Robot
How a Robot Milks Differently From a Parlour
In a conventional parlour the herd is brought in on a schedule, typically twice a day, and a person checks the foremilk, cleans and dries the teats, fits the cluster, removes it and applies a germicide. Teagasc estimates milking is a third of all work on a conventional dairy farm, an average of 3 hours a day.
A robot box does all of it. It identifies the cow from her collar, locates the teats with lasers or cameras, and a robotic arm attaches the four cups in succession; then the cups detach and the robot applies an iodine dip. Nobody is present, and attendance is voluntary: the cow chooses her own interval, so there are no fixed milking times.
Eurostat's Test for a Robot
Eurostat's survey manual covers automatic milking systems "where milking is performed without the direct physical engagement of the producer" and excludes an "Automatic milking system without robotic manipulator in the unit". A robotic arm is a requirement, so the charted shares count robots, not milking machines.
Measured Effects
What Robots Change on the Farms That Measure It
Robot herds are milked more often. Fifty-three Minnesota and Wisconsin farms averaged 2.8 milkings per cow per day, and 635 North American robot farms about 2.9, against 2.0 in a standard parlour herd.
Labour falls too. Teagasc's audit of seven Irish robot farms and ten conventional ones measured 25.0 down to 15.8 hours per cow per year, with milking time falling from about 3 hours a day to 40 minutes, partly offset by 15 minutes more allocating grass. Dutch farm accounts from 2003 show 29% less.
The Counterpoint
Why Robots Move Farm Work Rather Than Remove It
Canadian robot farms reported fetching about 4% of the herd, roughly three cows, per robot per day, with a median 2.5 failed or incomplete milkings per robot per day. Minnesota advisers put well-designed free-flow barns at about 45 minutes a day of milking-like labour per robot, and routine service covers pulsation, vacuum, camera and laser. Teagasc says the robot "will only save time on the milking process".
Money and milk are mixed. USDA's survey shows robot farms with 50 to 149 head producing more milk per cow (214 against 182 cwt a year), but those with 500 or more producing less (218 against 237), a gap it could not separate from chance. We found no randomised comparison.
Side by Side
Parlour Versus Robot: What Changes on the Farm
The same milking job under two systems, using measured figures where they exist.
Who attaches the cups
A person, at every milking
A robotic arm, four cups in succession
When cows are milked
Fixed times; herd brought in on a schedule
Whenever the cow chooses to visit
Milkings per cow per day
About 2.0
2.8 to 2.9 on measured robot farms
Time in the milking process
About 3 hours a day
About 40 minutes a day
Labour per cow per year
25.0 hours
15.8 hours
Work that remains
Teat preparation, cluster attachment, moving the herd
Checking data, fetching cows, cleaning, service and alarms
Labour and process time are from Teagasc's audit of 7 robot and 10 conventional Irish farms; the 3 hours a day for parlour milking is Teagasc's average over the year. Milking frequency is from US producer surveys and robot software records.
Method and Exclusions
Why Four Countries Are Left Off the Chart
Romania reports 31,470 holdings with milking robots, 11.5% of its 273,160 dairy holdings, yet its average dairy holding keeps 3.9 cows and it has almost six times as many dairy holdings as France or Germany.
Croatia reports 1,450 holdings, 29.1%, on an average herd of 15.2 cows: close to Denmark's 30.9%, where herds are 16 times larger. One region, Jadranska Hrvatska, reports 430 of 650 dairy holdings with robots, 66.2%.
Slovakia and Malta each report 5 holdings, the floor Eurostat uses when rounding non-zero counts, so Slovakia's 0.2% and Malta's 6.2% are artefacts, not measurements.
Dropping Romania and Croatia is our editorial judgement: Eurostat attaches no reliability flag to either. The figures are self-reported on a survey form, with no inspection. Cyprus (110 of 300 dairy holdings) and Luxembourg (220 of 570) stay, though their bases are small.
The Full Data Table
All 18 Countries Ranked by Share of Dairy Farms With Robots
Farms with milking robots as a share of farms with dairy cows, with the underlying counts for the Eurostat countries.
Eurostat counts are rounded to 5 or 10. Canada is the official share of dairy-classified farms (2,197 farms nationally reported fully-robotic milkers in 2020) and the US figure is a whole-number sample estimate; the two are different surveys and not strictly comparable. Not reported, and so absent rather than zero: Spain, Italy, Poland, Ireland, Greece, Bulgaria, Lithuania and Slovenia. Excluded: Romania and Croatia (implausible), Slovakia and Malta (5 holdings, Eurostat's rounding floor). Belgium and Czechia tie at 12.0%; ranks use unrounded values.
Herd Size and Budget
How Many Robots Does a Farm of Average Size Need?
Herd size sets how many boxes a farm must buy. Measured means are 50.5 cows per robot across 635 North American farms, 55.8 across 33 Upper Midwest farms and 60.2 across 39 farms using one vendor's machines; planning ranges run 50 to 70. We use 60. Irish advisers plan for 70 to 75 on pasture-based farms; no measured Dutch, Danish or Swedish figure turned up.
A US extension study puts a robot at $150,000 to $200,000 per 50 to 70 cows, in 2019 dollars; Irish list prices of EUR 115,000 to 155,000 for a first robot convert to nearly the same range. Both are list prices relayed by advisers, not transaction prices, and exclude the barn, installation and services.
Running costs resist a single figure: Teagasc lists service at EUR 2,200 to 4,200 per robot a year, excluding consumables, while a USDA report cites $20,000 to $25,000 for maintenance, which we could not trace to its origin. We quote neither.
Lumpy Capital
Why Capital Comes in Whole Boxes, Not Capacity
You cannot buy 4.1 robots. A Danish farm of average size, 245.5 cows, needs 4.09 boxes at 60 cows each, so five: $750,000 to $1.0 million in robot units before the barn. A Swedish farm of average size, 110.3 cows, needs two, or $300,000 to $400,000.
Treat these as orders of magnitude. Averages are means, skewed by large holdings, and no median is available. Rounding up is crude too: Cyprus's 128.4 cows round to three boxes, yet a farm that size might run two.
Run the same sum on Romania and one 60-cow box could milk the combined herds of about 15 farms of average size, at 3.9 cows each. It is the plainest sign that 31,470 reported robot holdings do not describe real machines.
The Herd Size Table
Average Dairy Herd, Robot Boxes and Cost Across 21 Countries
Average dairy herd per farm in 2023, the robot boxes it implies at 60 cows each, and the robot-unit cost range, with each country's status in the ranking.
Boxes assume 60 cows per robot (measured means 50.5 to 60.2, planning range 50 to 70); whole boxes round up. Costs are robot units only, at list prices of $150,000 to $200,000 per box in 2019 US dollars, and exclude the barn, installation and services. Averages are means, not medians. Shares for Romania, Croatia, Slovakia and Malta are shown for transparency and excluded from the ranking; Ireland did not report.
The Anomaly
Why Does Denmark Trail Sweden Despite Bigger Herds?
Herd size predicts adoption only moderately: across the 16 European countries charted, the correlation is +0.43 (Pearson). Denmark breaks the pattern, with Europe's largest herds at 245.5 cows yet 30.9% against Sweden's 46.6% on 110.3. Austria is the opposite: 22.2 cows on average, 7.5% using robots.
A 2017 US simulation offers one possibility. Robots were more profitable than a double-8 parlour at 120 and 240 cows and the parlour won at 1,500, at break-even labour rates of $17 to $27 an hour. That is a US model at US wages, and 1,500 cows is far above Denmark's mean, so it cannot explain a national average alone; a tail of very large herds might, but we lack the distribution. Treat it as a possibility, not a finding.
North America
What Canada's Census and the US Survey Add
Canada's census counted 2,197 farms with fully-robotic milkers in 2020, up from 1,063 in 2015, led by Quebec at 902 and Ontario at 715. Statistics Canada puts the share of dairy farms at 20.2%, up from 8.9%, though the 2021 wording specified fully robotic milkers.
USDA's 4% is a sample estimate, imprecise enough that 2021 cannot be separated statistically from 1% in 2016. Adoption concentrates in mid-sized herds: 13% of farms with 150 to 499 head against 3% at 500 or more.
What This Settles
What This Ranking Can and Cannot Settle
It settles that robot milking is mainstream in seven countries, from Sweden to Finland, where 30% or more of dairy farms use it, and marginal in the US, Portugal, Hungary and Latvia.
It does not settle why: herd size is the only driver tested, and only moderately. It cannot rank Spain, Italy, Poland or Ireland, and it counts farms with a robot, not robots in service. These figures are from Eurostat's 17 June 2026 update; check it before quoting.
European shares: Eurostat, 2023 Integrated Farm Statistics (online data codes ef_mp_digilsk and ef_lsk_bovine, DOI 10.2908/EF_MP_DIGILSK), updated 17 June 2026; reuse is authorised with the source acknowledged. US figures: U.S. Department of Agriculture, Economic Research Service, Precision Dairy Farming, Robotic Milking, and Profitability (ERR-356), January 2026. This post does not imply endorsement by either body.
Source: Statistics Canada, Table 32-10-0379-01 Technologies used on the operation, Census of Agriculture, 2021 (reference year 2020). Reproduced and distributed on an "as is" basis with the permission of Statistics Canada. Adapted from Statistics Canada; this does not constitute an endorsement by Statistics Canada of this product.
FactsFigs reviews, cleans, and cross-checks every source dataset before shaping it into a data story. Each visualization is created and designed in FactsFigs Design Studio — an internal tool developed and owned by FactsFigs — and is the original work of a FactsFigs author, not an AI-generated copy of any existing graphic. Individual assets within a visual may or may not be produced with AI tools, but the design of the visual itself is solely FactsFigs' own.
Figures are estimates at the time of publication, provided for information only — nothing here is financial advice or a guarantee of accuracy.
Last verified: 7 Oct 2026
The charts in this article were built with our own publishing system. See what it does →