TL;DR: Why Is Norway 97% Electric in Sales but 36% on the Road?
A fleet is the running total of past sales, so it trails them in every country.
Norway's new-car sales were about 97% electric in 2025, but only 36% of the cars on its roads are electric. The world sold 25% electric and has 5% of its cars electric. Electric means battery electric plus plug-in hybrid.
Norway's fleet today is as electric as its new-car market was about 8 years ago, and the median across 18 countries is 5.5 years. The electric fleet itself is mostly Chinese: 44 million of the world's 76 million electric cars.
! Where the Gap Shows:
•
Norway · 97% Sold, 36% Driven:A 61-point gap between sales and fleet, the widest of the 45 countries.
•
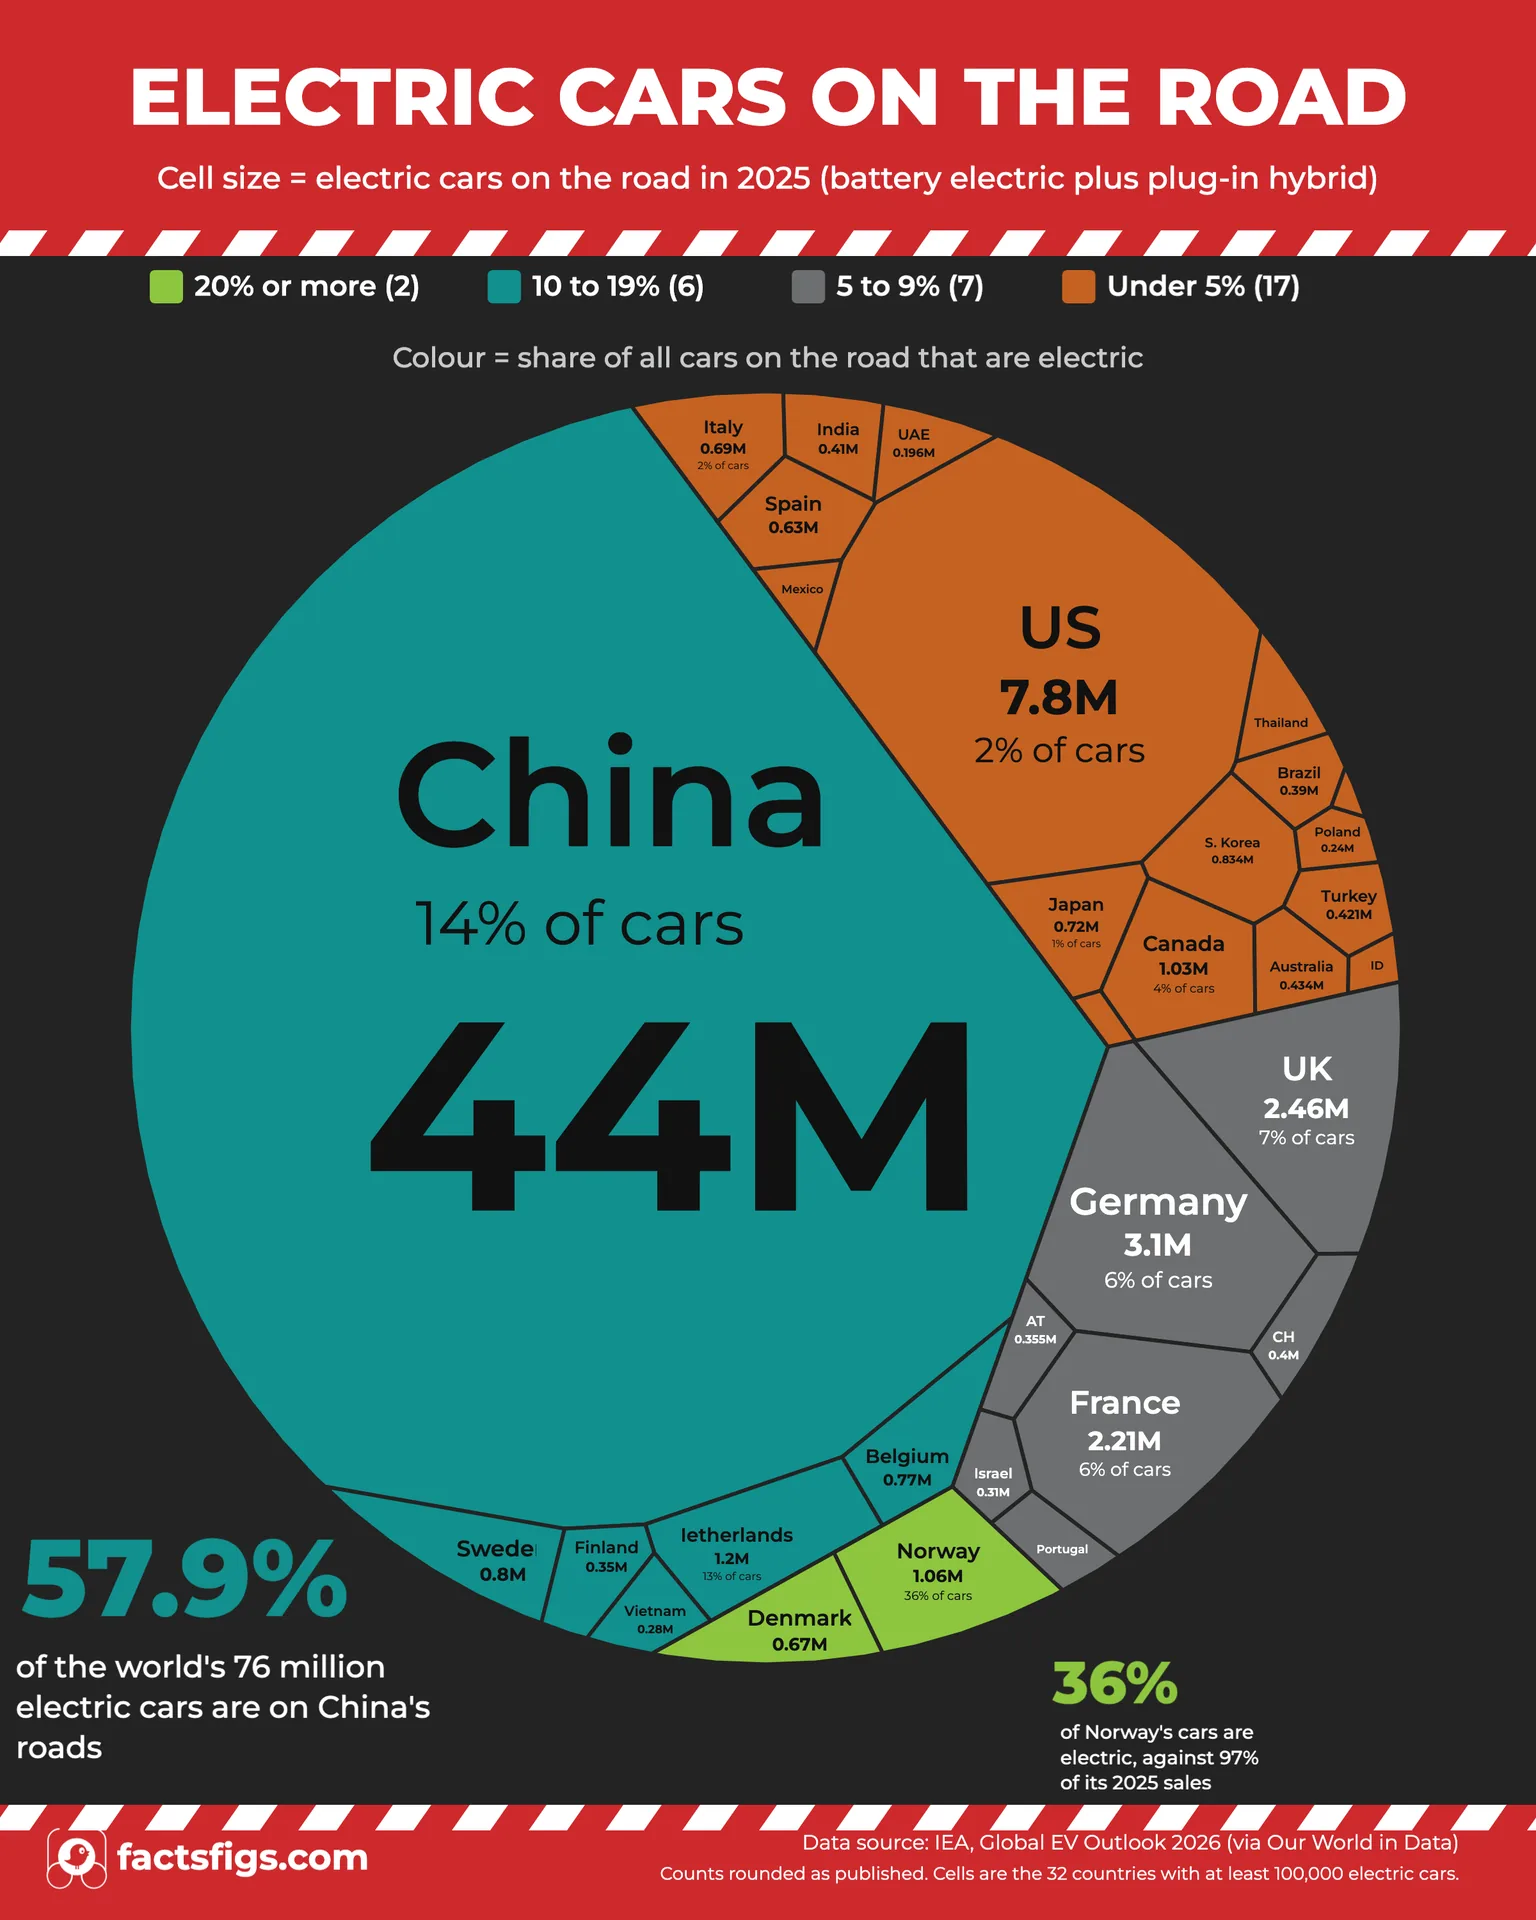
China · 57.9% of the World's Fleet:44 million of 76 million electric cars. The file puts its fleet at 14%, the IEA text at around 13%.
•
United States · 10% Sold, 2% Driven:The second-largest electric fleet at 7.8 million cars, yet only 2% of its cars are electric.
? The Numbers Behind the Claim:
•
Norway:1.06 million on the road, 172,800 sold in 2025
•
Fleet lag:About 8 years in Norway, median 5.5 across 18 countries
•
World:25% of 2025 sales, 5% of the fleet, 76 million cars
Sales show where a market is heading and the fleet shows where it is now, so even a 97% market has a fleet that is only 36% electric.
Continue reading below for the full detailed article →
Overview
What Sales Share and Fleet Share Each Measure
Two numbers describe how electric a country is, and they answer different questions. The share of new sales counts the cars bought in one year. The share of the fleet counts every car in use, whatever year it was bought, which the IEA calls the car stock.
Both come from the IEA's Global EV Outlook 2026, which defines an electric car as battery electric or plug-in hybrid. Conventional hybrids are not counted, so the cars called not electric here include hybrids. Counts are rounded and most shares are whole percentages, so a fleet share of 6% could be anywhere from 5.5% to 6.5%.
The distance between the two numbers is the story. Norway sold about 97% electric in 2025 and has 36% of its cars electric. The world sold 25% and has 5%.
Three Numbers That Define the Fleet Gap
The widest gap, the owner of the world's electric fleet and the lag between sales and the road.
Norway · 36% of the Fleet
36%
Norway's electric cars are 36% of the cars on its roads, against about 97% of its 2025 new-car sales. The IEA's chapter calls it more than one-third of the car stock. That is 1.06 million electric cars, and the 61-point gap between the two shares is the widest of the 45 countries in the data file.
China · 57.9% of World Electric Cars
57.9%
China has an estimated 44 million of the world's 76 million electric cars, which is 57.9%. The United States is next with 7.8 million, 10.3% of the world's. China's own fleet is 14% electric in the data file and around 13% in the IEA's text, and the post reports both figures side by side rather than averaging them.
Norway · About 8 Years of Fleet Lag
8 years
Norway's 36% fleet is as electric as its new-car market was about 8.3 years earlier, between 29% in 2016 and 39% in 2017. Across the 18 countries whose fleet is at least 5% electric the median lag is 5.5 years, from 2.0 in Vietnam to 8.3 in Norway. It describes a gap and is not a forecast.
Norway by the Numbers
Electric Share of the Fleet 36 %Against about 97% of new-car sales in 2025.
Electric Cars on the Road 1.06 millionThe electric fleet at the end of 2025, the base for the next bar.
Electric Cars Sold in 2025 172800 Equal to 16.3% of the electric fleet.
The leader
Norway Electric Cars: Sold at 97%, Driven at 36%
Norway has 1.06 million electric cars on the road. The IEA's chapter says it plainly: "Norway leads, with more than one-third of the car stock being electric." The data file gives the whole-number share, 36%, so the two sources agree. New sales tell a different story. About 97% of the cars Norway sold in 2025 were electric, 172,800 of them, a 61-point gap that is the widest of the 45 countries in the file.
That single year of sales equals 16.3% of the whole electric fleet, a figure FactsFigs derived from the two counts. Roughly one in six of the electric cars on Norway's roads, in other words, was bought in 2025.
The turning point came well before the fleet shows it. Norway's electric sales passed 50% in 2019, when they reached 56%, while the electric fleet that year was 12%. Six years on, sales are 41 points higher and the fleet share has tripled to 36%. A market can switch in a few years. A fleet takes longer, because every car already on the road stays in the count until it leaves it.
The mechanism
Why a Fleet Trails the Sales Behind It
A fleet is a running total. The electric cars on the road are, to a close approximation, the electric cars sold in earlier years. FactsFigs added up electric sales for 2010 to 2025 and set them against the cars on the road: China 46.6 million against 44.0 million (94%), the United States 7.80 million against 7.80 million (100%), Norway 1.14 million against 1.06 million (93%) and Germany 4.34 million against 3.10 million (71%).
The shortfall is retirements, exports and gaps in the series, and these files cannot separate them. Germany's 71% shows how much room that leaves. What the match does establish is the direction: today's fleet is made of yesterday's sales, so when a sales share climbs fast the fleet share has to climb behind it.
The fleet lag measures that distance in years. For each country it asks when the new-car electric share last equalled today's fleet share. Norway's fleet is 36% electric. Its sales were 29% electric in 2016 and 39% in 2017, so today's fleet looks like the market of about 8.3 years ago.
Across the 18 countries whose fleet is at least 5% electric, the median lag is 5.5 years, ranging from 2.0 in Vietnam to 8.3 in Norway. Vietnam's fleet is 10% electric against 40% of new sales, but a lag of 2.0 years means its market stood where the fleet is now only two years earlier.
Treat the lag as a description and not a forecast. It rests on rounded shares, and a half-point error in either one moves it by about 0.3 years where sales were rising steeply, so Norway's 8.3 is best read as about 8 years.
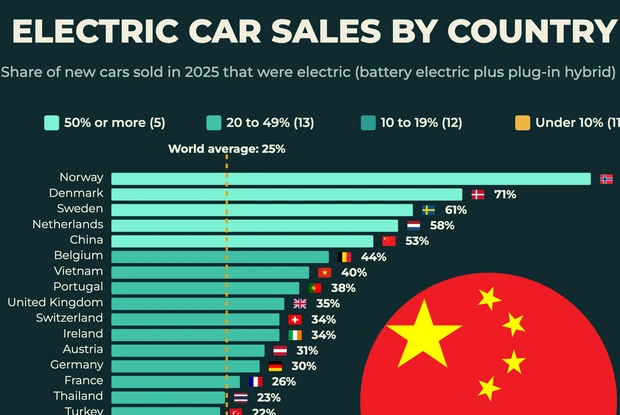
Norway is the widest case and not an exception. Denmark sold 71% electric in 2025 and has 23% of its fleet electric. Sweden is at 61% and 16%; the Netherlands at 58% and 13%; Finland at 57% and 12%; China at 53% and 14%. The sales shares are the same series as in our ranking of new-car sales, and in every country the fleet share sits below them.
The world follows the pattern. It sold 21.2 million electric cars in 2025, 25% of new sales, and has 76 million on the road, about 5% of the fleet. Europe is also near 5%: the IEA says electric cars represent "about 5% of the European car fleet", which is 17.1 million cars, with the 27 EU countries accounting for 12.0 million of them.
China's two shares are where the sources disagree. The data file behind the table gives China's fleet as 14% electric and its 2025 sales as 53%. The IEA's chapter says 44 million electric cars are "around 13% of the total car stock" and that "Close to 55%" of new cars sold in China were electric. The table and visual use the file's 14 and 53, and the material does not explain the difference.
The gap is close to 40 points either way: 39 on the file's figures and roughly 42 on the report's. China's 44 million cars agree in both sources.
Why China Holds 57.9% of the World's Electric Cars
The IEA estimates that 44 million electric cars were on Chinese roads at the end of 2025, a share it says is "up from 1 in 10 in 2024". Out of 76 million worldwide that is 57.9%, so more than half the world's electric fleet is one country's. China also bought 13.3 million of the 21.2 million electric cars sold in 2025, 62.7%, which the IEA phrases as "six out of ten".
The next largest fleets are far smaller. The United States has 7.8 million electric cars, 10.3% of the world's, followed by Germany with 3.1 million, the United Kingdom with 2.46 million and France with 2.21 million. The Netherlands has 1.2 million, Norway 1.06 million and Canada 1.03 million.
China's fleet is about 5.6 times the United States' and more than 40 times Norway's. Germany, the United Kingdom and France together hold 7.77 million, roughly the same as the United States. So the world's electric fleet is not spread across the markets that sell the most electric cars by share. It is concentrated where the sheer volume is.
Size against share
Why Big Fleets Sit in the Low Bands
Of the 32 countries with at least 100,000 electric cars, only two have a fleet that is 20% electric or more: Norway at 36% and Denmark at 23%. Six sit at 10 to 19%: China, the Netherlands, Sweden, Belgium, Finland and Vietnam. Seven are at 5 to 9%: Germany, the United Kingdom, France, Switzerland, Austria, Portugal and Israel. The other 17 are under 5%.
Several of those 17 are big markets with small fleets. The United States has 7.8 million electric cars and a fleet 2% electric, against 10% of new sales. Japan has 720,000 and a fleet 1% electric, against 3% of sales. India has 410,000, under 1% of its fleet at 0.75%, against 4% of sales. Iceland, at 25% with 64,000 electric cars, is more electric than any of them but is in the table only.
A narrow gap does not mean a fleet that has caught up. Japan's gap of 2 points is the narrowest of the 32 countries drawn, and it reflects slow sales and not a finished transition.
Every country
All 45 Countries: Electric Cars on the Road Against Sales Share
Ordered by electric cars on the road in 2025. Gap is the sales share minus the fleet share, in percentage points.
🇨🇳 China
44,000,000
14
53
39
4.2
10 to 19%
—
🇺🇸 United States
7,800,000
2
10
8
7.3
Under 5%
—
🇩🇪 Germany
3,100,000
6
30
24
5.7
5 to 9%
—
🇬🇧 United Kingdom
2,460,000
7
35
28
5.5
5 to 9%
—
🇫🇷 France
2,210,000
6
26
20
5.6
5 to 9%
—
🇳🇱 Netherlands
1,200,000
13
58
45
6.2
10 to 19%
—
🇳🇴 Norway
1,060,000
36
97
61
8.3
20% or more
—
🇨🇦 Canada
1,030,000
4
11
7
5.3
Under 5%
—
🇰🇷 South Korea
834,000
3
11
8
7.3
Under 5%
—
🇸🇪 Sweden
800,000
16
61
45
5.8
10 to 19%
—
🇧🇪 Belgium
770,000
13
44
31
4.7
10 to 19%
—
🇯🇵 Japan
720,000
1
3
2
8.3
Under 5%
—
🇮🇹 Italy
690,000
2
13
11
5.7
Under 5%
—
🇩🇰 Denmark
670,000
23
71
48
4.6
20% or more
—
🇪🇸 Spain
630,000
2
20
18
5.8
Under 5%
—
🇦🇺 Australia
434,000
3
15
12
3.9
Under 5%
—
🇹🇷 Turkey
421,000
3
22
19
2.7
Under 5%
—
🇮🇳 India
410,000
0.75
4
3.2
3.7
Under 5%
—
🇨🇭 Switzerland
400,000
8
34
26
5.7
5 to 9%
—
🇧🇷 Brazil
390,000
1
9
8
3.7
Under 5%
—
Showing 1-20 of 45
Page 1 of 3
Electric means battery electric plus plug-in hybrid. Counts are the IEA's, rounded to the nearest thousand or ten thousand. Shares are whole percent for most countries, so each can be off by half a point. Fleet lag is FactsFigs' arithmetic: the years since the new-car electric share last equalled today's fleet share, to one decimal and good to about 0.3 years, blank where it could not be computed. Fleet band follows the share of cars on the road. The 13 countries marked table only have under 100,000 electric cars and are not drawn in the visual. World, Europe, the European Union and Rest of World are left out. Country names follow Our World in Data. The table carries no download: the IEA states CC BY 4.0 for its report and non-CC terms for its downloadable data, so FactsFigs shows the figures and offers no file until that is clarified. Source: IEA, Global EV Outlook 2026.
The limits
What Fleet and Sales Shares Cannot Tell You
The numbers settle one thing. In all 45 countries the fleet is less electric than the market, by 0.8 points in South Africa and up to 61 in Norway. They do not settle how long Norway's fleet will take to turn over, and this post makes no projection. The files carry no fleet totals, no fleet ages and no retirement rates, which any projection would need.
The counts and shares are both rounded. A fleet share of 6% could be 5.5% to 6.5%, and at 1% or 2% the rounding is a large part of the number. Japan's lag of 8.3 years rests on a fleet share of 1%, which could be anywhere from 0.5% to 1.5%. That is why the median lag covers only the 18 countries at 5% or more.
The sources also differ by a point or two in places, as China's 14% against the IEA's around 13% shows. A fleet total from national vehicle registers, such as those Statistics Norway keeps, was not read for this post, and the cars called not electric here include hybrids.
The sales side of the story, how far electric cars go and how their claims hold up, is covered in our post on EV range, 0-60 times and self-driving.
The data behind this story is the IEA's Global EV Outlook 2026, read through Our World in Data's republication on 15 November 2026. Counts are rounded and shares are whole percent for most countries. The fleet lag, the cumulative sales comparisons and the 57.9% share are FactsFigs' own arithmetic on those figures. Remarks on definitions and on China's shares come from the IEA's report text. The IEA states CC BY 4.0 for the report and non-CC terms for its downloadable data, so FactsFigs offers no file until that is clarified. Full credit for collecting and maintaining the data goes to the IEA.
FactsFigs reviews, cleans and cross-checks every source dataset before shaping it into a data story. Each visualization is created and designed in FactsFigs Design Studio, an internal tool developed and owned by FactsFigs, and is the original work of a FactsFigs author, not an AI-generated copy of any existing graphic. Individual assets within a visual may or may not be produced with AI tools, but the design of the visual itself is solely FactsFigs' own.
Figures are estimates at the time of publication, provided for information only. Nothing here is financial advice or a guarantee of accuracy.
Last verified: 15 Nov 2026
The charts in this article were built with our own publishing system. See what it does →