TL;DR: Is Singapore Really One of Nvidia's Biggest Markets?
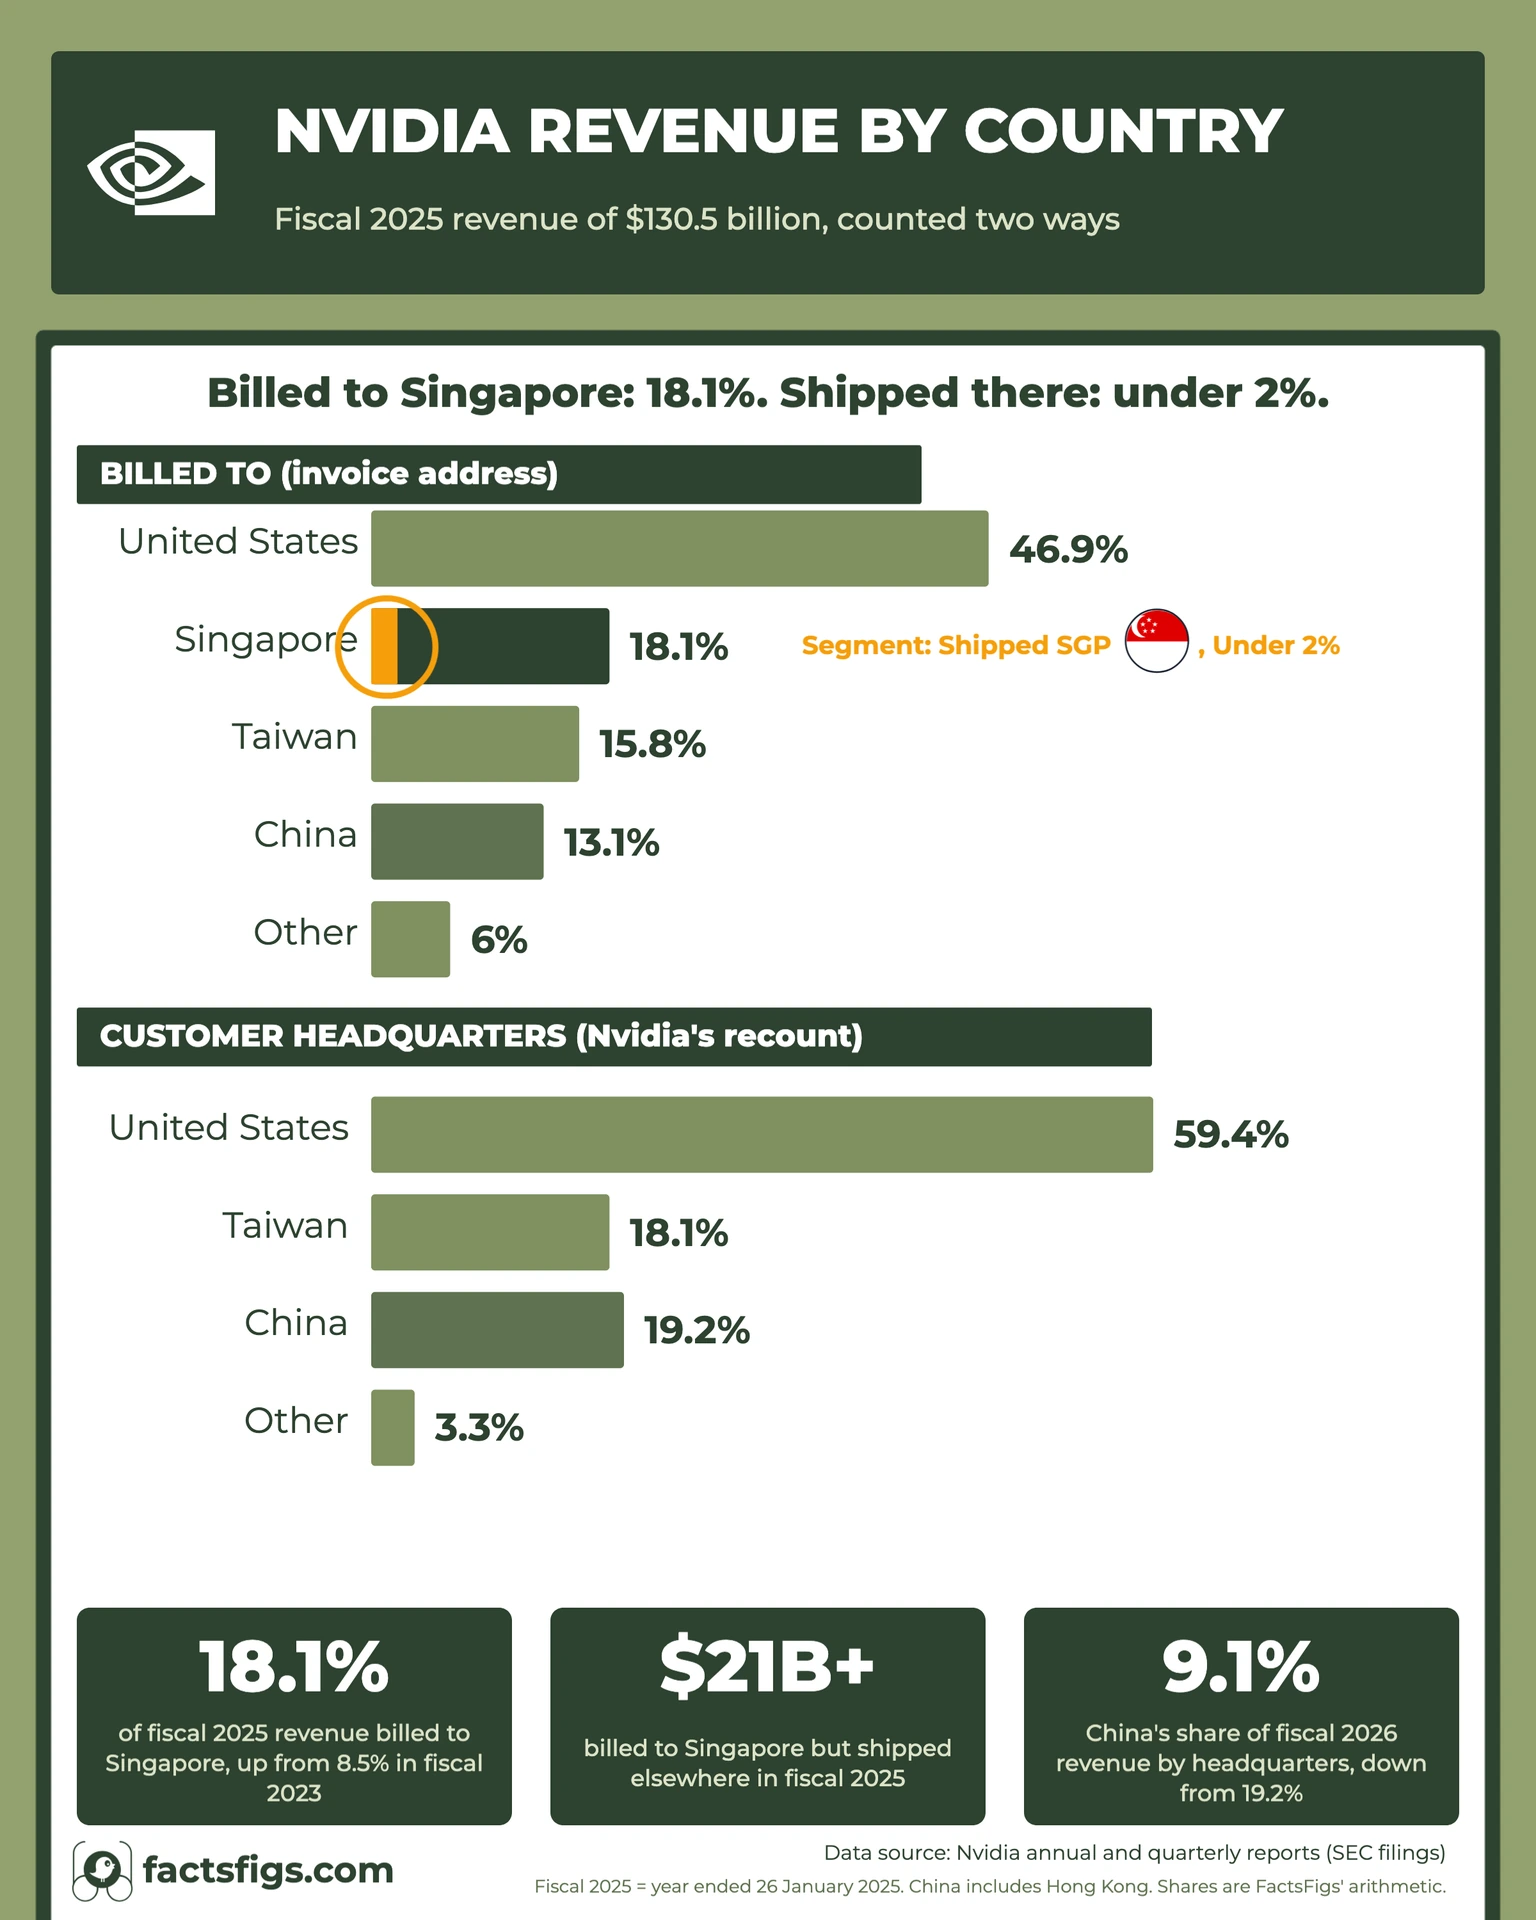
By billing address, yes: 18% of fiscal 2025 revenue. By shipments, no: under 2%.
Nvidia's fiscal 2025 annual report put Singapore at 18% of its $130.5 billion in revenue, behind only the United States. The filing says customers use Singapore to centralise invoicing, products are almost always shipped elsewhere and shipments there were under 2% of revenue.
In late 2025 Nvidia switched to counting by customer headquarters and recast earlier years. Singapore dropped out, China's fiscal 2025 share rose from 13% to 19% and the US share from 47% to 59%. On the new count China fell to 9% of fiscal 2026 revenue.
! Three Ways to Count One Total:
•
Billed to · Singapore 18.1%:Where the invoice went. Nvidia's old basis, used to the second quarter of fiscal 2026.
•
Headquartered in · China 19.2%:Where the customer is based. The new basis, recast to fiscal 2024, with no Singapore line.
•
Shipped to · Singapore under 2%:Where the product went. Given for Singapore in fiscal 2025 and no other region.
? The Numbers Behind the Claim:
•
Singapore, billed:$23,684 million, 18.1% of $130,497 million in fiscal 2025
•
Billed there, shipped elsewhere:More than $21 billion, FactsFigs' arithmetic
•
China, by headquarters:20.2% in fiscal 2024, 19.2% in fiscal 2025, 9.1% in fiscal 2026
Which country a revenue number names depends on the question it answers, and no filing says where the chips end up.
Continue reading below for the full detailed article →
Overview
Three Questions Hiding Behind One Revenue Number
A company can sort one revenue total by country in three ways: where the customer was invoiced, where the customer is headquartered and where the product was delivered. The answers can differ a lot. Nvidia's filings use the first two at different times and give a figure for the third in one place only, Singapore in fiscal 2025.
Up to the second quarter of fiscal 2026 Nvidia reported by billing location. From the third quarter it reports by headquarters and has recast earlier years, leaving each period's total unchanged. Fiscal years end in late January, so fiscal 2025 is the year to 26 January 2025. Every figure here is Nvidia's, as filed with the SEC.
Three Numbers Behind the Billing Puzzle
Singapore's billed share, the share shipped there and China's fall on the recast count, all from Nvidia's filings.
Singapore's Billed Share · 18.1%
18.1%
Singapore accounted for $23,684 million of Nvidia's $130,497 million in fiscal 2025 revenue, or 18.1%, by customer billing location. That is up from 8.5% in fiscal 2023 and 11.2% in fiscal 2024. It made Singapore second only to the United States on the old count, ahead of Taiwan at 15.8% and China at 13.1%.
Shipped to Singapore · Under 2%
<2%
Nvidia's fiscal 2025 filing states that shipments to Singapore were less than 2% of total revenue, and that its products were almost always shipped elsewhere. Two per cent of $130,497 million is about $2.6 billion, so more than $21 billion of the revenue billed there went with products shipped to other places. The filings do not name them.
China's Headquarters Share · 9.1%
9.1%
On the recast headquarters count China was 20.2% of Nvidia's revenue in fiscal 2024, 19.2% in fiscal 2025 and 9.1% in fiscal 2026. Its revenue fell 21.4%, from $25,048 million to $19,677 million, while total revenue rose 65.5% to $215,938 million. The revenue tables give the numbers, not Nvidia's reasons for them.
Singapore by the Numbers
Billed in Fiscal 2025 18.1 %Singapore's share of $130,497 million.
Billed to Singapore$ 23.7 billionFiscal 2025 revenue invoiced there.
Billed There, Shipped ElsewhereMore than $ 21 billion$23,684 million less 2% of total revenue is $21,074 million.
The puzzle
Why Did Singapore Bill 18% of Nvidia's Revenue?
Singapore is a city-state, yet Nvidia's fiscal 2025 annual report lists it as the source of $23,684 million in revenue, 18.1% of the $130,497 million total. Only the United States, at $61,257 million, was larger. Taiwan followed at $20,573 million and China, including Hong Kong, at $17,108 million.
The table sorts revenue by customer billing location, and a footnote explains the oddity. The filing states: "Customers use Singapore to centralize invoicing while our products are almost always shipped elsewhere." The Singapore line records where invoices went, not where the hardware was delivered.
A second line in the filing widens the gap: "The end customer and shipping location may be different from our customer's billing location." A billing address can be separate from both the end customer and the delivery address. Nvidia's place among the world's chipmakers is covered in our ranking of the top chipmakers by revenue.
Nvidia Revenue by Country: Singapore's Climb to 22%
Singapore's billed share rose on every reading the filings give. It was 8.5% in fiscal 2023 ($2,288 million), 11.2% in fiscal 2024 ($6,831 million) and 18.1% in fiscal 2025 ($23,684 million). Billed revenue there grew about 10.4 times in two years, while Nvidia's total grew about 4.8 times, from $26,974 million to $130,497 million.
The climb continued after the year closed. Nvidia's report for the quarter ended 27 July 2025 says Singapore represented 22% of that quarter's revenue and 21% of the first half of fiscal 2026. In the same six months a year earlier it was 17.2%, against 21.1% this time.
Other regions moved the opposite way. The United States rose from 30.7% in fiscal 2023 to 46.9% in fiscal 2025, while Taiwan fell from 25.9% to 15.8% and China, including Hong Kong, from 21.4% to 13.1%. Shares sum to a total, so one region's gain is partly another's loss.
Billed versus shipped
Billed in Singapore, Shipped Elsewhere: The $21 Billion Gap
The fiscal 2025 filing supplies the one figure that separates the two counts: "Shipments to Singapore were less than 2% of fiscal year 2025 total revenue." Two per cent of $130,497 million is $2,610 million, so shipments there were below that. Of the $23,684 million billed to Singapore, more than $21,074 million went with products shipped elsewhere.
The filings do not say where. No filing FactsFigs read splits shipments by destination beyond this one Singapore sentence, and the fiscal 2026 annual report does not repeat it. The United States, China and every other region are unknown on a shipping basis.
The report for the quarter ended 27 July 2025 adds a narrower statement. Nvidia says "Over 99% of controlled Data Center compute revenue billed to Singapore was for orders from U.S.-based customers." Controlled Data Center compute means products that meet ECCN 3A090.a or 4A090.a.
Scope matters. The statement is Nvidia's own, it covers only those controlled products rather than all revenue billed to Singapore, and it concerns who placed the orders. It says nothing about where products were delivered, and it applies to one quarter and one half-year.
The change of method
Why Did Nvidia Switch to Counting by Customer Headquarters?
In its report for the quarter ended 26 October 2025 Nvidia changed the basis and recast earlier periods. It says the old figures "often reflected a customer's centralized invoicing location, even though our products were almost always shipped elsewhere." It believes counting by headquarters "provides a better representation of the geographic profile of our revenue."
The recast leaves each total unchanged, $60,922 million for fiscal 2024 and $130,497 million for fiscal 2025, and moves only the split. In fiscal 2025 the United States goes from 46.9% to 59.4%, up $16,225 million. China goes from 13.1% to 19.2%, up $7,940 million, and Taiwan from 15.8% to 18.1%, up $3,027 million. Singapore's $23,684 million disappears as a line and Other falls $3,508 million, from 6.0% to 3.3%.
Fiscal 2024 shows the same pattern: the United States up $4,567 million, China up $2,024 million, Taiwan up $1,507 million, Singapore's $6,831 million gone and Other down $1,267 million. Nvidia's measure of foreign revenue moves with it. Customers outside the United States were 53% of fiscal 2025 revenue by billing location and 41% by headquarters, and 56% against 48% in fiscal 2024.
These are net differences between two counts, not flows out of Singapore. Other also fell, and any Singapore-headquartered customers would sit inside Other, so the changes cannot be read as Singapore's revenue moving to the United States or China.
China, on the headquarters count
China's Share on Nvidia's New Count: 20.2%, 19.2%, 9.1%
On the headquarters basis China, including Hong Kong, was 20.2% of revenue in fiscal 2024, 19.2% in fiscal 2025 and 9.1% in fiscal 2026. In dollars it went from $12,330 million to $25,048 million to $19,677 million. The latest drop is $5,371 million, or 21.4%, in a year when total revenue rose 65.5%, from $130,497 million to $215,938 million.
Quarters sharpen the picture. China was $8,142 million of $35,082 million in the third quarter of fiscal 2025, or 23.2%, and $2,973 million of $57,006 million a year later, or 5.2%. Over nine months the share fell from 18.9% to 11.2%. Meanwhile the United States rose from 51.8% to 59.4% and 69.3% across the three years.
The revenue tables do not say why China fell. The fiscal 2026 annual report records export-control history. In April 2025, Nvidia states, the US government informed it that a licence is required to export H20 chips to China, including Hong Kong and Macau, and to companies headquartered there. Nvidia took a $4.5 billion charge in the first quarter of fiscal 2026 for H20 excess inventory and purchase obligations.
The filing adds that licences were granted in August 2025 for certain H20 products to certain China-based customers, generating about $60 million of H20 revenue. It says US officials expressed an expectation of 15% or more of that revenue, with no regulation published. In February 2026 a licence allowed small amounts of H200 to specific China-based customers, and Nvidia reports no revenue under it.
Taiwan and the limits of headquarters
Why Headquarters Is Not Where Chips End Up
Taiwan shows the limit of the new count. By billing location it was 15.8% of fiscal 2025 revenue and by headquarters 18.1%. In fiscal 2026 it is $42,345 million, or 19.6%.
Nvidia then qualifies what that figure means: "In fiscal year 2026, we estimate 76% of Data Center revenue from Taiwan-headquartered customers was attributed to end customers based in the United States and Europe." The estimate is Nvidia's and covers Data Center revenue only.
A headquarters count sits closer to the buyer than a billing address, but it is not a delivery map. The filing says so: "The end customer and shipping location may be different from our customers' headquarters location." A customer headquartered in the United States may run chips abroad, and one headquartered in China may run them elsewhere.
Every figure in the post
All 63 Regional Revenue Figures, by Billing and Headquarters Basis
Dollar figures are Nvidia's, in millions, as filed with the SEC. Singapore appears only on the billing basis. The headquarters rows are Nvidia's recast figures and have no Singapore line.
Customer billing location
FY2023
United States
8292
30.74
Customer billing location
FY2023
Taiwan
6986
25.9
Customer billing location
FY2023
China (incl. Hong Kong)
5785
21.45
Customer billing location
FY2023
Other
3623
13.43
Customer billing location
FY2023
Singapore
2288
8.48
Customer billing location
FY2024
United States
26966
44.26
Customer billing location
FY2024
Taiwan
13405
22.0
Customer billing location
FY2024
China (incl. Hong Kong)
10306
16.92
Customer billing location
FY2024
Singapore
6831
11.21
Customer billing location
FY2024
Other
3414
5.6
Customer billing location
FY2025
United States
61257
46.94
Customer billing location
FY2025
Singapore
23684
18.15
Customer billing location
FY2025
Taiwan
20573
15.77
Customer billing location
FY2025
China (incl. Hong Kong)
17108
13.11
Customer billing location
FY2025
Other
7875
6.03
Customer billing location
H1 FY2025
United States
26518
47.28
Customer billing location
H1 FY2025
Taiwan
10113
18.03
Customer billing location
H1 FY2025
Singapore
9659
17.22
Customer billing location
H1 FY2025
China (incl. Hong Kong)
6158
10.98
Customer billing location
H1 FY2025
Other
3636
6.48
Showing 1-20 of 63
Page 1 of 4
Download this data (CSV)Compiled by FactsFigs from Nvidia's annual and quarterly reports filed with the US SEC. Shares are FactsFigs' arithmetic. Free to use with credit to FactsFigs.
Source: Nvidia annual reports (Form 10-K, fiscal 2025 and 2026) and quarterly reports (Form 10-Q, quarters ended 27 July and 26 October 2025), filed with the SEC. H1, Q2, Q3 and 9M mean the first six months, second quarter, third quarter and first nine months of the fiscal year. Shares are FactsFigs' arithmetic on each period's reported total.
Limits and verdict
What the Filings Cannot Tell You About Chip Destinations
Nvidia's filings answer one question clearly: which customer location each revenue dollar is attributed to, first by billing address and now by headquarters. They barely answer where the products go. The one shipping figure is Singapore's, under 2% of fiscal 2025 revenue, and the fiscal 2026 annual report does not repeat it.
Four limits apply. Only fiscal 2024 and fiscal 2025 exist on both bases, so billing shares from other years cannot be set against headquarters shares. Nvidia's 99% statement and its Taiwan estimate are the company's own and cover narrow slices of revenue. Fiscal 2026 means the year to 25 January 2026. And every dollar figure is Nvidia's as filed, with shares and differences calculated by FactsFigs.
So Nvidia revenue by country has no single answer. Billing location says where invoices went, headquarters says where customers are based, and neither says where the chips are running. For the spending side of AI infrastructure, see our ranking of Big Tech capex.
The data behind this story comes from four Nvidia filings with the US Securities and Exchange Commission: the annual reports on Form 10-K for fiscal 2025 and fiscal 2026, and the quarterly reports on Form 10-Q for the quarters ended 27 July and 26 October 2025. The figures are Nvidia's as filed with the SEC and compiled by FactsFigs. Shares and differences are FactsFigs' arithmetic, and full credit for the underlying numbers goes to Nvidia.
FactsFigs reviews, cleans and cross-checks every source dataset before shaping it into a data story. Each visualization is created and designed in FactsFigs Design Studio, an internal tool developed and owned by FactsFigs, and is the original work of a FactsFigs author, not an AI-generated copy of any existing graphic. Individual assets within a visual may or may not be produced with AI tools, but the design of the visual itself is solely FactsFigs' own.
Figures are estimates at the time of publication, provided for information only. Nothing here is financial advice or a guarantee of accuracy.
Last verified: 15 Nov 2026
The charts in this article were built with our own publishing system. See what it does →