TL;DR: Which Asian Countries Actually Run on Solar?
Lebanon leads at 30%, while China's 1,202 GW covered 8.3% of its demand in 2024
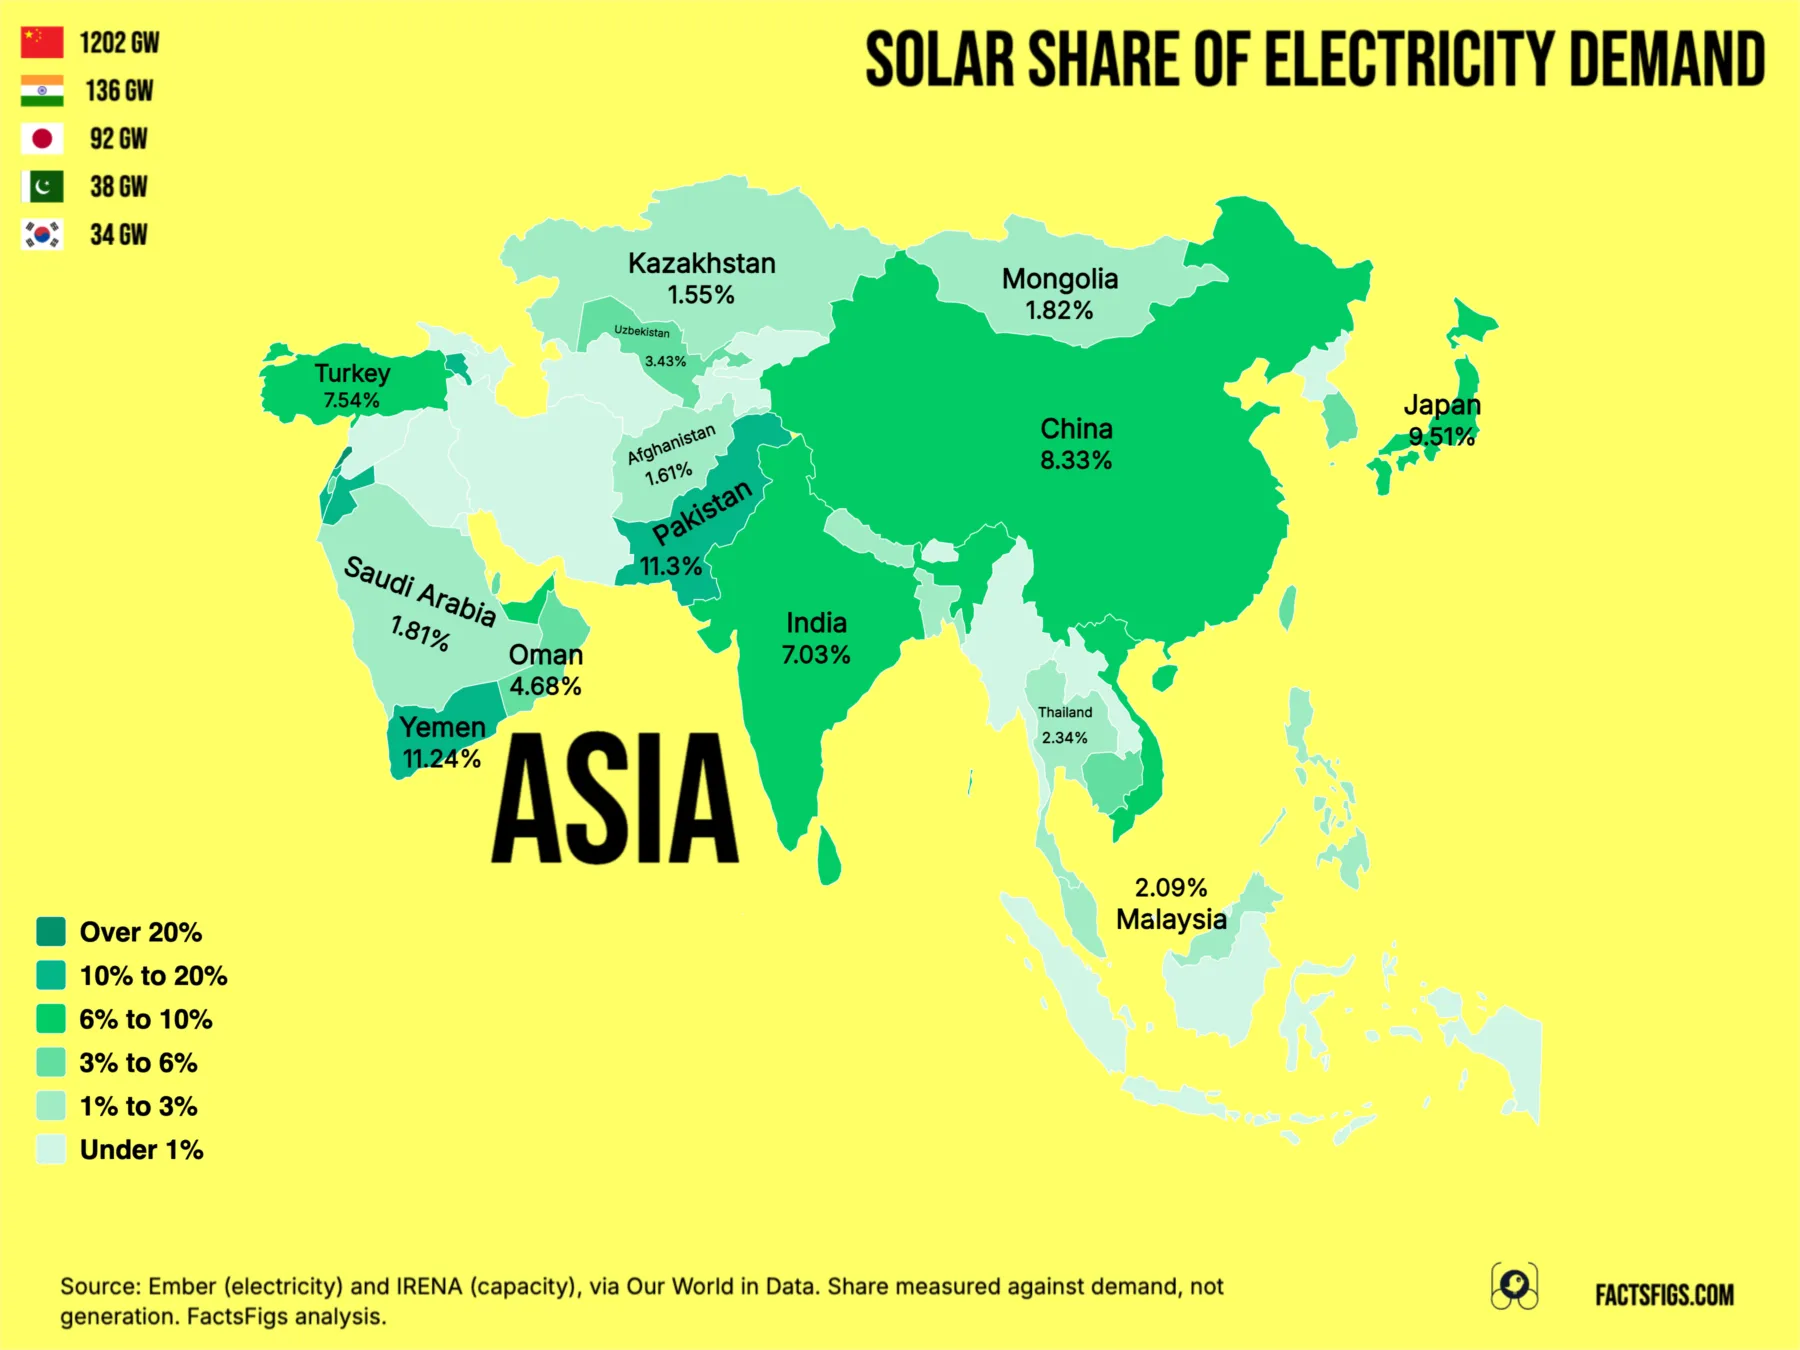
Measured against electricity demand in 2024, Lebanon tops Asia at 29.96%, followed by Jordan (16.56%), Israel (14.22%), Armenia (11.52%), Pakistan (11.30%) and Yemen (11.24%). Those six countries hold 50.2 GW of solar, just 3.1% of Asia's 1,634.2 GW.
China holds 1,202.2 GW, 73.6% of Asia's capacity, yet solar covered 8.33% of its demand in 2024 and 11.1% in 2025. Reliance has different causes: failed grids in Lebanon and Yemen, a tariff shock in Pakistan, targets in Jordan and Israel.
! What Drives Reliance on Solar:
•
Failed Grids · Lebanon and Yemen:Lebanon's utility supplies about a third of demand; Yemen's grid was badly damaged. Households turned to solar by default.
•
Policy-Led · Jordan and Israel:Working grids, with Israel a net exporter, reached 14% to 17% through renewable targets.
•
Price Shock · Pakistan:Tariffs rose 290% from 2014 to 2023, and 27 GW of mostly rooftop solar was added in two years.
? The Numbers Behind the Map:
•
Asia total installed solar:1,634.2 GW across 49 countries, end of 2025
•
Pakistan's capacity:38 GW, fourth in Asia, against IRENA's 3.717 GW
•
Rank correlation, capacity vs share:+0.69, so bigger fleets generally do rely more
Gigawatts show what a country has built; share of demand shows how much it leans on it. The two usually agree, and the exceptions, Lebanon and China, are the story.
Continue reading below for the full detailed article →
Overview
Why Gigawatts Alone Don't Show Who Runs on Solar
Ranking Asia by installed solar is easy: China first, India second, Japan third. It answers how much has been built, not how much a country depends on it. For that you need solar's share of the electricity a country actually uses, and that ranking puts Lebanon, Jordan and Israel at the top and China tenth.
We measure each share against electricity demand, not generation, for 2024, across 49 Asian countries, using IRENA capacity and Ember electricity data processed by Our World in Data. The sections below take the leaders in turn, then explain why China's 1,202 GW buys so little share.
The Three Numbers That Frame Asia's Solar Ranking
The highest reliance in Asia, the concentration of capacity behind it, and a fleet that official statistics barely counted.
29.96% of Lebanon's Power Demand From Solar
29.96%
In 2024 solar supplied 1.60 TWh of the 5.34 TWh Lebanon generated, and the country imported no electricity, so demand equals generation. That is the highest share in Asia, nearly twice second-placed Jordan's 16.56%. It sits on a shrunken base: recorded generation fell almost 80% between 2019 and 2022, and the state still supplies only about a third of demand.
73.6% of Asia's Solar Capacity Is in China
73.6%
China's 1,202.2 GW is 73.6% of the 1,634.2 GW installed across 49 Asian countries, and with India's 135.5 GW the two hold 81.9%. Yet solar covered only 8.33% of China's electricity demand in 2024. Ember puts the 2025 figure at 11.1%, a rise driven by a fleet that grew 35.5% in one year.
38 GW: Pakistan's Fleet Is Fourth in Asia
38 GW
Ember and Renewables First estimate 38 GW of mostly rooftop solar in Pakistan by June 2025, 27 GW of it added in two years. That puts Pakistan fourth in Asia, ahead of South Korea's 34.0 GW. IRENA still reports 3.717 GW, a figure that excludes distributed systems and was carried forward unchanged from 2024 to 2025.
Lebanon by the Numbers
Lebanon's Solar Share of Demand, 2024 29.96 %1.60 TWh of 5.34 TWh, with no net electricity imports.
Recorded Generation Lost, 2019 to 2022 80 %From 21.59 TWh to 4.37 TWh, so a shrinking base explains part of the rise in share.
Hours of State Power a Day, at Best 8 to 10 hoursEnergy Minister Joe Saddi, 29 December 2025: 8 to 10 hours, with the utility supplying about a third of demand.
Why Palestine and Afghanistan Are Not in the Top Ten
Both import most of their electricity: 87.6% in Palestine and 85.5% in Afghanistan. Dividing solar by the little they generate at home flatters them, and Our World in Data's published share-of-generation series does exactly that. Divided by demand, as here, they fall to 4.88% and 1.61%.
Lebanon
How Lebanon Went From 0.6% to 30% in Three Years
Solar was 0.56% of Lebanon's recorded generation in 2019 and 28.8% in 2022; in 2024 it was 29.96% of demand. The cause is the grid, not the climate. A financial crisis began in late 2019, and by summer 2021 the state had failed to secure the foreign currency to buy fuel, Human Rights Watch reported. Since then Électricité du Liban has struggled to supply more than one to three hours a day.
Households and businesses filled the gap with panels, batteries and diesel generators, an industry HRW valued at around $3 billion. LBCI reported imports of solar panels and batteries rising from $54 million in 2021 to $930 million in 2022. IRENA counts 1.505 GW of solar. On 29 December 2025 Energy Minister Joe Saddi said existing capacity delivers 8 to 10 hours a day at best, with the utility supplying about a third of demand.
Treat the 29.96% with care. Recorded generation fell about 80% from 2019 to 2022, so part of the rise is a shrinking denominator, and the share dipped to 22.3% in 2023. We also could not confirm whether Ember's figure includes private diesel generators, which the World Bank estimated supplied 8.1 of Lebanon's 22 TWh in 2018. If excluded, the share overstates solar's weight in what households use.
Jordan and Israel Show Solar Doesn't Need a Broken Grid
If solar only won where grids failed, Jordan and Israel would not be second and third. Solar met 16.56% of Jordan's demand and 14.22% of Israel's on working grids: Ember's data show Jordan importing just 0.06 TWh of 23.7 TWh, and Israel a net exporter of 6.4 TWh.
Both got there by policy. Renewables supplied about 27% of Jordan's electricity in 2024, per Ministry of Energy data, and its energy minister said in May 2025 that the 31% target could arrive in 2027 or 2028, ahead of 2030. Israel, with 7.363 GW, targets 30% renewable electricity by 2030, and its 2025 solar share is already 16.2% in Ember's data.
So the same percentage can come from a failing grid or from a plan. The map cannot tell them apart; the history can.
Pakistan
Why Pakistan's Rooftop Solar Boom Outran the Official Count
Why Households Bought · Tariffs Up 290%
For a household using 230 kWh a month, overall tariffs rose 290% between 2014 and 2023, the International Growth Centre found. Ember and Renewables First put grid power at about PKR 40 a kWh, against about PKR 20 for solar with a medium battery and about PKR 120 for diesel. Ember linked the 17 GW of panels imported in 2024, double 2023, to expensive contracts with privately owned thermal plants.
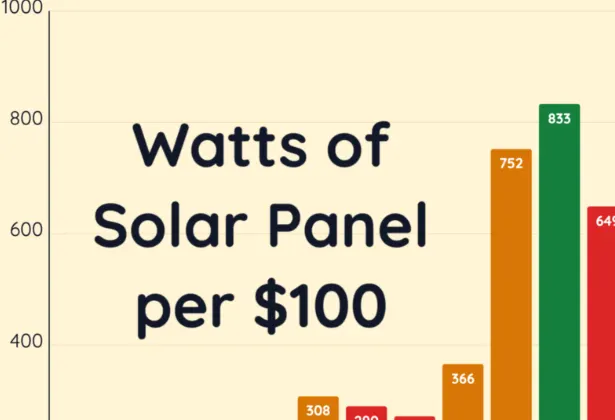
Reliability pushed too: Ember says distributed solar has eased chronic daytime loadshedding. Residential systems account for 16.9 GW, industry about 10 GW, agriculture 8.1 GW and commerce 3.3 GW. Cheaper hardware helped, since $100 bought 6.1 times the watts of bare panel in 2025 that it did in 2015. A 2026 shift to net billing trimmed the household advantage.
Why We Use 38 GW · Not IRENA's 3.717 GW
IRENA reports 3.717 GW, identical in 2024 and 2025, and its series excludes distributed and rooftop systems. It cannot be right: the 19.84 TWh of 2024 solar generation in the data would need a capacity factor above 60% from that fleet, against IRENA's own 17.4% global average for new utility-scale plants (our arithmetic). So Pakistan's row uses Ember and Renewables First's 38 GW at the end of June 2025.
The 38 GW was triangulated three ways: Chinese export data gives 47 GW cumulative, an upper bound; TransitionZero satellite imagery gives 27.5 GW; a survey of 5,300 households and businesses gives 33 GW. The official register is far smaller: net metering held 4,124 MW at the end of 2024, against 17 GW of panels imported that year.
The map's 11.3% is a calendar-2024 figure on a demand basis. Ember and Renewables First estimate distributed solar alone at 28% of generation in fiscal 2025 (July 2024 to June 2025), up from 10% in fiscal 2023, but that is a different year and basis, so it stays out of the ranking.
Yemen and Afghanistan: Real Solar Stories, Shaky Numbers
Yemen's 11.24% rests on a real collapse. The International Growth Centre found in November 2021 that three-quarters of households with electricity got it from solar, calling it "not a story of success, but rather of the collapse of the grid, such that solar power represents a much larger share of a dramatically reduced overall supply." The systems are tiny: about 250 W in cities, under 100 W in rural areas.
The number is less stable than the story. Ember's recorded generation for Yemen jumped 69% from 2022 to 2023, to 5.12 TWh, while solar barely moved, cutting the measured share from 16.8% to 10.2%.
Afghanistan's measured 1.61% understates a different reality. A World Bank and Samuel Hall survey, sampled from June 2018 to May 2019, found about 57% of households used solar home systems as their main electricity and about one in three had grid access. It is a research sample, not a census, and small systems supply little energy, which is probably how both facts hold. Ember counts 85.5% of Afghanistan's supply as imported.
China and Saudi Arabia
Why China's 1,202 GW Covers Only 8% to 11% of Demand
Capacity is a stock; share is a flow. IRENA puts the global weighted-average capacity factor for utility-scale solar commissioned in 2024 at 17.4%, within a range of 11.5% to 22.6%, so a gigawatt yields roughly 1.5 TWh a year (8,760 hours at 17.4%, our arithmetic). China generated 10,087 TWh in 2024, and its demand grew 5% in 2025.
Coal still produced 54% of China's electricity in 2025, down from 70% in 2015, according to Ember. Solar rose from 8.33% of demand in 2024 to 11.1% of electricity in 2025 as the fleet grew 35.5%, from 887.1 GW to 1,202.2 GW.
Saudi Arabia shows the timing effect: 11.9 GW, ninth in Asia, yet 1.81% of demand in 2024, because capacity went from 2.44 GW at the end of 2023 to 6.20 GW in 2024 and 11.93 GW in 2025, on a 454.6 TWh grid that burns almost entirely gas and oil.
The build is not slowing: IRENA says Asia added 371.2 GW of solar in 2025, up from 317.1 GW in 2024, out of 511 GW worldwide. Because this ranking pairs 2025 capacity with 2024 shares, fast builders are understated; Israel is 16.2% in 2025.
What the Ranking Shows
Does Building More Solar Mean Relying on It More?
Mostly yes, and the exceptions are the story. Across the 49 countries the rank correlation between installed capacity and share of demand is +0.69: bigger fleets generally carry more of the load, partly because 21 countries have under 1 GW and sit near the bottom of both lists. China, India, Japan, Pakistan and South Korea hold 91.9% of Asia's capacity.
The break is in the middle. The six countries above 10% hold 50.2 GW, 3.1% of the total, and what unites most of them is circumstance, not size: failed grids in Lebanon and Yemen, a price shock in Pakistan, plans in Jordan and Israel. Armenia reaches 11.52% from 0.706 GW; we did not research its drivers.
No Asian country gets even a third of its electricity from solar. Where it carries real weight, something else gave way or someone decided it should.
The Full Data Table
All 49 Asian Countries by Solar Share of Electricity Demand
Solar's share of electricity demand in 2024, installed capacity at the end of 2025 and each country's share of Asia's 1,634.2 GW. Ties share the same rank.
Share is solar generation divided by electricity demand (domestic generation plus net imports), 2024. Pakistan's capacity is Ember and Renewables First's 38 GW estimate, not IRENA's 3.717 GW. Maldives is carried forward; Syria's and Iraq's capacity and generation do not reconcile.
Method and Limits
How This Ranking Was Built, and Where It Is Weak
Capacity is end-2025; share is 2024. Ember's own 2025 shares cover only 28 of the 49 countries, so 2024 is the only year that keeps all of them, and it understates fast growers: China is 8.33% for 2024 but 11.1% for 2025.
Share is solar divided by demand: domestic generation plus net imports. Our World in Data's published series divides by generation, which inflates import-dependent places. Only 5 of the 49 countries move by more than one percentage point; Lebanon and Yemen, which import nothing, do not.
Asia follows Our World in Data's regions: Turkey, Georgia, Armenia and Azerbaijan are in; Russia and Cyprus count as Europe, Egypt as Africa. We downloaded the full global datasets from Our World in Data and filtered the 49 Asian countries ourselves, so this is FactsFigs' cut, not a view Our World in Data publishes.
Pakistan's capacity comes from a different source than the other 48 rows, and its 11.3% share is not a like-for-like measure of that fleet. Weak rows: the Maldives is carried forward, with identical figures for 2022 to 2024, and Syria's and Iraq's capacity and generation do not reconcile. Capacity bases (AC or DC) may differ by country.
FactsFigs reviews, cleans, and cross-checks every source dataset before shaping it into a data story. Each visualization is created and designed in FactsFigs Design Studio - an internal tool developed and owned by FactsFigs - and is the original work of a FactsFigs author, not an AI-generated copy of any existing graphic. Individual assets within a visual may or may not be produced with AI tools, but the design of the visual itself is solely FactsFigs' own.
Figures are estimates at the time of publication, provided for information only - nothing here is financial advice or a guarantee of accuracy.
Last verified: 27 Oct 2026
The charts in this article were built with our own publishing system. See what it does →