A bare panel buys 6.1 times the watts it did in 2015. A finished US rooftop is only about 1.4 to 1.5 times cheaper.
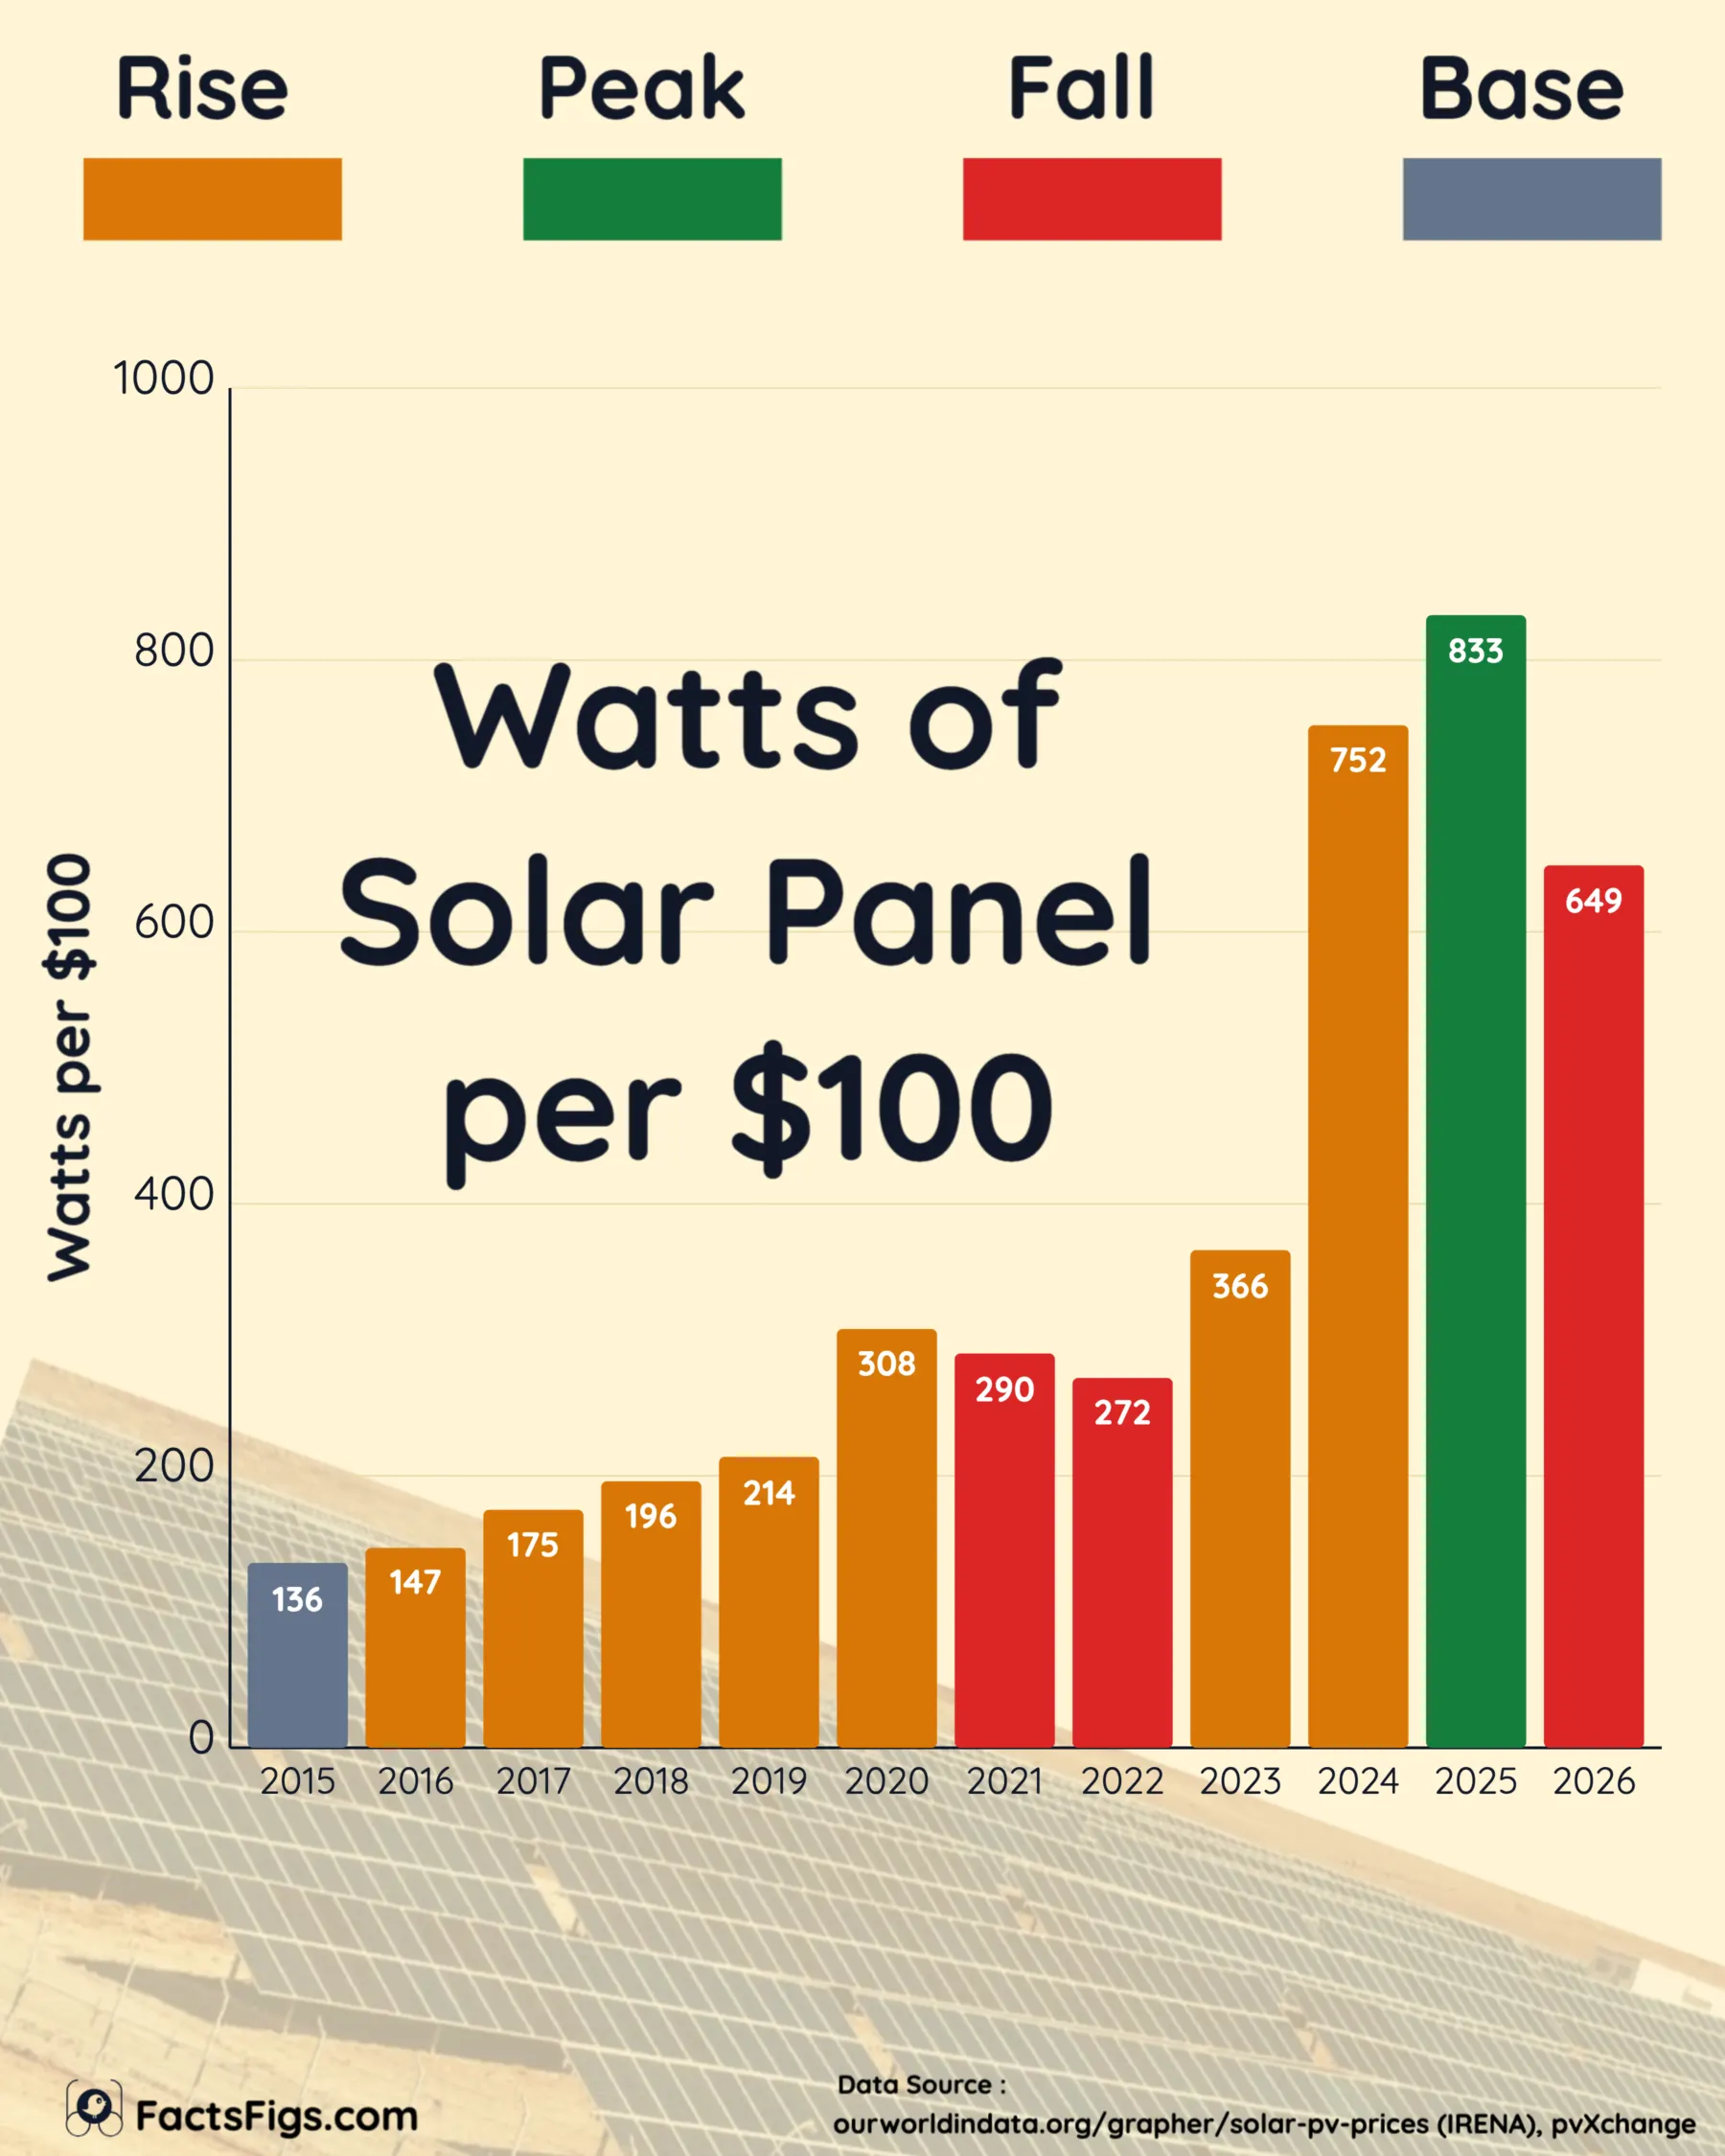
In 2015 one dollar bought 1.36 watts of solar panel. In 2025 it bought 8.33, a 6.1-fold gain, before a July 2026 European price of $0.154 a watt pulled it back to 6.49. Scaled to $100, that is 136 watts, then 833, then 649.
The panel is no longer where the money goes. NREL's model puts a US rooftop at $2.95 a watt, so $100 buys about 34 watts of working system, and the US installed price fell only a quarter to a third over the decade.
! What the Panel Price Tells You:
•
The Climb, 2015 to 2025:Watts per $100 rose from 136 to 833, with dips in 2021 and 2022 and a near-doubling in 2024, from 366 to 752.
•
The 2026 Reversal:July 2026 cut $100 to 649 watts, down 22.1 per cent, the largest one-year fall in the series, after China ended its 9 per cent export VAT rebate.
•
The Missing Costs:Permits, selling, installer profit, inverters and racking make up most of a US rooftop's $2.95 a watt, and a battery takes it to $4.59.
? The Numbers Behind the Story:
•
2015 vs 2025:136 vs 833 watts per $100, a 6.1-fold gain
•
Module price:$0.736 to $0.120 a watt, down 84 per cent
•
US rooftop:$2.95 a watt installed, so $100 buys about 34 watts
Panels got dramatically cheaper and 2026's uptick has not undone it. But the panel is a small part of what a household pays, so the saving mostly stayed upstream of the rooftop. The soft costs of selling, permitting and installing still decide the bill.
Continue reading below for the full detailed article →
Overview
The Panel Got Cheap. The Rooftop Bill Mostly Did Not
Ask how much solar a dollar buys and the best-documented answer is the price of the bare panel. IRENA's benchmark, republished by Our World in Data, has it falling from $0.736 a watt in 2015 to $0.120 in 2025, in constant 2025 dollars. This story turns that price into watts per $100, so the gain reads as a gain.
It answers a narrower question than it appears to. A panel produces nothing until it is mounted, wired, permitted and connected, and those steps cost more than the glass and silicon. The sections that follow trace the 2015 to 2025 climb, the 2026 reversal, and then the rest of the bill, which is where the saving thins out.
The Three Numbers Behind the Panel-Versus-Rooftop Gap
The watts a hundred dollars of panel buys, how far the panel price fell, and what a working US rooftop costs.
833 watts per $100 in 2025
833 W per $100
At $0.120 a watt in constant 2025 dollars, $100 bought 833 watts of bare panel in 2025, the peak of the series and 6.1 times the 136 watts it bought in 2015. The figure covers the module alone, priced as a global benchmark, so it is a ceiling on what a hundred dollars of working solar could ever deliver.
84% cheaper per watt since 2015
84%
The module price fell from $0.736 a watt in 2015 to $0.120 in 2025, a drop of 84 per cent in constant 2025 dollars, or a factor of 6.1. IRENA's 2026 report describes module prices falling roughly two-thirds between 2022 and 2024 alone, the sharpest stretch of decline anywhere in this series.
$2.95 a watt installed, no battery
$2.95 per W
NREL's model prices a US residential rooftop with no battery at $2.95 a watt in the first quarter of 2025. At that rate $100 buys about 34 watts of working system, roughly a twenty-fifth of what the bare panel buys. Over the decade the benchmark fell about 27 per cent in real terms, against 84 per cent for the module.
The 2025 Panel by the Numbers
Module price, 2025 $0.12 per W$0.120 a watt in constant 2025 dollars, down from $0.736 in 2015.
Share of NREL's US rooftop 4 %About 4 per cent at the global price; 10.9 per cent at NREL's $0.321.
Panels on an 8 kW system $960 About $960 of module inside a $23,600 modelled system.
The Climb
How Did $100 of Panel Go From 136 Watts to 833?
From 2015 to 2019 the climb was steady: 136, 147, 175, 196 and 214 watts per $100. Then the series jumps 44 per cent in 2020, to 308, partly market movement and partly a change of yardstick, since the data switches from IRENA's global price index to its Mainstream crystalline benchmark there.
Two years of slippage follow. A hundred dollars bought 290 watts in 2021 and 272 in 2022, falls of 5.8 and 6.0 per cent, as the module price drifted up from $0.325 to $0.367 a watt.
Then the floor drops out. Between 2022 and 2024 the module price falls from $0.367 to $0.133, a 64 per cent cut that IRENA's 2026 report summarises as roughly two-thirds, and watts per $100 more than double, from 366 in 2023 to 752 in 2024. The peak is 833 in 2025, at $0.120 a watt.
The 2026 Reversal
Why Did $100 Buy Less Solar in 2026? A Rebate and a Margin
The July 2026 benchmark is pvXchange's mainstream European module price of EUR 0.135 a watt, which is $0.154 at that month's average rate of 1.1423 dollars to the euro. A hundred dollars buys 649 watts at that price, down 22.1 per cent from 833 in 2025. It is the largest one-year fall in the series, though not the first: 2021 and 2022 also fell.
One cause is dated. China ended its export VAT rebate on solar products on 1 April 2026. That is the whole of the 'export tax change' some reports describe: the rebate had already been cut from 13 to 9 per cent on 1 December 2024, so April removed the remaining nine points. In January, pvXchange's Martin Schachinger put its weight at about 9 per cent.
It cannot be the whole story. European mainstream prices rose 28.6 per cent between January and July, and pvXchange said in February that the rise was not linked to raw materials or the export subsidy but to manufacturers restoring margins after a long run of losses. Chinese solar glass prices fell 7.5 to 14.8 per cent so far this year, per TaiyangNews. IRENA and Fraunhofer ISE name the rebate alongside rising material and shipping costs. The sources disagree on the weights, so we assign none.
Nor is it only European. OPIS's China export price for TOPCon modules rose from about $0.088 a watt in October 2025 to $0.120 in March 2026, then eased to $0.107 by 20 October, while a US imported TOPCon price of $0.290 delivered sits higher still, in OPIS data reported by pv magazine USA. This series is a European price, not a global one.
The Gap
How Many Watts of Solar Can $1 Buy Once It Is on a Roof?
About a third of a watt of working system, against 8.33 watts of bare panel. NREL's Q1 2025 benchmark prices a modelled 8 kW US home system with no battery at $2.95 a watt, so $1 buys 0.34 watts and $100 buys 34. At LBNL's reported median of $3.60 a watt for 2025 installs it buys about 28. Add a 13.5 kWh battery and NREL's $4.59 a watt leaves $100 with 22 watts.
The decade's progress is harder to find. NREL's Q1 2015 benchmark was $3.11 a watt in 2016 dollars, about $4.07 in 2024 dollars, so $2.95 is a 27 per cent fall against 84 per cent for the module. The two benchmarks differ in system size and cost model, so read that as direction, not an exact before and after. LBNL's reported medians, read off its charts for 2015, imply a quarter to a third.
LBNL, which tracks what US customers report paying, says declines were most pronounced through 2014, driven by modules, and since then have come at "a more modest pace of $0.1-0.2/W per year, on average, driven primarily by changes in soft costs and other balance of system costs." Soft and other non-module costs are roughly 80 per cent of the installed price.
There is no single US price: marketplace quotes ran $2.50 a watt in late 2024, NREL gives $2.95, IEA PVPS $2.9, and LBNL's reported medians $3.6 to $4.0. Treat every figure as a range.
The Bill
Where Does the Rest of a $2.95 Rooftop Watt Go?
NREL's model splits the $2.95 into seven parts. The module is $0.32 a watt, 10.9 per cent. The inverter is $0.36 (12.1 per cent), electrical wiring and equipment $0.31 (10.3), installation labour $0.25 (8.3) and racking $0.23 (7.7). Hardware as a group is about 41 per cent of the total, and the other 59 per cent is soft cost.
The largest slice is officework at 30.7 per cent, or $0.91 a watt. Inside it, customer acquisition alone is $0.43 a watt, a fixed $3,472 per system, and permits and jurisdictional fees add $0.27. Another 20 per cent sits under 'other', led by installer profit at $0.36 a watt, with management overhead, distributor markup and sales tax making up the rest.
Three cautions. The no-battery split is derived: NREL publishes its full breakdown only with a battery, so we rebuilt the rest from the model's inputs. NREL's module is US-assembled from imported cells at $0.32 a watt, not the $0.12 global price, which would be about 4 per cent of the system. And the model excludes electrical service upgrades and roof repair, so real installs can cost more.
The rooftop, itemised
How NREL Splits a $2.95-a-Watt US Rooftop, Q1 2025
A modelled 8 kW home system with no battery, in 2024 dollars, at NREL's modelled market price. Ranked by share of the total.
Source: NREL (now National Laboratory of the Rockies), Q1 2025 PV System Cost Benchmarks. The no-battery split is derived by FactsFigs from NREL's published PV-plus-battery breakdown and model inputs; the total is NREL's published $2.95. Shares may not sum exactly because of rounding.
The Other Hardware
Why Did Inverters and Racking Never Follow the Panel Down?
Inverters did not deflate like modules. NREL's Q1 2016 benchmark carried the inverter at $0.21 a watt in 2016 dollars, about $0.27 in 2024 dollars; the Q1 2025 model has $0.357. The match is imperfect, since 2025 assumes microinverters, one per panel, while the 2016 mix was mostly string inverters and microinverters were about $0.39 a watt in that report's own options table. The direction is still opposite to the panel's.
Inverters also wear out first. EnergySage, via pv magazine, puts string inverter life at 10 to 15 years against 'often' 25 for microinverters. We found no non-vendor source for a replacement price, so we quote none.
Racking points the same way: NREL's structural balance of system went from $0.12 a watt in 2016 dollars, about $0.16 in 2024 dollars, to $0.227. The metals have not deflated either. Aluminium, which NREL's rails and clamps are made of, is up about 16 per cent in real terms since 2015, and steel, by the US producer price index, about 18 per cent (our calculation from IMF and BLS data, deflated by US consumer prices).
Storage
What Does a Battery Add to the Cost of a Rooftop?
A great deal. NREL's modelled system with a 13.5 kWh battery costs $4.59 a watt, $1.64 more than the $2.95 without one, or about $13,100 on 8 kW. That is roughly $970 per kilowatt-hour installed. LBNL's reported prices agree on direction: among cash purchases in 2025, paired solar and storage cost a median $2.1 a watt more than stand-alone solar.
The cells are a sliver of that. NREL's model puts them at about $87 per kWh, around 9 per cent of the installed battery cost; the rest is packaging, power electronics, labour, a fixed $3,542 of customer acquisition and margin. BloombergNEF's average pack price hit a record $108 per kWh in 2025, down 8 per cent.
It is the panel's pattern again: the component gets cheaper and the installed product much less so. Batteries are no longer niche, either. Mercom reports that 37 per cent of new US residential solar in 2025 was paired with one, up from 25 per cent in 2024.
IRENA's July 2026 report flags a rebound in battery metal prices in early 2026 as a risk, even after the installed cost of a four-hour utility battery fell to $140 per kWh, close to 30 per cent lower in a year and around 95 per cent lower than in 2010. BloombergNEF still expects pack prices to fall further in 2026 despite rising metal prices. How long that holds depends on metals such as lithium.
Why Does a US Rooftop Cost About 6 Times a Chinese One?
The same panel travels. The installation does not. IEA PVPS's 2026 trends report puts 2025 residential system prices at about $0.46 a watt in China, $1 to $2 in many European and Asian markets, $2.90 in the United States and $3.55 in Switzerland, among the highest. The US figure is 6.3 times China's. These are indicative national ranges, not harmonised benchmarks.
With modules a smaller part of the price, IEA PVPS says differences in "labour, balance-of-system components, administrative requirements and market structures" are likely to account for the variation. NREL's model puts $0.43 a watt on customer acquisition alone, more than the modelled $0.32 module.
Germany shows the squeeze over time. IEA PVPS's 2016 national survey estimated an average turnkey system at two to three times the module price; pvXchange's notes put the multiplier at four to six in November 2021 and, in July 2026, eight to 15. That last figure is pvXchange's own and we could not verify it, so treat it as a claim, not a measurement.
The Verdict
So Is Solar Still Getting Cheaper? Mostly at the Panel
Yes, with an asterisk the size of a rooftop. A dollar of bare panel bought 6.1 times the watts in 2025 that it did in 2015, and even after 2026's reversal it buys 4.8 times as many, 6.49 watts against 1.36 (a nominal July European price, so indicative).
The installed price tells a slower story: roughly 1.4 to 1.5 times cheaper in the US, with selling, permitting and profit among its biggest items. So 'how much solar does $100 buy?' has three honest answers: 833 watts of panel in 2025, about 34 watts installed at NREL's modelled price, and 22 with a battery.
Near term, pvXchange wrote in July that further increases were unlikely this year, at least for TOPCon, and OPIS's China price had eased to $0.107 a watt by 20 October. A rise like 2026's matters less to a bill anyway: 28 per cent on NREL's $0.321 module adds about $0.09 a watt, 3 per cent of $2.95 (our arithmetic).
Watts per dollar is 1 divided by the module price. The step from 2019 to 2020 includes a change of benchmark, from IRENA's global price index to its Mainstream crystalline series. 2020 to 2025 values come from Our World in Data's draft correction (owid/etl pull request 7131), not its live chart.
Method and Limits
What the Series Counts, and What It Leaves Out
Module price only. The series excludes installation, inverters, racking, wiring, permits and labour, so 'watts per $100' means watts of bare panel, not watts of working solar.
It is spliced. 2015 to 2019 is IRENA's global price index as Our World in Data publishes it. 2020 to 2025 is IRENA's Mainstream crystalline series from Our World in Data's draft correction, owid/etl pull request 7131, still an open draft on 23 October 2026 and not matching the live Our World in Data chart. We use the corrected figures because the published series rests on a global index that IRENA's 2026 report no longer extends past 2024 and that overstates 2024 at $0.265 a watt against $0.133. The 2019 to 2020 step is therefore partly a change of benchmark, not purely a market move.
2026 is a single July 2026 European benchmark, pvXchange's mainstream EUR 0.135 a watt, converted at the month's average of 1.1423 dollars to the euro (Federal Reserve data via FRED), in nominal dollars. 2015 to 2025 are annual, in constant 2025 dollars.
System costs are NREL's modelled benchmark, built from confidential industry surveys, not a count of what households paid. Dollar years differ: NREL's are 2024, LBNL's 2025, IEA PVPS's nominal. The eight-to-15 turnkey multiplier is pvXchange's, not independently verified.
2026 is the largest one-year fall in the series, 22.1 per cent, but not the first: 2021 fell 5.8 per cent and 2022 fell 6.0 per cent.
The module price series comes from IRENA, assembled by Our World in Data from IRENA, Nemet (2009) and Farmer and Lafond (2016), and extended for 2020 to 2025 with IRENA's Mainstream series from Our World in Data's draft correction. The 2026 point is pvXchange's July 2026 European price. System costs are from NREL, now the National Laboratory of the Rockies, with further figures from LBNL, IEA PVPS, BloombergNEF and OPIS as cited in the text. Full credit for collecting and maintaining the data goes to each of them.
FactsFigs reviews, cleans, and cross-checks every source dataset before shaping it into a data story. Each visualization is created and designed in FactsFigs Design Studio - an internal tool developed and owned by FactsFigs - and is the original work of a FactsFigs author, not an AI-generated copy of any existing graphic. Individual assets within a visual may or may not be produced with AI tools, but the design of the visual itself is solely FactsFigs' own.
Figures are estimates at the time of publication, provided for information only - nothing here is financial advice or a guarantee of accuracy.
Last verified: 27 Oct 2026
The charts in this article were built with our own publishing system. See what it does →