

83%
Up from 44% in 2023. The 2026 figure is our calculation: everyone who did not say they use no AI tools.

Facts & Figures
Visual Intelligence
Stack Overflow's Developer Survey, 2023 to 2026
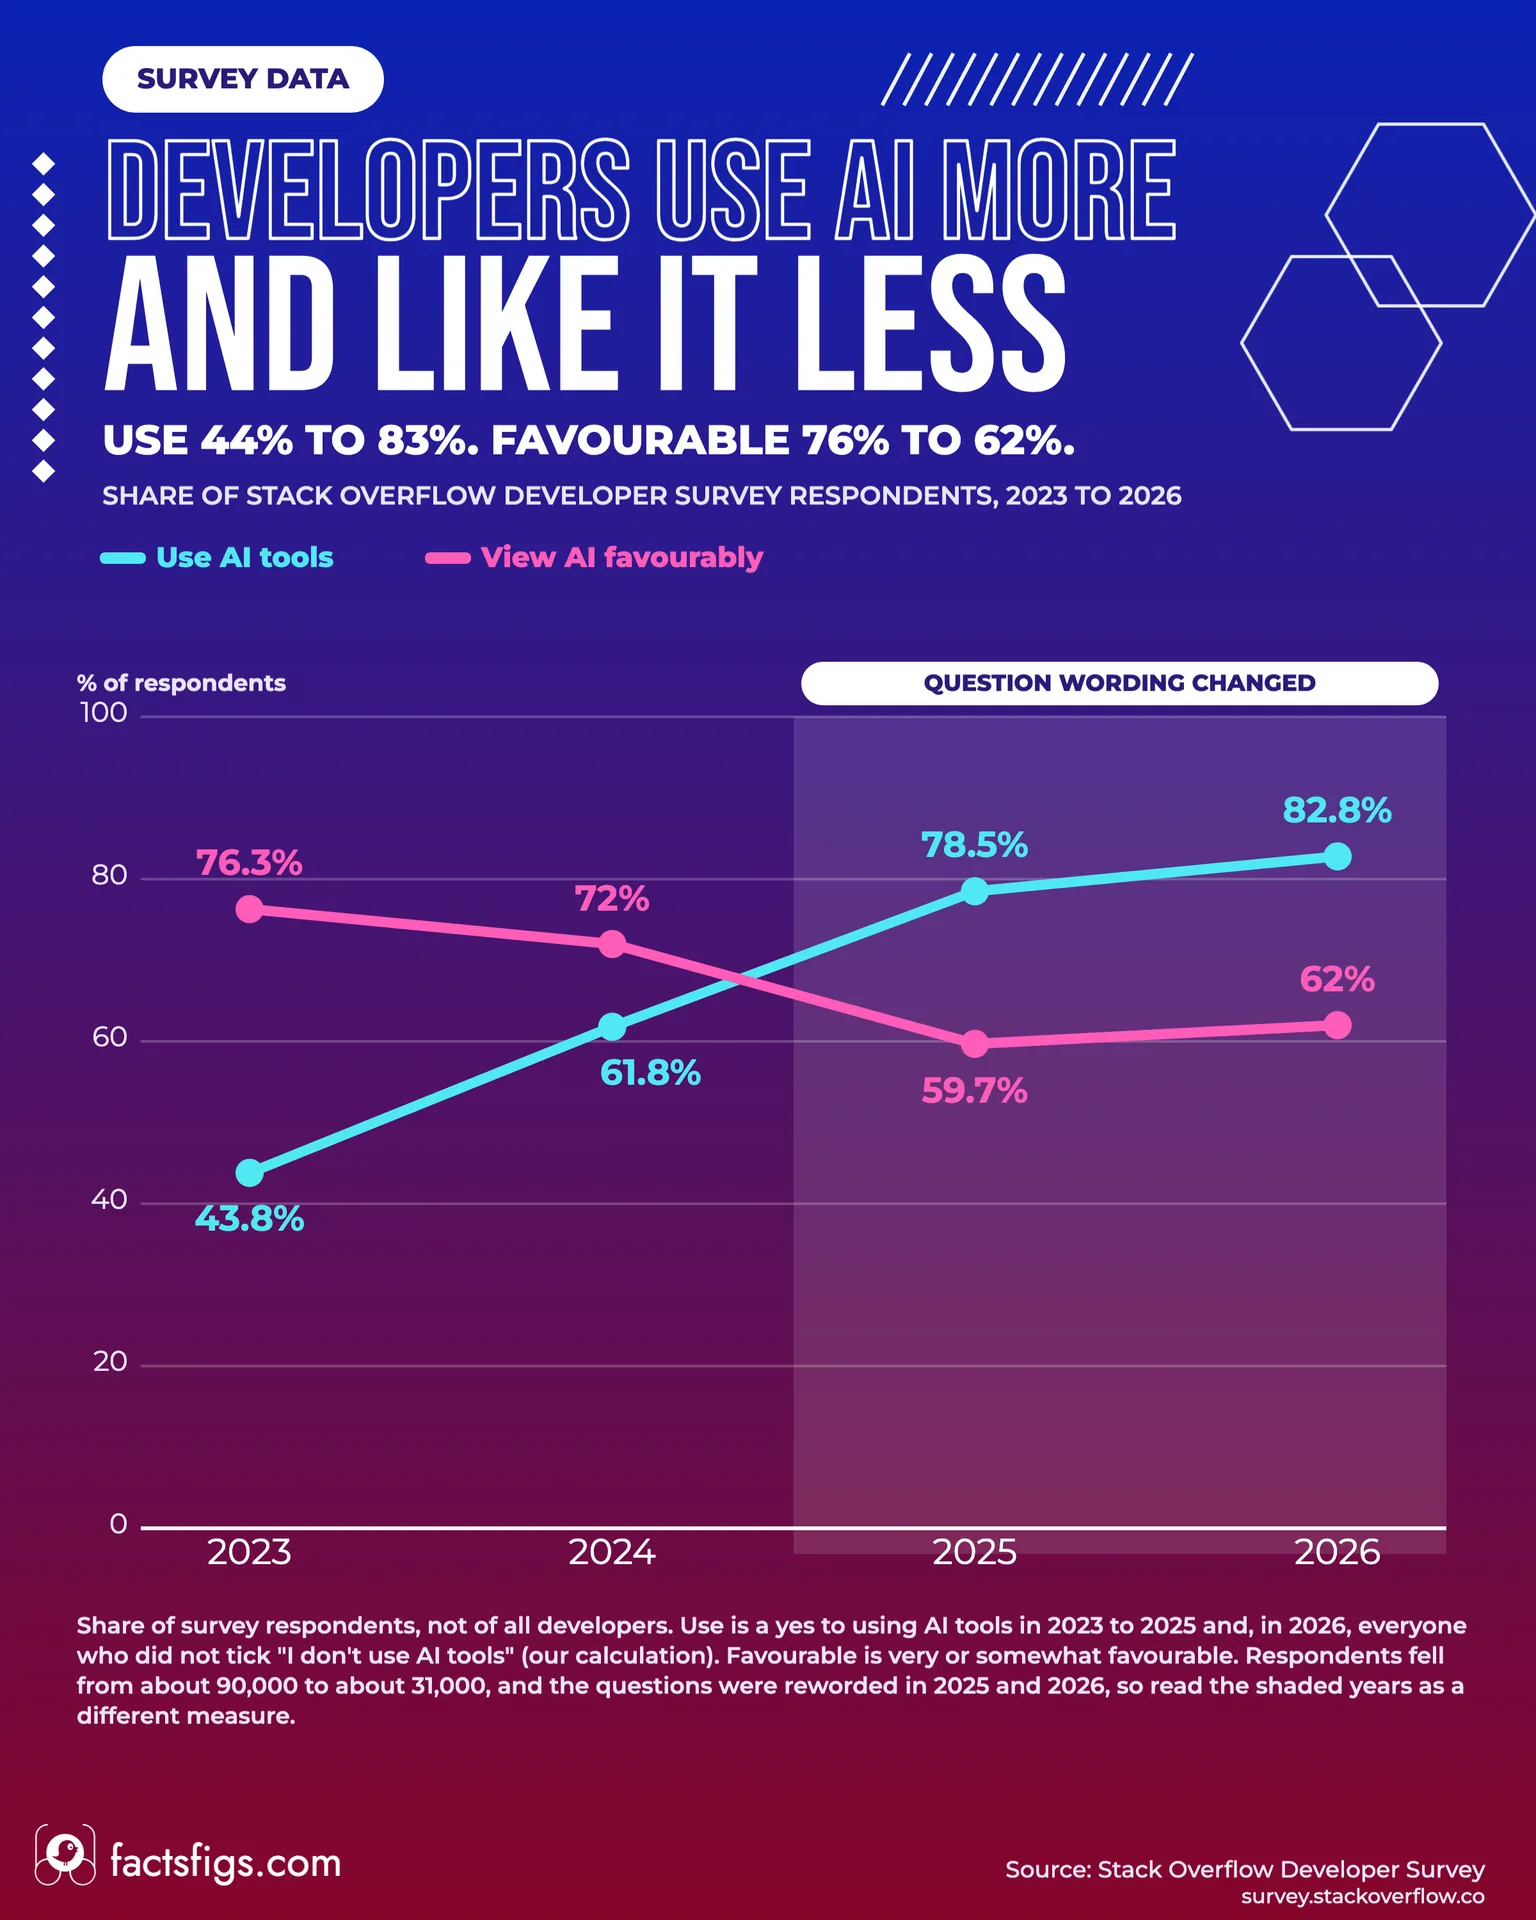
Most use them and fewer like them than in 2023. Of the respondents to Stack Overflow's 2026 survey, 82.8% used AI tools, up from 43.8% in 2023. Over the same years the share viewing AI tools favourably fell from 76.3% to 62.0%, and the share viewing them unfavourably rose from 3.2% to 21.5%. The survey was reworded in 2025 and 2026 and the number of respondents fell by about two thirds, from roughly 90,000 to 30,903. Read the direction as a guide, not a precise measure.
These are shares of people who chose to answer one survey, and its questions changed in 2025 and 2026. Read the direction of the lines, not the decimals.
Continue reading below for the full detailed article →
Overview
Stack Overflow, the question-and-answer site for programmers, runs an annual Developer Survey. The 2026 edition, its sixteenth, was open for seven weeks and drew 30,903 respondents. Since 2023 it has asked whether people use AI tools in their work and how they feel about them, and Stack Overflow publishes the results under an open database licence. This post compares the answers year by year: the share who use AI tools and the share who view them favourably. Stack Overflow's own write-up gives the first measure as 44%, 62% and 79% for 2023 to 2025. We use the underlying chapter data from its results site and show each year's respondent count in the table, because the number of people answering changed a lot.
AI tool use kept rising while the share who like the tools fell and the share who dislike them grew.
83%
Up from 44% in 2023. The 2026 figure is our calculation: everyone who did not say they use no AI tools.
22%
Unfavourable views were 3% in 2023. Favourable views fell from 76% to 62% over the same years.
33%
From 43% in 2024, though the 2025 question dropped its neutral option. Not asked in this form in 2026.
Use
Most of the developers who answer Stack Overflow's survey now do. In 2023, 43.8% said they used AI tools in their development process. In 2024 it was 61.8%, in 2025 it was 78.5% and in 2026 it reached 82.8%. That is nearly double in three years. Stack Overflow's own write-up rounds the first three figures to 44%, 62% and 79%.
The 2026 figure comes from a reworded question, so treat it as a close cousin of the earlier ones and not a match. The survey asked whether people use AI tools or AI agents in their role at work and let them tick several kinds. A total of 17.2% ticked "I don't use AI tools", which leaves 82.8% who use at least one kind. That subtraction is our own.
Use also got heavier. In 2025, 47.1% of all respondents used AI tools daily, 17.7% weekly and 13.7% monthly or less, while 5.3% planned to start and 16.2% did not plan to. In 2023 the shares who planned to start and who did not were 25.5% and 29.4%. In 2026, 73% of the respondents who use a coding assistant or coding agent use one daily.
Sentiment
A smaller share do than in 2023, although the share rose a little in 2026. Of the respondents answering the question, 76.3% were favourable towards AI tools in 2023, 72.0% in 2024, 59.7% in 2025 and 62.0% in 2026. Favourable means very favourable or favourable, and in 2026 very or somewhat favourable.
The change on the other side is larger. Unfavourable views were 3.2% in 2023 and 6.4% in 2024, then 20.5% in 2025 and 21.5% in 2026. Use rose by 39 points, the favourable share fell by 14 and the unfavourable share rose by 18. About one in five respondents now views AI tools unfavourably, against about one in 30 in 2023.
Neutral views stayed between 15% and 19% in every year, so the drop in favourable views is matched by a rise in unfavourable ones. The survey does not ask why, and we do not supply a reason.
Trust
Fewer did in 2025 than in 2024. Asked how much they trust the accuracy of AI output, 43.0% of respondents in 2024 said they highly or somewhat trusted it and 30.4% highly or somewhat distrusted it. In 2025, 32.8% trusted it and 45.7% distrusted it. Only 3.1% said they highly trusted it.
The 2025 question dropped the "neither trust nor distrust" answer, which 26.6% chose in 2024, so part of that move is the answer choices and not only opinion. The 2026 survey did not repeat the question in this form, so there is no newer figure. For a separate test of how often AI tools make things up, see our post on whether AI hallucination really gets better with newer models.
Experience
Experience matters in the 2026 data. Respondents with 6 to 15 years of work experience were the most likely to use AI tools, at 86.4%, against 84.1% for those with 16 or more years and 81.0% for those with 1 to 5 years.
Opinion rises with experience. Favourable views were 53.4% among respondents with 1 to 5 years of experience, 61.5% with 6 to 15 years and 69.5% with 16 or more years. Coding assistants and agents were used by 57.8% of the least experienced, 72.7% of the middle group and 69.6% of the most experienced.
By kind of tool, 65.9% of 2026 respondents used AI coding assistants or coding agents and 62.5% used general-purpose chat tools. Fewer used AI agents or automated workflows (26.2%) or internal tools built by their company (17.8%). For the chat tools people visit most, see our ranking of AI tools by web traffic.
Year by Year
Each year's answers to the use and favourability questions, with the number of respondents behind each. Sort any column to reorder the rows.
| 2023 | 89,184 | 43.8 | 25.5 | 29.4 | 61,501 | 76.3 | 16.5 | 3.2 |
| 2024 | 60,907 | 61.8 | 13.8 | 24.4 | 45,873 | 72 | 18.7 | 6.4 |
| 2025 | 33,662 | 78.5 | 5.3 | 16.2 | 33,412 | 59.7 | 17.6 | 20.5 |
| 2026 | 17,464 | 82.8 | n/a | 17.2 | 14,428 | 62 | 15.3 | 21.5 |
Source: Stack Overflow Developer Survey. 2025 use is the sum of the daily, weekly and monthly yes answers. 2026 use is 100 minus the share who do not use AI tools, and 2026 has no plan-to-start option. Do not use means 'No, and I don't plan to' in 2023 to 2025. Unsure answers are left out, so views do not sum to 100%. The question wording changed in 2025 and 2026.
Reading It Carefully
It is a survey of volunteers, not a count of developers. People choose to answer, and Stack Overflow's audience may differ from developers as a whole. The number of respondents fell from about 90,000 in 2023 to 65,437 in 2024, 49,019 in 2025 and 30,903 in 2026, and the 2026 survey was billed as open to human developers only. We cannot tell whether the people who stopped answering use or like AI differently.
The questions changed. The 2023 and 2024 surveys asked a yes-or-no question about use. The 2025 survey split yes into daily, weekly and monthly, and we added the three. The 2026 survey asked about use at work, added AI agents and let people tick kinds of tool. The favourability labels were favorable and indifferent until 2026, when they became somewhat favorable and neutral. The shaded years on the chart are a different measure, so comparing across them is a guide and not a measurement.
The survey does not say why views changed and neither do we. It also cannot show whether the people who use AI tools are the ones who dislike them, because these are separate shares of the same group. Stack Overflow had not released its full 2026 data set when we wrote this, so every 2026 figure comes from the chapter data on its results site.
Stack Overflow Developer Survey
The data behind this story comes from the Stack Overflow Developer Survey, published by Stack Exchange Inc. under the Open Database Licence (ODbL) 1.0, with the contents under the Database Contents Licence 1.0. Full credit for running the survey and publishing the data goes to Stack Overflow. Stack Overflow Developer Survey, Stack Exchange Inc. Published at survey.stackoverflow.co and github.com/StackExchange/Survey. Accessed 20 Nov 2026. Modified by FactsFigs: took the chapter data for the AI questions of the 2023, 2024, 2025 and 2026 surveys, summed the daily, weekly and monthly 'yes' answers in 2025, calculated 2026 use as 100 minus the share who do not use AI tools and added very and somewhat favourable answers and very and somewhat unfavourable answers.
FactsFigs reviews, cleans and cross-checks every source dataset before shaping it into a data story. Each visualization is created and designed in FactsFigs Design Studio, an internal tool developed and owned by FactsFigs, and is the original work of a FactsFigs author, not an AI-generated copy of any existing graphic. Individual assets within a visual may or may not be produced with AI tools, but the design of the visual itself is solely FactsFigs' own.
Figures are survey shares at the time of publication, provided for information only; nothing here is a forecast or a guarantee of accuracy.
Last verified: 20 Nov 2026
Related Publications
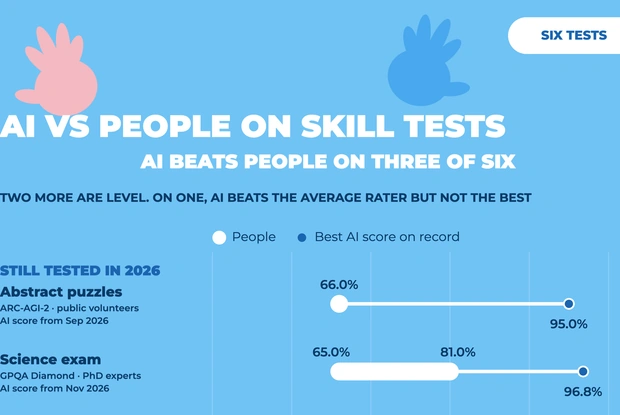
Six tests, each with a published human score. AI beats people on three, is level on two and trails the best raters on one.
19 Nov 2026
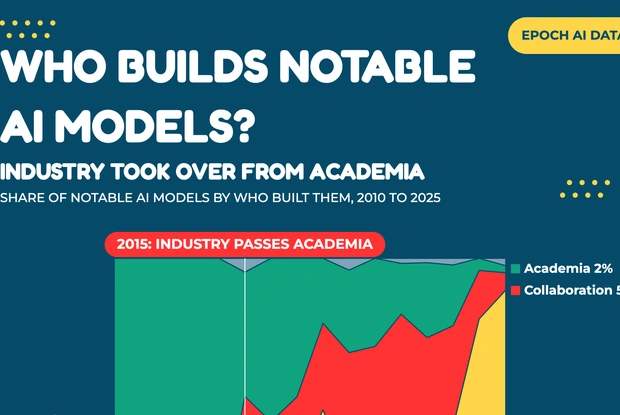
Companies built 102 of the 111 notable AI models Epoch AI recorded for 2025, 92%. In 2010 universities built 8 of 10.
17 Nov 2026
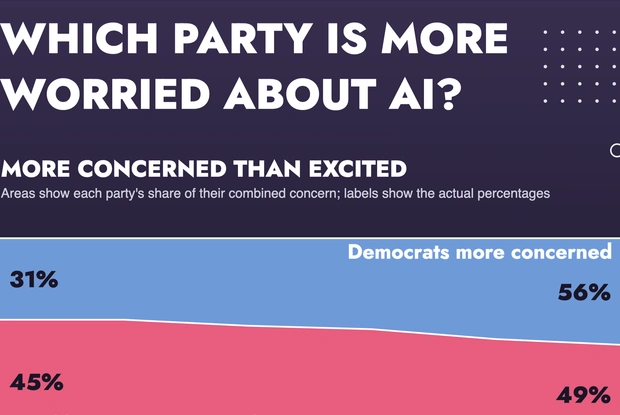
Pew's six surveys: Republicans were 14 points more concerned than Democrats about AI in 2021. In June 2026 Democrats led by 7 points, 56% to 49%.
16 Nov 2026
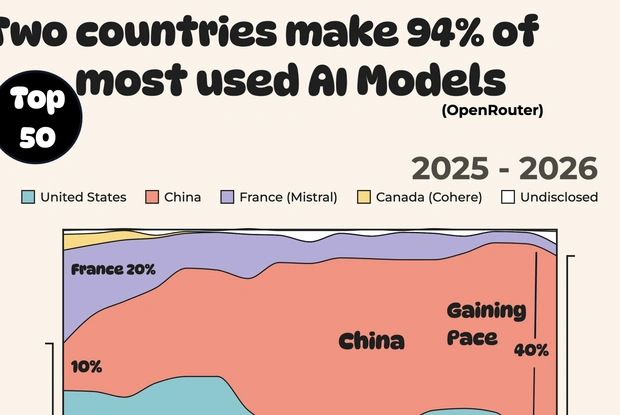
US and Chinese companies trained 94% of OpenRouter's 50 most-used AI models in May 2026, up from 76%. China rose from 10% to 40%.
12 Nov 2026